OBJECTIVE VIDEO QUALITY METRICS: A PERFORMANCE ANALYSIS
José Luis Martínez, Pedro Cuenca, Francisco Delicado and Francisco Quiles
Instituto de Investigación en Informática
Universidad de Castilla La Mancha, 02071, Albacete, Spain
phone: + 34967599200, fax: +34967599224, email: {joseluismm,pcuenca,franman,paco}@dsi.uclm.es web: http://www.i3a.uclm.es
ABSTRACT1
In the last years, the development of novel video coding technologies has spurred the interest in developing digital video communications. The definition of evaluation mechanisms to assess the quality of video will play a major role in the overall design of video communication systems. It is well-known that simple energy based metrics such as the Peak Signal Noise Ratio (PSNR) are not suitable to describe the subjective degradation perceived by a viewer. Recently, new video quality metrics have been proposed in the literature that emulates human perception of video quality since it produces results which are similar to those obtained from the subjective methods. The new models have higher prediction accuracy than the PSNR method, produce consistent results in the range of the data from the subjective tests and are stable across a varying range of video sequences. In this paper, we analyze the capabilities of these new quality measures when are applied to the most popular
Hypothetical Reference Circuits (HRC) such as: video
compression standards, bit-error transmissions and packet losses.
1. INTRODUCTION
The definition of evaluation mechanisms to assess the quality of video plays a major role in the overall design of video communication systems. Most of the efforts in the research community have been focussed on the problem of image quality assessment, and only recently has video quality assessment received more attention. The most reliable way of assessing the quality of a video is subjective
evaluation, because human beings are the ultimate receivers in most applications. The Mean Opinion Score (MOS), which is a subjective quality measurement obtained from a number of human observers, has been regarded for many years as the most reliable form of quality measurement. However, the MOS method is too inconvenient, slow and expensive for most applications. The objective quality metrics are valuable because they provide video designers and standards organizations with means for making meaningful quality evaluations without convening viewer panels. The goal of objective video quality assessment research is to design quality metrics that can predict perceived video quality automatically.
This work was supported by the Ministry of Science and Technology of Spain under CICYT project TIC2003-08154-C06-02, the Council of Castilla-La Mancha under project PREG-05-25 and FEDER.
In this paper, first we undertake a study of current trends on the definition of new objective video quality metrics. Then, we also analyze the capabilities of two representative examples of these types of new quality measures when are applied to different Hypothetical Reference Circuits (HRC) such as: video compression standards, bit-error transmissions and packet losses. For each metric we analyze the correlation between its predictions and the subjective ratings.
The rest of the paper is organized as follows. Section 2 reviews the principles of operation of the most popular objective video quality metrics presented in the literature. In Section 3, we carry out a performance analysis of the presented video quality metrics tools in terms of its predictions and the subjective ratings. We compare the performance of the well-known PSNR metric. Finally, Section 4 draws our conclusions.
2. OBJECTIVE VIDEO QUALITY METRICS
Most of the proposed objective video quality metrics in the literature assume that the undistorted reference signal is fully available. These metrics are referred to as
Full-Reference (FR) video quality metrics. It is worth noting that
in many practical video applications, the reference video signal is often not accessible. These are referred to as
No-Reference (NR) video quality metrics. Finally, there exists a
third type of video quality metrics in which the original video signal is not fully available. Instead, certain features are extracted from the original signal and transmitted to the quality assessment system as side information to help evaluate the quality of the distorted video. This is referred to
as Reduced-Reference (RR) video quality metrics.
Video quality assessment is still far from being a mature research topic. The Video Quality Experts Group (VQEG) was formed to develop, validate and standardize new objective measurement methods for video quality. Although the Phase I test [1], for FR television video quality assessment only achieved limited success, VQEG continues its work on Phase II [2] test for FR quality assessment for television, and reduced-reference (RR) and no-reference (NR) quality assessment for television and multimedia. 2.1 Full-Reference Quality Metrics
Within this category, the most widely used by the scientific community are Mean Square Error (MSE),Signal to Noise
Ratio (SNR) and Peak Signal to Noise Ratio (PSNR), due to
they are simple to calculate, have clear physical meanings, and are mathematically easy to deal with for optimization
purposes.However, it is well-known that these metrics are not suitable to describe the subjective degradation perceived by a viewer [3].
There is therefore a need to define new metrics able to take two factors: the quality as perceived by the human visual system and the temporal relation present in video sequences. Towards this end, the video quality metrics of this family have been developed by taking into consideration the physiological characteristics of the Human
Visual System (HVS). Summarizing, an elaborate video
quality metric implement the following HVS features: eye optics modelled by a low-pass PSF, color processing, non-uniform retinal sampling, light adaptation (luminance masking), contrast sensitivity functions, spatial frequency, temporal frequency and orientation selective signal analysis, masking and facilitation, contrast response saturation and pooling. A survey of video quality metrics based in HVS models can be found in [4].
2.1.1 MPQM Tool
As representative example of video quality metric based in HVS models, we have chosen the tool developed by Van
den Branden Lambrecht et al [5]. His proposed Moving
Picture Quality Metric (MPQM) consists of a channel
decomposition into four scales, four orientations and two temporal streams. The resulting channel outputs are subtracted to create the error signal. Masking is implemented by normalization of the channel errors by the stimulus dependent visibility thresholds (similar to those used in still image quality assessment metrics). Motion rendering quality assessment has also been proposed by extending the MPQM by extraction of motion information [6].
One important factor affecting the feasibility of HVS based video quality metrics is its computational complexity. While complex quality assessment methods may model the HVS more accurately, their computational complexity may be prohibitively large for many platforms, especially for real-time quality assessment of high-resolution video. Motivated for these and other limitations of video quality metrics based in error sensitivity measures, others authors have proposed an alternative way to think about FR video quality assessment. In [7] the authors establish that the main function of the human visual system is to extract structural information from the viewing field, and the human visual system is highly adapted for this purpose. Therefore, a measurement of structural distortion should be a good approximation of perceived image distortion. 2.2 Reduced-Reference Quality Metrics
These metrics are based on linear and non-linear transformations of distortion metrics by taking into account certain image characteristics. Some of characteristics considered in these metrics are block effects, fuzzy edges and temporal distortions. A set of coefficients of a linear or non-linear combination is then defined. This selection aims to maximize the correlation between the image characteristics and the results of a set of subjective tests.
2.2.1 VQM Tool
As representative example of video quality metrics based on linear and non-linear transformations of distortion metrics, we have chosen the tool developed by Webster et al [8], which is based on extracting localized spatial (SI) and temporal (TI) activity features. Three comparison metrics are derived from the SI and TI features of the reference and the distorted videos. The features for the reference video are transmitted over the RR channel.
The work was extended in [9], where the video quality model uses reduced bandwidth features that are extracted from spatial-temporal (S-T) regions of processed input and output video scenes. These features characterize spatial detail, motion, and color present in the video sequence. Spatial features characterize the activity of image edges, or spatial gradients. Digital video systems can add edges (e.g., edge noise, blocking) or reduce edges (e.g., blurring). Temporal features characterize the activity of temporal differences, or temporal gradients between successive frames. Digital video systems can add motion (e.g., error blocks) or reduce motion (e.g., frame repeats). Chrominance features characterize the activity of color information. Digital video systems can add color information (e.g., cross color) or reduce color information (e.g., color sub-sampling). Gain and loss parameters are computed by comparing two parallel streams of feature samples, one from the input and the other from the output. Gain and loss parameters are examined separately for each pair of feature streams since they measure fundamentally different aspects of quality perception. The feature comparison functions used to calculate gain and loss attempt to emulate the perceptibility of impairments by modeling perceptibility thresholds, visual masking, and error pooling. A linear combination of the parameters is used to estimate the subjective quality rating. Impairment metric denominated Video Quality Metric (VQM) is defined using these features.
VQM is structured in five fully automated objective video quality models; (1) General, (2) Television, (3) Video conferencing, (4) Developer and (5) PSNR. The general model was designed to be a general purpose VQM for video systems that span a very wide range of quality and bit rates. The television model was specifically optimized for television impairments (e.g., MPEG-2) while the video conferencing model was specifically optimized for video conferencing impairments (e.g., H.263, MPEG-4). The developer’s model was optimized using the same wide range of video quality and bit rates as the general model but with the added constraint of fast computation. The PSNR model was derived from traditional PSNR following the formula: ( )
,
10
55
1
1
6675 . 25 * 1701 . 0≤
≤
+
=
−PSNR
e
VQM
P PSNRAn automatic calibration technique (e.g., spatial registration, temporal registration, gain/offset estimation and correction) have also been completely implemented .
3. PERFORMANCE ANALYSIS
In this section, we carry out a comparative performance analysis of the three representative video quality metric tools belongs to the different approaches presented in section 2. The three metrics considered for this study are: traditional PSNR, MPQM and VQM. For VQM tool we have selected Television (TV), Videoconferencing (VCONF) and PSNR models according to the different size format used and their associated bit rates.
Our performance evaluation has been structured in the following three scenarios using three different HRCs. In the first scenario, as HRC we have used the majority of video compression standards (H.261, H.263, MPEG-2, and H.264/AVC), on the contrary to VQEG FR-TV Phase-II test, where the H.263 and MPEG-2 encoders are used. In the second scenario, as HRC we have used the well-know burst error channel Gilbert model [10], in order to simulate bit-errors in a video communication system. Finally, in the third scenario, as HRC we have used an IEEE 802.11b WLAN model consisting of an access point and several wireless stations in order to simulate video packet losses in a wireless video communication application.
Since the goal of the objective metrics is to predict perceived video quality, it is essential to build video database with subjective evaluation scores associated with each of the video sequences in the database. For subjective evaluations for video sequences we use the Double Stimulus Continuous
Quality Scale (DSCQS) recommended by VQEG FR-TV
Phase-II test [2].
In our experiments, we have used various video sequences exhibiting different spatial and temporal characteristics and different size formats (CCIR: Mobile, Flower and Tennis video sequences, CIF: Tempete, Funny and Mobile video sequences and QCIF: Silent, News and Akiyo video sequences). Some of these sequences were also used in VQEG FR-TV Phase-II test. In our experiments, we have preferred use a different video database. Moreover, we have selected different size formats (CCIR, CIF and QCIF), on the contrary to VQEG FR-TV Phase-II test, where the CCIR size format is preferred.
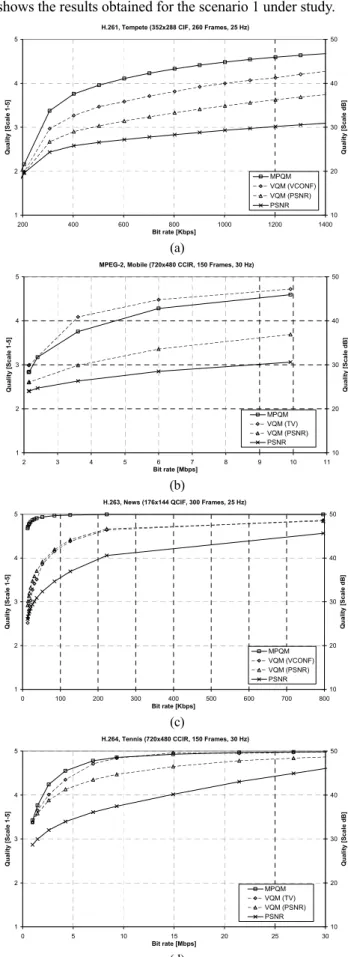
3.1 Scenario 1: Effects of the Codecs and Format Sizes In this scenario, the video sequences from video database have been encoded at different bit-rates using all the encoders mentioned above. The sequences have then been decoded and evaluated using the three metrics under consideration. The MPQM, VQM (TV), VQM (VCONF) and VQM (PSNR) use the well-known scale between 1 and 5 (Recommendation CCIR-500-3). In the next figures, we show the results regarding these metrics in the left ‘y’ axe. The traditional PSNR uses the typical scale in decibels (dB). We show the results regarding this metric in the right ‘y’ axe.
For all the sequences under study, we observed (subjective valuation) that a significant increase on the subjective quality for encoding rates spanning in the lower bit-rate range. A less perceptible increase was observed in the middle bit-rate range. And beyond a threshold, the
subjective increase was almost imperceptible. Figure 1 shows the results obtained for the scenario 1 under study.
H.261, Tempete (352x288 CIF, 260 Frames, 25 Hz)
1 2 3 4 5 200 400 600 800 1000 1200 1400 Bit rate [Kbps] Qual it y [ S cal e 1-5] 10 20 30 40 50 Q u alit y [S ca le d B ] MPQM VQM (VCONF) VQM (PSNR) PSNR (a)
MPEG-2, Mobile (720x480 CCIR, 150 Frames, 30 Hz)
1 2 3 4 5 2 3 4 5 6 7 8 9 10 11 Bit rate [Mbps] Qual it y [Sc al e 1-5 ] 10 20 30 40 50 Qu al it y [Sc al e d B ] MPQM VQM (TV) VQM (PSNR) PSNR (b)
H.263, News (176x144 QCIF, 300 Frames, 25 Hz)
1 2 3 4 5 0 100 200 300 400 500 600 700 800 Bit rate [Kbps] Quali ty [ S cale 1-5] 10 20 30 40 50 Q u ali ty [ S c ale dB] MPQM VQM (VCONF) VQM (PSNR) PSNR (c)
H.264, Tennis (720x480 CCIR, 150 Frames, 30 Hz)
1 2 3 4 5 0 5 10 15 20 25 30 Bit rate [Mbps] Qual it y [ S cal e 1-5] 10 20 30 40 50 Qual it y [ S cal e dB] MPQM VQM (TV) VQM (PSNR) PSNR (d)
From the results in Figure 1, we observe that the worst results are obtained using the traditional PSNR metric. From the results, it is evident the two main limitations of these metric: 1) they do not provide us with a measure of the quality of video as perceived by the end user. Furthermore, they do not even provide us with an indication of what it has been observed during the subjective experimental evaluation. 2) This metric was mainly designed to evaluate the quality of fixed images and it is not well adapted for evaluating video sequences. It does not take the temporal relation existing in a video sequences.
Figure 1 also shows an important result when applying the MPQM and VQM (VCONF and PSNR models) metrics to QCIF sequences. As shown in the figure, contrary to the traditional PSNR, these metrics are able to capture the saturation point for video quality for encoding rates beyond the mentioned threshold. However, the results for MPQM metric fail to indicate the difference on the video quality perceived (subjective tests) for lower video encoding rates (below 100 kbps). MPQM metric provides a score beyond the 4.5 mark even for the lowest encoding rates. The fact that this metric provides a high score in the lowest bit-rate range may be due mainly to the fact that MPQM was tuned up for higher size formats. We can conclude that VQM (VCONF and PSNR models) metric provides us with the best results with respect to the subjective evaluation for QCIF sequences. This is also true for CIF format. However, for CCIR format, VQM (TV model) and MPQM metrics provides us with the best results with respect to the subjective evaluation. This is due to VQM (TV model) and MPQM metrics were specifically optimized for TV impairments.
From the results obtained in this scenario, we can conclude that the VQM metrics provides us, in general, with the best results with respect to the subjective evaluations. This is due mainly to the fact that this metric has been designed taken into account the characteristics of the major video applications and size formats. Moreover, the VQM metric has lower computational cost than MPQM metric; one important factor affecting the feasibility of a video quality metric. On the contrary, MPQM metric is only able to capture the subjective evaluations for a particular type of video applications; the TV video signal. These general conclusions were confirmed using all the encoders under study in this scenario (for space limitations reasons, we only include in figure 1 a selection of the different possible combinations of codec/format-size). See [11] for a complete analysis.
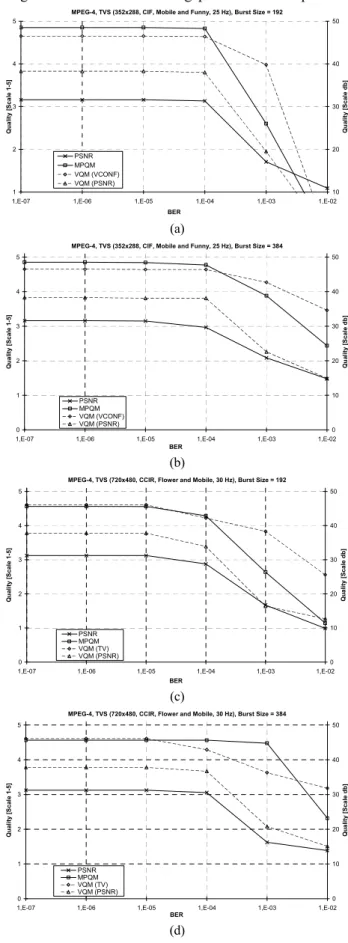
3.2 Scenario 2: Effects of the Bit-Errors
In this scenario, the video sequences from video database have been concatenated in order to form Test Video
Sequences (TVS) at different size formats (CIF and CCIR)
and encoded with an MPEG-4 encoder. Then we use the well-know bit error channel Gilbert model, in order to insert bit errors into the TVS at different Bit Error Rates (BER) and
Burst Sizes. Figure 2 shows the results obtained for the
scenario 2 under study. From the results in Figure 2, we can conclude that the VQM metrics provides us, in general, with
the best results with respect to the subjective evaluations. This is due mainly to the fact that this metric has been designed taken into account the gaps in the decoder process.
MPEG-4, TVS (352x288, CIF, Mobile and Funny, 25 Hz), Burst Size = 192
10 20 30 40 50 1,E-02 1,E-03 1,E-04 1,E-05 1,E-06 1,E-07 BER Q u al it y [ S ca le d b ] 1 2 3 4 5 Q u al it y [ S cal e 1-5] PSNR MPQM VQM (VCONF) VQM (PSNR) (a)
MPEG-4, TVS (352x288, CIF, Mobile and Funny, 25 Hz), Burst Size = 384
0 10 20 30 40 50 1,E-02 1,E-03 1,E-04 1,E-05 1,E-06 1,E-07 BER Qu al ity [S ca le d b ] 0 1 2 3 4 5 Q u al it y [ S ca le 1 -5 ] PSNR MPQM VQM (VCONF) VQM (PSNR) (b)
MPEG-4, TVS (720x480, CCIR, Flower and Mobile, 30 Hz), Burst Size = 192
0 10 20 30 40 50 1,E-02 1,E-03 1,E-04 1,E-05 1,E-06 1,E-07 BER Q u al it y [ S cal e db ] 0 1 2 3 4 5 Q u al it y [ S ca le 1-5] PSNR MPQM VQM (TV) VQM (PSNR) (c)
MPEG-4, TVS (720x480, CCIR, Flower and Mobile, 30 Hz), Burst Size = 384
0 10 20 30 40 50 1,E-02 1,E-03 1,E-04 1,E-05 1,E-06 1,E-07 BER Q u al it y [ S ca le db ] 0 1 2 3 4 5 Q u al it y [ S ca le 1 -5] PSNR MPQM VQM (TV) VQM (PSNR) (d)
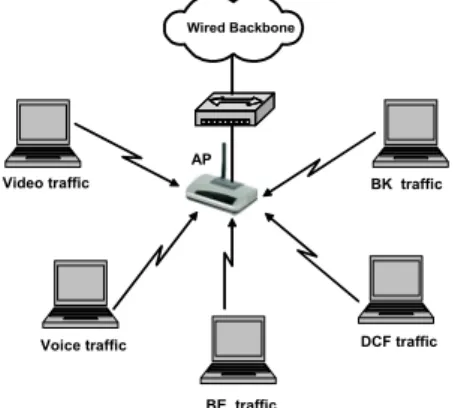
3.3 Scenario 3: Effects of the Video Packet Losses In this scenario, we model an 11 Mbit/s IEEE 802.11b wireless LAN supporting five types of services: Voice(Vo), Video(Vi), Best-effort(BE), Background(BK) and DCF, see figure 3. This classification is in line with the IEEE802.1d standard specifications. Each wireless station transmits a single traffic type (Vo, Vi, BE, BK or DCF) to the access point. We assume the use of constant bit-rate voice sources encoded at a rate of 16 kbits/s according to the G.728 standard. For the video applications, we have made use of the trace generated from a variable bit-rate MPEG-4 video encoder, using TVS (CIF format). The average video transmission rate is around 1050 kbits/s. The best-effort and background traffics have been created using a Pareto distribution traffic model with average sending rate of 128 kbit/s and 256 kbit/s, respectively. Finally, the traffic generated by DCF is 256 kbits/s. We have assumed that one fifth of the stations support one of the five kinds of services: voice, video, BE, BK and DCF applications. We start by simulating a WLAN consisting of five wireless stations (each one supporting a different type of traffic). We then gradually increase the Total Offered Load of the wireless LAN by increasing the number of stations by five. We increase the number of stations 5 by 5 starting from 5 and up to 40. In this way, the normalized offered load is increased from 0.14 up to 1.12. In order to limit the delay experienced by the multimedia applications, the maximum time that video packet and voice packet may remain in the transmission buffer has been set to 100ms and 10ms, respectively. Whenever a video or voice packet exceeds these upper bounds, it is dropped. DCF traffic Voice traffic Video traffic BE traffic BK traffic AP Wired Backbone
Figure 3– Network Topology of the Scenario 3. MPEG-4, TVS (352x288, Cif, Mobile and Funny, 25 Hz)
0 1 2 3 4 5 0 0,2 0,4 0,6 0,8 1
Total Offered Load
Q u alit y [ S cal e 1 -5 ] 10 20 30 40 50 Qu al ity [Sc a le d b ] MPQM VQM (VCONF) VQM (PSNR) PSNR
Figure 4– Video-Quality Metrics results. Scenario 3.
Figure 4 shows the results obtained for the scenario 3 under study. From the results in Figure 3, we can conclude that the MPQM and VQM metrics capture the quality degradation (with respect to the subjective evaluation), when the load is higher than 0.5 (corresponding to 3% of packet losses).
4. CONCLUSIONS
There has been increasing interest in the development of objective video quality measurement techniques that can automatically predict the perceptual quality of video streams. Such methods are useful tools for video database systems and are also desired for a broad variety of video applications. In this paper, we have undertaken a study of the current trends in the definition of video quality metrics. Then, we also analyze the capabilities of two representative examples of the major approaches presented in the literature related to quality measures, when are applied to the most popular Hypothetical Reference Circuits (HRC) such as: video compression standards, bit-error transmissions and packet losses. From the results obtained in this work, we conclude that the VQM metrics provides us with the best results with respect to the subjective evaluation. The main reason why this happens is that this metric has been designed taking into account the characteristics of the major video applications. Moreover, the VQM metric has lower computational cost than MPQM metric.
REFERENCES
[1] VQEG, “Final report from the video quality experts group on the valida-tion of objective models of video quality assessment. Phase I”. Mar. 2000.
http://www.vqeg.org/.
[2] VQEG, “Final report from the video quality experts group on the valida-tion of objective models of video quality assessment. Phase II”. August 2003.
http://www.vqeg.org/.
[3] B. Girod, “What's wrong with mean-squared error”. Digital Images and Human Vision, A. B. Watson, ed., pp. 207-220, MIT Press, 1993.
[4] Z. Wang, H. R. Sheikh, and A. C. Bovik, “Objective video quality as-sessment”. The Handbook of Video Databases: Design and Applications (B. Furht and O. Marques, eds.), CRC Press, 2003.
[5] C. J. van den Branden Lambrecht and O. Verscheure, "Perceptual qual-ity measure using a spatio-temporal model of the human visual system". Proceedings of. SPIE, vol. 2668, (San Jose, LA), pp. 450461, 1996. [6] C. J. van den Branden Lambrecht, D. M. Costantini, G. L. Sicuranza, and M. Kunt, "Quality assessment of motion rendition in video coding". IEEE Transactions Circuits and Systems for Video Technology, vol. 9, pp. 766-782. Aug. 1999.
[7] Z. Wang, L. Lu and A. Bovik, ”Video quality assessment based on structural distortion measurement”. Signal Processing: Image Communica-tion. Vol.19, No.2, pp.121-132. February 2004.
[8]A. Webster, C. Jones, M. Pinson, S. Voran and S. Wolf “An objective video quality assessment system based on human perception”. Human Vision, Visual Processing and Digital Display, vol. SPIE-1913, pp. 15-26. 1993.
[9] S. Wolf and M. H. Pinson, "Spatio-temporal distortion metrics for in-service quality monitoring of any digital video system". Proceedings of SPIE, vol. 3845, pp. 266-277, 1999.
[10] E.O. Elliot, “Estimated of Error-Rates for Codes on Burst-Error Chan-nels”. Bell System Tech. J. Vol. 42, September 1963, pp.1977.
[11] J.L Martínez, P. Cuenca, F. Delicado, L. Orozco-Barbosa. “On the Capabilities of Quality Measures in vides Compresión Standards”. Proceed-ings of IEEE CCECE 2006.