REVIEW
Translational Biomedical Informatics and
Pharmacometrics Approaches in the Drug Interactions
Research
Pengyue Zhang1†, Heng-Yi Wu1†, Chien-Wei Chiang1, Lei Wang1,2, Samar Binkheder3,4, Xueying Wang2, Donglin Zeng5, Sara K. Quinney6and Lang Li1*
Drug interaction is a leading cause of adverse drug events and a major obstacle for current clinical practice.
Pharmacovigilance data mining, pharmacokinetic modeling, and text mining are computation and informatic tools on
integrating drug interaction knowledge and generating drug interaction hypothesis. We provide a comprehensive overview of
these translational biomedical informatics methodologies with related databases. We hope this review illustrates the
complementary nature of these informatic approaches and facilitates the translational drug interaction research.
CPT Pharmacometrics Syst. Pharmacol.
(2018)
7
, 90–102; doi:
10.1002/psp4.12267
; published online 9 January 2018.
Adverse drug events (ADEs), the unintended drug side effects, have led to major public health burden. In the United States alone,>500,000 serious ADEs were reported annually to the US Food and Drug Administration (FDA) during the past 5 years.1 ADEs are one of the leading causes of morbidity and mortality. A meta-analysis of 39 prospective studies suggested that 6.7% of inpatients have severe ADEs and 0.32% have fatal drug reactions.2 Sub-stantial evidence shows that the drug-drug interaction (DDI) is one of the leading causes of ADEs. With the increasing rate of polypharmacy, the risk of ADEs increased from 13% (2 drugs) to 58% (5 drugs).3Hence, efficient and powerful computational approaches are needed in detecting the DDI-induced ADE signals, and investigating their molecular mechanisms.
In order to evaluate clinical effects and molecular mecha-nisms of DDIs, clinical pharmacokinetic (PK) studies, pharmaco-epidemiologic studies, andin vitro PK experiments have been routinely utilized. One salient example is that of breast cancer hormonal therapy, tamoxifen. The formation of its active metabolite, endoxifen, was inhibited by co-administrated selective serotonin reuptake inhibitor paroxetine in a clinical PK study.4 In vitro metabolism studies revealed that this is due to paroxetine’s strong inhibition of the tamoxi-fen biotransformation to endoxitamoxi-fen via the CYP2D6 pathway (5). In a follow-up pharmacogenetics study, patients with breast cancer with CYP2D6 loss function variants had a higher risk of disease relapse and a lower incidence of hot flush.6The clinical consequence of treating breast cancer and depression using tamoxifen and selective serotonin reuptake inhibitors was reviewed,7and called for further investigation.
This example clearly demonstrates that the translational sig-nificance of drug interaction studies relies on both clinical and
molecular pharmacology evidences. As described by Hen-nessy & Flockhart,8 an integrated informatics, epidemiology, and pharmacology approach has the potential to accelerate the translational drug interaction studies. Pioneered by Tato-nettiet al.,9the FDA adverse event reporting system (FAERS) and electronic medical records (EMRs) were utilized to gener-ate and validgener-ate drug-induced ADE and drug-drug-induced ADE associations. Dukeet al.10proposed a text mining strat-egy for DDI molecular pharmacology evidence discovery from the public literature, which discovered 13,197 potential DDIs. In the follow-up in vitro study, Han et al.11 validated the loratadine-simvastatin myotoxicity interaction, and its increased myopathy risk in both EMR and FAERS databases. Driven by the emerging big data and novel computational models, there are three areas in which translational bio-medical informatics and pharmacometrics are having a major impact on the drug interaction research. First, during the past 2 decades, federal regulatory agencies, hospitals, and research organizations maintained various patient databases, such as spontaneous reporting system (SRS), EMRs, and electronic health records (EHRs) for postmar-keting surveillance and epidemiological studies. When these data are increasingly available to the research com-munities, computational models have been developed to identify and prioritize DDIs.12 Second, PKs of DDIs have
been well characterized and predicted with physiologically based pharmacokinetic (PBPK) models. Third, knowledge discovery through the literature has become a powerful approach for the DDI detection, in which the natural lan-guage processing (NLP) is the key computation technology. A few reviews have highlighted some translational bio-medical informatic approaches. For instance, the reviews by Harpaz et al.12 and Koutkias & Jaulent13 focused on
1
Department of Biomedical Informatics, College of Medicine, the Ohio State University, Columbus, Ohio, USA;2Intelligent Systems and Bioinformatics Institute, College of Automation, Harbin Engineering University, Harbin, Heilongjiang, China;3Department of Biohealth Informatics, Indiana University School of Informatics and
Computing, Indianapolis, Indiana, USA;4Medical Informatics Unit, College of Medicine, King Saud University, Riyadh, Saudi Arabia;5Department of Biostatistics, University of North Carolina at Chapel Hill, Chapel Hill, North Carolina, USA;6Department of Obstetrics and Gynecology, Indiana University, Indianapolis, Indiana, USA.
*Correspondence: L Li ([email protected])
†
Pengyue Zhang and Heng-Yi Wu contributed equally to this work.
computational models for SRS and EMR databases. Text and data mining techniques to detect ADE signals were reviewed by Karimi et al.14 Jensen et al.15 summarized
available EMR/EHR databases and the obstacles for the EMR/EHR mining. However, these reviews did not focus on the translational nature in the ADE research, and none of them specifically addressed the DDI research. In this review, we focus on computational approaches for postmar-keting surveillance data mining, PBPK modeling, and literature-based knowledge discovery, because these three approaches complement each other. The rest of this review is organized as follows: data mining methods for the post-marketing surveillance are shown; PBPK DDI models and databases are presented; literature-based DDI discovery approaches are presented; and the last section concludes this review.
DDI DATA MINING METHODS USING THE POSTMARKETING SURVEILLANCE DATA
A brief review of single drug ADE association analyses Univariate disproportionality analyses. Disproportionality analyses (DPAs) are the pioneer approaches to quantify and prioritize single ADE associations. For a drug-induced ADE pair, DPAs summarize data into a two-by-two contingency table, in which contains the frequencies classi-fied by the usage of a drug (yes/no) and the occurrence of an ADE (yes/no). The outcome is the frequency that this drug-induced ADE pair is observed, and the expectation is the expected frequency of this drug-induced ADE pair under the assumption of no association. As its name implies, DPAs compare the outcomes to their expectations. DPAs can be classified as frequentist, Bayesian, or empiri-cal Bayesian. DPAs can be either used to analyze specific induced ADE pairs of interest, or can conduct drug-wide and ADE-drug-wide signal screening.
Proportional reporting ratios (PRRs) and reporting odds ratios (RORs) are frequentist DPAs.16,17 ROR calculates
the ratio of the ADE odds between the group of patients taking the drug and the other patients not taking the drug. PRR, on the other hand, calculates the ratio of two relative ADE risks between two patient groups. Practically, PRR_025 and ROR_025, the lower bound of 95% confi-dence intervals for PRR and ROR, are also often used for the signal detection. The likelihood ratio test (LRT) is another frequentist DPA.18 It assumed that the drug-induced ADE frequency follows a Poisson distribution. Under the null hypothesis, this Poisson distribution had the same ADE rate as the background rate (i.e., the ADE rate for patients not taking the drug; and under the alternative hypothesis, they are not the same). The log-likelihood ratio statistics are then constructed to test this hypothesis. The LRT tests a drug and all ADEs at the same time, and the distribution of the maximum LRT can be calculated through the permutations.
Information component (IC) is a Bayesian DPA.19 This approach assumes that the drug-induced ADE frequency follows a binomial distribution itself; its expected frequency is calculated from the marginal drug frequency and ADE frequency; and the prior distribution of drug marginal
frequency and ADE marginal frequency are assumed to be uniform distributions. The IC calculates the expected ratio between drug-induced ADE frequency and its expected fre-quency under all these distribution assumptions. Later, Norenet al.20 introduced a joint Dirichelet distribution prior and extended Bate’s IC model. Like PRR and ROR, signal detection using IC can be based on its lower bound of the 95% confidence interval (IC_025). The empirical Bayesian geometric mean (EBGM) is an empirical Bayesian DPA. Sim-ilar to the IC approach, EBGM calculates the expected ratio between drug-induced ADE frequency and its expected fre-quency.21 However, different from the IC approach, a
two-component mixture of gamma distributions was chosen to model the ratio, and this mixture model was further estimated from the data instead of prespecified prior distribution. The Bayesian false-discovery rate (BFDR) is another empirical Bayesian DPA.22 For the above-mentioned PRR, ROR, and
EBGM models, BFDR calculates the posterior probability for a predefined null hypothesis. For instance, BFDR was origi-nally applied to the EBGM model22; and later on, it was also
applied to the PRR.23 BFDR itself can be used for signal detection.
Three-component mixture model (3CMM) is an empirical Bayesian DPA developed by our group.24 Similar to the EBGM, 3CMM utilizes gamma-Poisson assumption as well. However, unlike EBGM, 3CMM has three distributions that characterize the ratio between drug-induced ADE frequency and its expected frequency; and the local false discover rate is introduced for false-positive control. Under 3CMM, the first distribution specifies the point mass distribution at 0 for the ratio; the second distribution has a mean ratio of 1; and the third one has a mean>1. Particularly, the sec-ond distribution characterizes the null hypothesis, whereas the third distribution characterizes the alternative hypothe-sis. Hence, the local false discover rate estimates the prob-ability of the null distribution conditional on the data and the 3CMM.
Multivariate analyses.Univariate DPAs suffer from the con-founding bias, which can be addressed in multivariate anal-ysis. Tatonetti et al.9 assumes that confounding variables, such as comorbidities, can be characterized by the comedi-cation variables. He applied the logistic regression model first, and estimated the propensity score for each drug of interest. Then, in analyzing a drug-induced ADE associa-tion, this drug’s propensity score was used to adjust the confounding variables.
DPAs are less computationally expensive compared within other multivariate approaches.12 Additionally, DPAs can be used either to analyze specific drug-induced ADE pairs of interest, or can conduct drug-wide and ADE-wide signal screening. Although the disproportionality measure-ments may suffer from confounding bias, evaluations by gold standard have shown DPAs to have decent performan-ces (area under the concentration-time curve (AUC)).27 Hence, DPAs are routinely used for large-scale hypothesis generation. Multivariate analyses, on the other hand, are typically observed in epidemiology studies to validate a few candidate drug-induced ADE associations.
For logistic regression modeling, the number of predic-tors is usually less than 2,000, which is similar to the num-ber of FDA approved drugs. For pharmacovigilance databases, the sample sizes are usually up to a few million. As a consequence, enhanced computational resources or smart techniques are required to handle the big data chal-lenge. Our experiences indicate that a super computer with 50 GB memory can handle MLR with a few hundred drugs and four million observations. With less powerful computa-tional resources, bootstrap regression would be an ideal solution.
Drug interaction signal detection
Some of the DPAs in this review can be extended to detect drug interaction signals. By treating a drug combination as a new drug, the disproportionality measurements can be obtained, accordingly. For instance, Huang et al.28 intro-duced an extended LRT method that can be used for detecting signals for multiple drugs (or ADEs) in a drug class (or in an ADE group). Likewise, an extended higher order IC method is proposed by Noren et al.20Higher order IC is based on the same model assumption as the tradi-tional IC, and its credibility interval can be derived similarly. They cannot only be used for detecting the potential DDIs, but also can be used for detecting the association between a drug-induced ADE pair and another risk factor (e.g., age or gender). The examples for the extended EBGM can be found in Almenoff et al.29 and DuMouchel & Pregibon.30 Although these extended DPAs can be used for detecting the potential DDI signals, these approaches cannot distin-guish the signals that are associated with drug interactions or just with independent drugs.
Noren et al.31 proposed a novel model for detecting
two-way DDIs. In their model, a ratio of the DDI-induced ADE risk and its expected ADE risk is calculated, and the expected ADE risk is calculated from the single drug-induced ADE risk from both drugs and baseline ADE risk from neither drugs. Like the IC approach, a Bayes approach is taken to estimate the expected DDI risk ratio, and an uninformative prior was speculated for the prior. This prior has the advan-tage of shrinking the ratio toward 1 when the sample size is small.
The regression-based method for detecting DDIs can avoid the confounding variable problems. Examples for the logistic regression model applied for detecting potential DDIs from SRS can be found in Van Puijenbroeket al.32 Thakrar et al.33 proposed multiplicative and additive rela-tionship to model the risks for single drugs and DDI pairs.
The multiplicative model assumes that the risk associated with a drug multiplies with the background risk, and the additive model assumes that the risk associated with a drug is additive to the background risk. Their results show that the additive model is a more sensitive method for detecting signals and the multiplicative model may further help on qualifying the strength of the signals detected by the additive model. In addition to detecting the ADEs that were caused by the DDIs, the regression model can also be used for detecting the signals that one drug may reduce the ADEs of the other drug (i.e., beneficial effects of DDIs).
High dimensional drug interaction detection
We recently developed a novel mixture drug-count response model (MDRM) to characterize and detect high dimensional drug interaction signals.34 MDRM is an empirical Bayesian
method. This model assumes that the drug-induced ADE fol-lows two patterns: one pattern assumes a constant ADE risk regardless of the dimension of the drug combinations, whereas the other pattern assumes that ADE risk increases like the dose (i.e., drug counts) response curve. This model then estimates a probability for each drug combination that follows the drug-count response model. MDRM, for the first time, characterizes the pattern of high dimensional drug interactions and ADEs. Its innovation lies in the fact that MDRM allows different drug combinations to share the same drug-count response relationship, as the sample size of each drug combination goes very small when the dimension of the drug combination increases.
Currently, the amount of FDA-approved drugs generate over millions of two-way drug combinations; and as the dimension of drug combination increases, the amount of plausible drug combinations increases in a factorial speed. As traditional statistical models are insufficient to deal with the tremendous amount of drug combinations, informatic approaches become a promising and practical solution. Two major informatic techniques to detect drug interaction signals include frequent closed itemset (FCI) mining and association rule mining. FCI is powerful on eliminating redundant drug combinations. For instance, if drug A, drug B, ADE X, ADE Y is a FCI, then its subsets (such as drug A, ADE X) are considered to be redundant. These redun-dant subsets can be removed unless such a subset appears in a record that does not contain all items of drug A, drug B, ADE X, ADE Y. Xianget al.35proposed an
PHARMACOKINETICS MODELING AND DATA SOURCES
In vitro in vivodrug interaction prediction using pharmacokinetics modeling
There are two ways to characterize PKs of drug. The top-down approach investigates clinical pharmacokinetic using clinical trial data, and it builds up a population PK model. The bottom-up approach, on the other hand, starts from PK data measured from in vitrostudies, and extrapolates and predicts clinical drug exposure in humans. In this review, we will focus on one of the bottom-up approaches, steady statein vitro-in vivoextrapolation (IVIVE) of drug interaction prediction. There are other great and comprehensive reviews on the bottom-up approach.37,38 We select our
focused IVIVE model because it is the one that can be scaled up (i.e., including potentially all drugs), and inter-faced with informatic analyses.
The ratio of AUC (AUCR) in the present and absence of inhibitors is widely used to determine the severity of a DDI. Here, we focus on a static DDI model proposed by Ito
et al.39 and modified by Lu et al.,40 which calculates the
AUCR based on unbound inhibitor concentration ([I]), inhibi-tion rate constant for a drug (Ki), fracinhibi-tion of metabolism (fm) and fraction of renal clearance (fe) in Eq. 1.
AUCR5 AUC inhibitedð Þ
AUC uninhibitedð Þ5
1
12fe
ð ÞPni51 fmi3 1
11 PJ
j51 Ij
½
kij
2 6 4
3 7 51fe
(1)
All of these parameters can be obtained from various avail-able data sources, except for fm. For example, the Metabo-lism and Transport Drug Interaction Database (DIDB) has a collection of drug Ki, and the book by Goodman and Gil-man41has a collection of fe and drug maximum concentra-tion (Cmax), which can be used as [I]. There are several
ways to estimate fm for a substrate. First, change in AUC or clearance in the presence of a co-administered CYP inhibitor through a clinical PK study is used to determinate the contribution of the CYP for a drug. For example, Yeung
et al.42 utilized clinical drug interaction studies, in which
ketoconazole was used as the CYP3A4 probe inhibitor, and calculated a drug’s fm in the CYP3A4 pathway using Eq. 2:
fm3A4512
AUC uninhibitedð Þ
AUC inhibitedð Þ (2)
Second, pharmacogenetic studies can also be used to esti-mate fm through the fold-change in exposure of a substrate in extensive metabolizers compared to poor metabolizers.39
A large population of patients were studied with respect to the metabolism of metoprolol, which was metabolized by CYP2D6,43and fm was calculated by Eq. 3:
fm2D6512
AUC CYPð 2D6;EM;AVGÞ
AUC CYPð 2D6;PM;AVGÞ512
CL CYPð 2D6;PM;AVGÞ
CL CYPð 2D6;EM;AVGÞ (3)
Third, in vitroexperiments also have been used to deter-mine the contributions of several CYP pathways. Substrate depletion in the human liver microsomes is one method that the drug is incubated with or without specific CYP selective inhibitors. The percent of inhibition can be calcu-lated by comparing the metabolism rates with and without an inhibitor. Substrate depletion can also be incubated with individual recombinant enzymes isoforms.44 Each isozyme contribution is estimated as the percent contribution of each CYP enzyme toward the total human liver microsome CLint via a scaling factor (RAF/ISEF) approach.45Recently, due to the success of the cryopreservation of human hepa-tocytes,46 the hepatocyte suspension model47 becomes a
new method to estimate fm. Physiologically, cryopreserved human hepatocyte is closer to the human hepatic metabo-lism than the other in vitro system does. Desbans et al.48 used cryopreserved human hepatocytes from 12 donors to estimate fm of CYP3A for 5 prototypical CYP3A substrates. After hepatocytes were incubated with test compounds and/or the inhibitor, the intrinsic clearance was estimated from the parent compound depletion profile. Then fmCYP3A was calculated from the ratio between CLint in the absence and presence of ketoconazole as Eq. 4:
fm3A512
CLintðinhibitedÞ
CLintðuninhibitedÞ
(4)
Although there are several different methods successful to determine fm, there is no comprehensive database that systematically stores fm for DDI research.
Adverse drug reactions databases and data sources
There are a number of drug-related databases that inte-grate bioinformatics, cheminformatics, and/or DDI knowl-edge, which have been widely used for the drug interaction alerting in a large range of clinical decision support and electronic prescribing systems. Meanwhile, clinical signal-based databases can be helpful for understanding the mechanism of action for drugs.11 In addition, part of
pre-market drug development relies on the drug information and DDI knowledge to predict interactions between a new drug candidate and drugs currently on the market.
DDI-related database. The DrugBank49 is a well-known
comprehensive database that contains bioinformatics and chemo-informatic resource of 9,591 drugs, including mole-cule and biotech drugs. It combines detailed chemical, pharmacological, and pharmaceutical information with com-prehensive drug targets, such as sequence, structure, or pathway information. All of these can be useful for ADE research. In addition, DDI knowledge is included in the database. However, due to the simple description, additive and synergic interactions are hardly differentiated. There-fore, it is difficult to assure that an ADE is caused by a true interaction or simple dose increase. There are other similar comprehensive databases including Drugs.com50and Kyoto
Encyclopedia of Genes and Genomes (KEGG).51 Some
listed on the FDA’s official drug label.9These signals were mined from FAERS data by a data-driven approach that removes many synthetic associations from indications, coprescriptions, and hidden covariates. Using the same method, DDI signals were further derived from FAERS data, which is called TWOSIDES.9
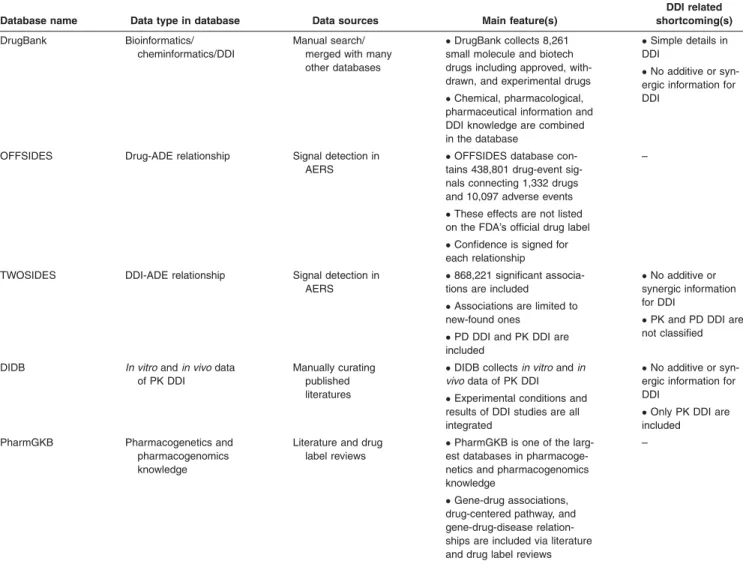
Other databases in which clinical information and mecha-nism knowledge are included, were derived from text min-ing and literature curatmin-ing methods. By manually curatmin-ing published literatures and FDA New Drug Application reviews, the DIDB collects in vitro and in vivo data of PK drug interactions. Unlike DrugBank, experimental conditions and results of DDI studies, which are crucial DDI factors, are all integrated in the DIDB database. Another important database is PharmGKB.52It is one of the largest databases collecting associations among genes, drugs, and diseases published in the literature. PharmGKB is well regarded as a reliable resource for personalized medicine and pathway-oriented DDI research.52 Table 1 provides summarized main features of DDI-related databases.
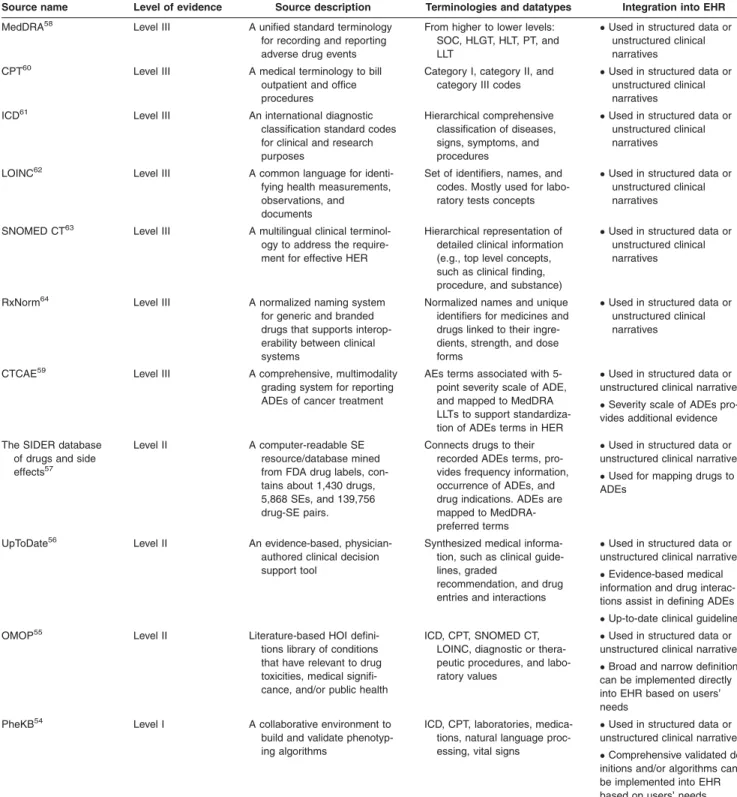
ADE-phenotyping sources. Our focused ADE-phenotype refers to an EHR-based patient cohort definition, which experiences an ADE.53 Here, we provide ADE-phenotype sources, level of evidence, terminologies, and data types, and their integration with EHRs (Table 2,54–64). Four crite-ria of ADE evidence are given as the following: ADE defini-tion algorithm validadefini-tion (criterion 1); comprehensiveness of the ADE definition algorithm (criterion 2); literature and/or ADE-related evidence (criterion 3); and terminological sup-port for structured and unstructured data (criterion 4). Using these four criteria, we define the three levels of ADE evidence.
Level I evidence provides the highest reliable and precise ADE phenotypes. They met criteria 1, 2, and (3 and/or 4). For instance, the Phenotype Knowledgebase (PheKB) web-site,54 “an online environment supporting the workflow of building, sharing, and validating electronic phenotype algo-rithms,” which offers algorithms using approaches, such as International Classification of Disease, 9th revision-Clinical Modification (ICD-9-CM) codes, medications, and NLP. The Table 1Summary of drug/DDI-based databases
Database name Data type in database Data sources Main feature(s)
DDI related shortcoming(s)
DrugBank Bioinformatics/
cheminformatics/DDI
Manual search/ merged with many other databases
DrugBank collects 8,261
small molecule and biotech drugs including approved, with-drawn, and experimental drugs
Chemical, pharmacological,
pharmaceutical information and DDI knowledge are combined in the database
Simple details in
DDI
No additive or
syn-ergic information for DDI
OFFSIDES Drug-ADE relationship Signal detection in
AERS
OFFSIDES database
con-tains 438,801 drug-event sig-nals connecting 1,332 drugs and 10,097 adverse events
These effects are not listed
on the FDA’s official drug label
Confidence is signed for
each relationship
–
TWOSIDES DDI-ADE relationship Signal detection in
AERS
868,221 significant
associa-tions are included
Associations are limited to
new-found ones
PD DDI and PK DDI are
included
No additive or
synergic information for DDI
PK and PD DDI are
not classified
DIDB In vitroandin vivodata of PK DDI
Manually curating published literatures
DIDB collectsin vitroandin
vivodata of PK DDI
Experimental conditions and
results of DDI studies are all integrated
No additive or
syn-ergic information for DDI
Only PK DDI are
included
PharmGKB Pharmacogenetics and
pharmacogenomics knowledge
Literature and drug label reviews
PharmGKB is one of the
larg-est databases in pharmacoge-netics and pharmacogenomics knowledge
Gene-drug associations,
drug-centered pathway, and gene-drug-disease relation-ships are included via literature and drug label reviews
–
PheKB’s main goals are to improve algorithm transportabil-ity and validtransportabil-ity across institutions,54 while achieving high positive predictive values.
Level II evidence provides ADE phenotypes that met cri-teria 3, and (2 and/or 4), but they have not been validated
across institutions. For instance, the Observational Medical Outcomes Partnership (OMOP)55 has a library based on systematic literature review of a number of health outcomes of interest (HOIs) definitions to improve observational stud-ies’ reproducibility. The OMOP also recognized that Table 2Sources for ADE-phenotyping
Source name Level of evidence Source description Terminologies and datatypes Integration into EHR
MedDRA58 Level III A unified standard terminology
for recording and reporting adverse drug events
From higher to lower levels: SOC, HLGT, HLT, PT, and LLT
Used in structured data or
unstructured clinical narratives
CPT60 Level III A medical terminology to bill
outpatient and office procedures
Category I, category II, and category III codes
Used in structured data or
unstructured clinical narratives
ICD61 Level III An international diagnostic
classification standard codes for clinical and research purposes
Hierarchical comprehensive classification of diseases, signs, symptoms, and procedures
Used in structured data or
unstructured clinical narratives
LOINC62 Level III A common language for
identi-fying health measurements, observations, and documents
Set of identifiers, names, and codes. Mostly used for labo-ratory tests concepts
Used in structured data or
unstructured clinical narratives
SNOMED CT63 Level III A multilingual clinical
terminol-ogy to address the require-ment for effective HER
Hierarchical representation of detailed clinical information (e.g., top level concepts, such as clinical finding, procedure, and substance)
Used in structured data or
unstructured clinical narratives
RxNorm64 Level III A normalized naming system
for generic and branded drugs that supports interop-erability between clinical systems
Normalized names and unique identifiers for medicines and drugs linked to their ingre-dients, strength, and dose forms
Used in structured data or
unstructured clinical narratives
CTCAE59 Level III A comprehensive, multimodality
grading system for reporting ADEs of cancer treatment
AEs terms associated with 5-point severity scale of ADE, and mapped to MedDRA LLTs to support standardiza-tion of ADEs terms in HER
Used in structured data or
unstructured clinical narratives
Severity scale of ADEs
pro-vides additional evidence
The SIDER database of drugs and side
effects57
Level II A computer-readable SE
resource/database mined from FDA drug labels, con-tains about 1,430 drugs, 5,868 SEs, and 139,756 drug-SE pairs.
Connects drugs to their recorded ADEs terms, pro-vides frequency information, occurrence of ADEs, and drug indications. ADEs are mapped to MedDRA-preferred terms
Used in structured data or
unstructured clinical narratives
Used for mapping drugs to
ADEs
UpToDate56 Level II An evidence-based,
physician-authored clinical decision support tool
Synthesized medical informa-tion, such as clinical guide-lines, graded
recommendation, and drug entries and interactions
Used in structured data or
unstructured clinical narratives
Evidence-based medical
information and drug interac-tions assist in defining ADEs
Up-to-date clinical guidelines
OMOP55 Level II Literature-based HOI
defini-tions library of condidefini-tions that have relevant to drug toxicities, medical signifi-cance, and/or public health
ICD, CPT, SNOMED CT, LOINC, diagnostic or thera-peutic procedures, and labo-ratory values
Used in structured data or
unstructured clinical narratives
Broad and narrow definitions
can be implemented directly into EHR based on users’ needs
PheKB54 Level I A collaborative environment to
build and validate phenotyp-ing algorithms
ICD, CPT, laboratories, medica-tions, natural language proc-essing, vital signs
Used in structured data or
unstructured clinical narratives
Comprehensive validated
def-initions and/or algorithms can be implemented into EHR based on users’ needs
literature has usually been inconsistent in defining and reporting ADEs, and sometimes lacking details of the exact codes and validations.65For example, acute liver injury has eight different definitions, such as laboratory-based versus diagnostic procedures.
In addition to the OMOP HOI library, UpToDate is another evidence-based physician-authored clinical guide-line repository.56 It provides evidence-based and manually curated clinical guidelines for ADEs. Although it does not directly define the ADE using the EHR data, it certainly can assist in defining ADEs. Furthermore, the Side Effect Resource (SIDER)57 is also a reliable source for ADE
definitions.
Level III evidence refers to terminology and vocabularies based data sources (criterion 4). For example, the medical dictionary for regulatory activities (MedDRA) is a key data-base for ADEs,58and the other database include Common Terminology Criteria for Adverse Events (CTCAE).59 Unlike MedDRA, the CTCAE also contains the severity of ADEs.
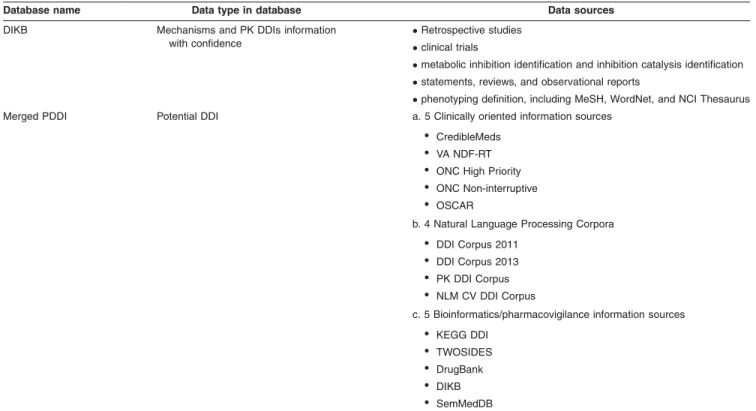
Database integration.On the basis of these drug/DDI/ADE databases, some integrated databases combine them together, and form a complete dataset. The Drug Interac-tion Knowledge Base (DIKB), an evidence-based observed and predicted knowledge base, contains mechanisms and PK DDI information for over 60 psychotropic and HMG-CoA reductase inhibitors.66 A rule-based metabolic DDI predic-tion was conducted with DIKB to determine the most opti-mal set of predictions.67Further, Ayvazet al.68constructed an integrated potential DDI (PDDI) source by combining clinical-oriented information sources, natural language
processing corpora, and bioinformatics/pharmacovigilance information sources by analyzing the overlap between the data sources and mapping drug entity to DrugBank ID. This dataset can benefit NLP corpora and lead to a better syn-thesis of PDDI knowledge. The merged data sources in the integrated database are descripted inTable 3.
From the translational research perspective, there are some limitations in these data sources. First, there are as yet few means to integrate different databases conveniently and economically. In PDDI database, DrugBank ID was used for medication standardization. Additionally, OMOP Common Data Model could be used to standardize the format and content of the observational databases, including medica-tions, ADEs, symptoms, and indications. However, a com-plete solution for data integration is still unavailable. Second, the DDI information in the databases is limited. Particularly, information including the DDI type (e.g., additive/synergic, pharmacokinetic/pharmacodynamic (PK/PD)), mechanism, clinical impact and quantitative description should be included and improved in the future data collection.
KNOWLEDGE DISCOVERY FOR DRUG INTERACTION USING TEXT MINING TECHNOLOGIES
Literature-based knowledge discovery was pioneered by Don R. Swanson in 198669 and had been widespread for decades in the biomedical informatics domain. This tech-nique bridges new relationships between existing knowl-edge by exploring the co-occurrence of words or phrases from different literature articles. Following this lead, many Table 3Summary of integrated database
Database name Data type in database Data sources
DIKB Mechanisms and PK DDIs information
with confidence
Retrospective studies
clinical trials
metabolic inhibition identification and inhibition catalysis identification
statements, reviews, and observational reports
phenotyping definition, including MeSH, WordNet, and NCI Thesaurus
Merged PDDI Potential DDI a. 5 Clinically oriented information sources
• CredibleMeds
• VA NDF-RT
• ONC High Priority
• ONC Non-interruptive
• OSCAR
b. 4 Natural Language Processing Corpora
• DDI Corpus 2011
• DDI Corpus 2013
• PK DDI Corpus
• NLM CV DDI Corpus
c. 5 Bioinformatics/pharmacovigilance information sources
• KEGG DDI
• TWOSIDES
• DrugBank
• DIKB
• SemMedDB
“open discovery” and “close discovery” methods were developed to discover interesting associations among a large set of data items. To distinguish open and close dis-covery, we take the relationship between a disease and treatments as an example, the open method can generate a hypothesis to find the underlying pathological mecha-nisms of a disease. It starts with a disease, discovers the mechanisms of the disease from literatures, and finally finds a drug that may interact with those mechanisms (intermediates). Differently, a close discovery method can verify and elaborate an initial hypothesis. Its searching pro-cess starts simultaneously from a disease and a drug. Their overlapping mechanisms (intermediates) can demon-strate the relationship between a disease and a drug.70 Based on these two concepts, in the last decade, several discovery systems were developed. Srinivasan presented both open and close algorithms to automatically discover a small set of interesting hypotheses from a suitable text col-lection using medical subject heading (MeSH) terms in Medline.71 Hristovski et al.72 combined the outputs of two NLP systems to provide semantic prediction, which demon-strated the improvement for literature-based knowledge dis-covery. Tsuruoka & Tsujii73 developed a search engine for Medline abstracts, called FACTA, which retrieves textual evidence of associations between the query terms and the concepts. Frijters et al.74 developed the CoPub discovery tool to assess the significance of co-occurrence based on the mutual information measure and mine the new relation-ships between biomedical concepts. Finally, Yetisgen-Yildiz & Pratt75proposed an evaluation methodology allowing the comparisons across different systems.
Although there have been many discovery methods devel-oped, most of them often mined co-occurring entities from free-text in documents or data fields. The co-occurrences method has a critical drawback, because not all co-occurring entities possess “meaningful” and “quality” relations. To retrieve explicit facts from documents as efficiently as possi-ble, text mining technologies facilitate quality discovery from biomedical literature, EHR, or social media. Information retrieval (IR) is the quality control process, which enables the identification of relevant documents and provides the quality of data resource for knowledge discovery. For exam-ple, the DDI IR step identifies higher quality DDI articles from PubMed.76 Information extraction (IE) is the task of extracting information from unstructured text. The scope of extractions can be as simple as the predefined entities, such as the names of proteins, genes, as well as drugs, or can be as complicated as the “true” associations between enti-ties, such as drug-gene interactions or DDIs. Instead of co-occurrence-based knowledge, those applications automati-cally scrutinize the phase of generating quality information and potentially empower extracted information into truly novel hypotheses for open discovery or solid validations for close discovery.
In this section, our review will focus on how text mining technologies assist on the drug interaction discovery in three aspects: (1) the manually curated corpus facilitates text anal-ysis by providing syntactic and semantic pharmacological knowledge for retrieving and extracting DDI; (2) the IR and IE technologies help aggregate quality data extensively,
thereby providing the potential to perform hypothesis genera-tions and validagenera-tions; and (3) linking the disjointed sets of facts from documents uncovers hidden links between drugs and generates novel hypotheses.
Drug interaction corpora
Great text mining methods rely on well-developed corpora. Corpora refers to manually annotated golden standard data. In the DDI text mining domain, DDI corpora developed in both DDI extraction challenge tasks in 2011 and 2013,77,78 have guided a great number of supervised DDI text mining methodologies’ development. The annotation strategies in corpus may differ subject to the purpose of text mining tasks. There are three types of annotations in corpus: (1) semantic annotation creates semantic labels for terminolo-gies or relationships79,80; (2) syntactic annotation includes structural makeup, part of speech tagging, and constituent or dependency of parsing trees81; and (3) fragment annota-tion characterizes the properties of scientific text in specific measurements. Different from semantic and syntactic anno-tations, it provides sufficient generality to transcend the sub-ject area. Fragment annotation was first designed to characterize text using five qualitative dimensions: focus, polarity, certainty, evidence, and directionality.82
Although many corpora are available, only a few focus on the topic of DDIs.77–80,83,84The DDI Corpus 2011 and 2013 were built as reference standards for 2011 and 2013 DDI Extraction Challenges, respectively.77–79 These two
in vitro DDI studies (n5210). A hierarchical three-level annotation schema was proposed to annotate key terms, drug interaction sentences, and drug interaction pairs. Except for drug names, this PK corpus was different from the other corpus, including enzyme, drug dosage, and PK parameters with their values and units, mechanisms, and action terms reflecting interactions are annotated. With regard to the relationship, DDIs were not only annotated based on their narrative descriptions, but also were judged using their quantitative and qualitative evidences. The fold change (FC) in PK parameters (e.g., FC>1.5 or FC<0.67 in AUC) or statistical measurement (e.g., P value<0.05) specifies the numeric rule to define DDI quantitatively. The significance statement (e.g., significantly, moderately, or probably) specifies the language expression pattern for the DDI relationship qualitatively.
Other than the data recourses from biomedical literature or drug labels, social media, such as blog, forum, or Twitter, provide huge potential in the identification of ADEs and DDIs.85In the past few years, corpora obtained from social
media texts started emerging.86 A corpus of 10,822 tweets by the Gonzalez laboratory was manually annotated for mining Twitter for adverse drug reactions (ADRs).87 The annotation mainly focuses on drug names and ADRs. Dif-ferent from the annotations in biomedical literature or drug labels, this corpus was sought to annotate not only the presence or absence of drug names or ADRs, but also to identify the span of expressions conveying individual ADRs. In addition, another corpus, also created by the Gonzalez laboratory, consists of 267,215 Twitter posts. In this corpus, two sets of language models were created to encapsulate “semantic properties” by presenting word tokens as dense vectors and “n-gram sequences” by capturing sequential patterns.88Moreover, TwiMed is one of the most recent cor-pus, which comprises 1,000 tweets and 1,000 PubMed sentences.86The annotations covered entities (drug, symp-tom, and disease) and their relations (outcome-negative, outcome-positive, and reason-to-use). Similar to fragment annotation, their attributes for entities are further annotated to provide their characteristics (polarity, person, modality, exemplification, duration, severity, status, and sentiment).
In sum, all aforementioned corpora characterize different aspects of DDI studies. DDI corpus focused on the distinc-tion in drug type and DDI effect77,79; PK DDI corpus and
NLM CV DDI Corpus annotated package inserts as the data sources and identified the roles of drugs in DDI rela-tionships83,84; and the PK corpus further differentiated PK
DDI intoin vivoandin vitrostudies, and defines drug inter-actions using experimental evidence.80 The corpora for social media were annotated differently from those in litera-ture. Two corpora, created by the Gonzalez laboratory, were annotated in different scopes.87,88 One focused on entity level and another focused on language models. TwiMed not only annotated with both entity and relation lev-els but also identifed the attributes for entities.86
Information retrieval and extraction for drug interaction and drug-related knowledge
In order to promote DDI text mining, DDI-Extraction chal-lenges organized in 2011 and 2013 aimed for developing the
text mining methodologies of the pharmacological substance recognition and DDI detection.77,78For the named entity rec-ognition (NER) of pharmacological substances, the best results were achieved by WBI_NER. This NER approach is formulated as a sequence labeling task (IOB format). Using domain-independent features from ChemSpot, Jochem, and ChEBI ontology, linear-chain conditional random field model was implemented to predict the sequences of name entities. The second best method (NLM LHC) utilized dictionaries from multiple biomedical resources, such as Drugbank, ATC system, or MeSH headings. In this challenge, most approaches can perform well on the recognition of generic or brand names, but not drug-n category (substances not approved for human use). The great variation and complexity in naming convention lead to the difficulty in name recogni-tion. Another focus in the DDI-Extraction 2011 challenge is to identify true DDIs from all possible DDI pairs from the bio-medical text in Medline abstracts and Drugbank. Among 10 participation computational algorithms, the best performance (F-measure50.657) was achieved by the system (WBI) using an ensemble learning approach. Combined three dif-ferent kernels (all-paths graph, shallow linguistic, and k-band shortest path spectrum kernels) with a case-based reason-ing called MOARA, a majority votreason-ing ensemble of construct-ing machine learnconstruct-ing methods was built for binary prediction. The DDI Extraction 2011 concluded that approaches using kernel-based methods achieved better performances than the feature-based methods. In addition, most systems used primarily syntactic information, but not much semantic infor-mation. Different from the 2011 challenge, DDI Extraction 2013 not only aimed to detect DDI pairs, but also classified them into one of the following four types: advice, effect, mechanism, and interaction statement. In the 2013 chal-lenge, FBK first achieved best performance and yielded an F-score of 0.80 for DDI detection and an F-score of 0.65 for DDI detection and classification. It applied a hybrid kernel-based method and exploited the scope of negations and semantic roles for filtering negative instances. The 2013 challenge concluded that the systems using nonlinear kernel-based methods outperformed linear supporting vector machine systems.
Other than DDI Corpus in previous two challenges, PK corpus80 was also utilized for developing DDI extraction
tools. The extraction tasks were implemented in thein vivo
andin vitroDDI corpus separately using the approach with all paths graph kernel. Interestingly, a huge discrepancy on the performance was found between two sub-corpora in the PK corpus. The reported F-measure ofin vivoDDI corpus, 0.76, is much higher than that ofin vitroDDI corpus (0.52). The authors concluded that DDI representations inin vitro
PK studies were more diverse than those in in vivo PK studies. It usually contains more drugs and PK parameters to describe DDI evidences, and it compares their inhibition/ induction capability in a long sentence. Using the same dataset (PK corpus), Zhang et al.89 presented a graphic
81.94% on thein vivo dataset and from 51.50% to 69.34% on thein vitrodataset, respectively.
Learned from the previous works,80,89 clearly, the
perfor-mance of extracting PK DDI evidences would be varied if their experiment methods were different. For achieving bet-ter performances, it is important for a text mining system to treat DDI evidences differently according to their study types.In vitro studies investigate whether a drug is a sub-strate, inhibitor, or inducer of metabolizing enzymes or transporters; in vivo PK studies investigate the kinetics of drug metabolism involved in absorption, distribution, metab-olism, and excretion process, and clinical studies investi-gate the clinical effects (i.e., efficacy or side effects of DDIs). Recent work by Kolchinsky et al.76 classified the in vitro and in vivo PK DDI evidences. More recently, Wu
et al.90 developed a suite of text mining tools to explore and distinguish three different types of DDI evidences, namely in vitro PK, in vivo PK, and clinical PD. A large-scale mining from 25 million abstracts in PubMed (1975– 2015) was accomplished to retrieve DDI relevant abstracts and identify DDI pairs for each study. The result shows that 986 DDI pairs with all three types of evidences have their clinical usages. The 2,157 DIDs with known clinical PK/PD DDI evidences and 13,012 DDIs with only clinical PD evi-dence have enormous research potentials. This result pointed out knowledge gaps and potentially gives an impe-tus to translational drug interaction research.
Besides data mining using the postmarketing surveillance data or text mining using the scientific literature, social media provide different promising resources for identifying DDIs and ADEs. Social media databases are based on direct experiences from drug users. Thus, they provide up-to-date and timely messages conveying drug-related infor-mation.91Due to the unique issues of social media content, including credibility, uniqueness, frequency, and salience of the data,92 the existing IR and IE techniques for scientific literature may not be effective for social media data. To this end, many works were developed in the past few years. Sarker & Gonzalez93 focused on the classification of
sen-tences to detect ADR mentions utilizing features, including n-gram, Unified Medical Language System semantic types, Synset expansion, etc. By the same authors, the distribu-tion word representadistribu-tions were generated to capture differ-ent types of semantic information and an n-gram sequdiffer-ential language model was used to capture sequential word occurrence probability. Utilizing both information facilitates for the text classification and text normalization for drug-related knowledge.88 Except for the commonly used fea-tures extracted from narratives, sentiment analysis feafea-tures is valuable for improving the performance of detection. For information extraction, Carbonell et al.94 analyzed the
fea-tures using time series analysis, co-evaluated the mentions of drugs in Twitter within intervals of 30 minutes, and explored the potential drug effects and drug interactions. Another tool called ADRMine utilized a variety of features, including a new feature for modeling words’ semantic simi-larities.95Using conditional random fields classifier, the sim-ilarities are modeled by clustering words based on word representation vectors (embeddings) generated from unla-beled user posts in social media. This work proved that
word cluster features can significantly improve extraction performance for mining ADR mentions.
Information discovery for novel drug interactions and ADEs
Information retrieval and extraction for drug interaction evi-dence from biomedical literature lend an impetus to the generation of “meaningful” and “quality” evidences, which helps on aggregating DDIs and improving the coverage of DDI databases. However, an overlapping analysis between the Drugbank and Micromedex showed that there are around 25% of disagreements.96 The lack of scientific
evi-dences complicates the process of verifying the discrepan-cies. Therefore, to explore the mechanism behind drug interaction, it is crucial to supply the necessary scientific evidence to validate DDIs.
To discover novel drug interactions and explore their mechanisms, knowledge discovery strategy had been widely used. Both Tari et al.97 and Percha et al.98 are two typical examples of the close discovery method. Tariet al.97
devel-oped a method combining text mining and automated rea-soning to infer DDIs with the support of enzyme and biological domain knowledge. By representing the general knowledge related to the metabolism (drug-gene) and biolog-ical interaction (protein-protein) with the logic rules, DDIs were predicted in the reasoning phase. In a different paper, Percha et al.98 proposed a novel approach to predict novel DDIs by aggregating gene-drug interactions, which are extracted via the rule-based method. Using the established DDIs as the training set, a supervised classifier was trained to score potential DDIs based on the normalized drug-gene assertions extracted from the literature that relate two drugs to a gene product. More significantly, a semantic network built based on the extracted drug-gene assertions were implemented to explain the pharmacological mechanisms for newly predicted DDIs. Different from the Tari et al.97 and Percha et al.98methods, Duke et al.10 proposed a literature
discovery approach combined with analysis of EMRs and predicted 13,197 CYP-related DDIs. Based on literature data onin vitrodrug metabolism and inhibitory potency, this trans-lational approach finally identified five novel drug interactions that synergistically increased the risk of myopathy.
Other than DDI prediction, identifying ADEs caused by DDIs using text mining approaches draws more and more attention. Recent approaches utilized the features that drug interaction with the same gene targets may lead to ADEs and drugs with similar structures for ADE predictions. In this fashion, Raja et al.99 proposed a literature-mining framework to enhance the prediction of DDIs and ADE types through integrating drug-gene interactions. Using the DDI features from DDI corpus, a supervised learning cate-gorized ADEs into four types: adverse effect, effect at molecular level, effect related to PKs, and DDI without known ADEs. This tool was applied to predict DDIs and ADE types related to cutaneous diseases and successfully identify promising new ADEs.
Interestingly, an example of Twitter applicability in knowl-edge discovery for drug interactions is proposed by Hamed
pairs. Based on the computation of associations for co-occurred keywords in the same tweets and associations between keywords and hashtags that also appeared in the same tweet, a new network mining algorithm was created to detect connections between pairs of drugs. This work demonstrated how hashtags can connect information and synthesize new knowledge.
CONCLUSION
In this article, we review three essential computation and informatics approaches for the translational drug interaction research. First, we provide an overview for computational models for mining drug interaction signals from postmarket-ing surveillance databases. Second, we present PK models for IVIVE in DDI prediction. We particularly emphasize the value of fm in the DDI prediction. We also review and sum-marize available DDI related databases, ADE-phenotyping sources, and integrated DDI databases. Third, we show diverse text mining techniques to discover ADEs and drug interactions from literatures and social media. Signals identi-fied by each approach can serve as potential drug interaction hypotheses. Although significant progresses and achieve-ments have been made for each of these approaches sepa-rately, researchers rarely utilize them jointly for drug interaction hypothesis generation and knowledge discovery. In the real world, these three approaches are naturally com-plementary to each other. On one hand, drug interactions shall or may initially manifest in clinical practices and reported to the clinical databases, and consequently can be detected by the postmarketing surveillance data mining. On the other hand, in vitroexperiments together with in vitro in vivomodels are well established to evaluate drug interaction PK evidence and validate their mechanisms. Nevertheless, findings of clinical drug interaction signals andin vitro drug interaction mechanisms are published in the research com-munity. Effective literature-based knowledge discovery approaches will enhance drug interaction research by provid-ing both clinical and in vitro drug interaction knowledge, or identify DDI knowledge gaps. This review shall help scien-tists to integrate all these translational biomedical informatics analyses for an improved translational drug interaction research. Most importantly, we hope this review will be used to stimulate novel and creative translational biomedical infor-matics methods for the drug interaction research.
Conflict of Interest. As an Associate Editor forCPT:
Pharmaco-metrics & Systems Pharmacology, Lang Li was not involved in the review or decision process for this article. The authors declared no conflict of interest.
Source of Funding.No funding was received for this work.
1. US Food and Drug Administration (FDA). <https://www.fda.gov/Drugs/GuidanceCom-plianceRegulatoryInformation/Surveillance/AdverseDrugEffects/ucm070434.htm> (2015). Accessed 12 August 2017.
2. Lazarou, J., Pomeranz, B.H. & Corey, P.N. Incidence of adverse drug reactions in hospitalized patients: a meta-analysis of prospective studies.JAMA279, 1200–1205 (1998).
3. Prybys, K.M., Melville, K.A. & Hanna, J.R. Polypharmacy in the elderly: clinical chal-lenges in emergency practice. Part 1: overview, etiology, and drug interactions.Emerg Med Rep.23, 145–151 (2002).
4. Stearns, V.et al. Active tamoxifen metabolite plasma concentrations after coadminis-tration of tamoxifen and the selective serotonin reuptake inhibitor paroxetine.J. Natl. Cancer Inst.95, 1758–1764 (2003).
5. Desta, Z., Ward, B.A., Soukhova, N.V. & Flockhart, D.A. Comprehensive evaluation of tamoxifen sequential biotransformation by the human cytochrome P450 system in vitro: prominent roles for CYP3A and CYP2D6.J. Pharmacol. Exp. Ther.310, 1062–1075 (2004).
6. Goetz, M.P.et al. Pharmacogenetics of tamoxifen biotransformation is associated with clinical outcomes of efficacy and hot flashes.J. Clin. Oncol.23, 9312–9318 (2005). 7. Henry, N.L., Stearns, V., Flockhart, D.A., Hayes, D.F. & Riba, M. Drug interactions
and pharmacogenomics in the treatment of breast cancer and depression.Am. J. Psy-chiatry165, 1251–1255 (2008).
8. Hennessy, S. & Flockhart, D.A. The need for translational research on drug-drug inter-actions.Clin. Pharmacol. Ther.91, 771–773 (2012).
9. Tatonetti, N.P., Ye, P.P., Daneshjou, R. & Altman, R.B. Data-driven prediction of drug effects and interactions.Sci. Transl. Med.4, 125ra31 (2012).
10. Duke, J.D.et al. Literature based drug interaction prediction with clinical assessment using electronic medical records: novel myopathy associated drug interactions.PLoS Comput. Biol.8, e1002614 (2012).
11. Han, X.et al. Identification and mechanistic investigation of drug-drug interactions associated with myopathy: a translational approach. Clin. Pharmacol. Ther. 98, 321–327 (2015).
12. Harpaz, R., DuMouchel, W., Shah, N.H., Madigan, D., Ryan, P. & Friedman, C. Novel data-mining methodologies for adverse drug event discovery and analysis.Clin. Pharmacol. Ther.91, 1010–1021 (2012).
13. Koutkias, V.G. & Jaulent, M.C. Computational approaches for pharmacovigilance sig-nal detection: toward integrated and semantically-enriched frameworks.Drug Saf.38, 219–232 (2015).
14. Karimi, S., Wang, C., Metke-Jimenez, A., Gaire, R. & Paris, C. Text and data mining techniques in adverse drug reaction detection.ACM Comput. Surv.47, article 56 (2015).
15. Jensen, P.B., Jensen, L.J. & Brunak, S. Mining electronic health records: towards better research applications and clinical care.Nat. Rev. Genet.13, 395–405 (2012). 16. Evans, S.J., Waller, P.C. & Davis, S. Use of proportional reporting ratios (PRRs) for
signal generation from spontaneous adverse drug reaction reports. Pharmacoepide-miol. Drug Saf.10, 483–486 (2001).
17. van Puijenbroek, E.P., Bate, A., Leufkens, H.G., Lindquist, M., Orre, R. & Egberts, A.C. A comparison of measures of disproportionality for signal detection in spontane-ous reporting systems for adverse drug reactions.Pharmacoepidemiol. Drug Saf.11, 3–10 (2002).
18. Huang, L., Zalkikar, J. & Tiwari, R.C. A likelihood ratio test based method for signal detection with application to FDA’s drug safety data. J. Am. Stat. Assoc. 106, 1230–1241 (2011).
19. Bate, A.et al. A Bayesian neural network method for adverse drug reaction signal generation.Eur. J. Clin. Pharmacol.54, 315–321 (1998).
20. Noren, G.N., Bate, A., Orre, R. & Edwards, I.R. Extending the methods used to screen the WHO drug safety database towards analysis of complex associations and improved accuracy for rare events.Stat. Med.25, 3740–3757 (2006).
21. DuMouchel, W. Bayesian data mining in large frequency tables, with an application to the FDA spontaneous reporting system.Am. Stat.53, 177–190 (1999). 22. Ahmed, I.et al. Bayesian pharmacovigilance signal detection methods revisited in a
multiple comparison setting.Stat. Med.28, 1774–1792 (2009).
23. Ahmed, I., Dalmasso, C., Haramburu, F., Thiessard, F., Bro€et, P. & Tubert-Bitter, P. False discovery rate estimation for frequentist pharmacovigilance signal detection methods.Biometrics66, 301–309 (2010).
24. Zhang, P.Study Designs and Statistical Methods for Pharmacogenomics and Drug Interaction Studies. Indiana University. <https://scholarworks.iupui.edu/handle/1805/ 11300>(2016).
25. Harpaz, R., Haerian, K., Chase, H.S. & Friedman, C. Mining electronic health records for adverse drug effects using regression based methods. 100–107. IHI ’10 Proceed-ings of the 1st ACM International Health Informatics Symposium, Arlington, Virginia, 11–12 November 2010.
26. Ola Caster, G., Noren, G.N., Madigan, D. & Bate, A. Large-scale regression-based pattern discovery: the example of screening the WHO global drug safety database. Stat. Anal. Data Min.3, 197–208 (2010).
27. Harpaz, R., DuMouchel, W., LePendu, P., Bauer-Mehren, A., Ryan, P. & Shah, N.H. Performance of pharmacovigilance signal-detection algorithms for the FDA adverse event reporting system.Clin. Pharmacol. Ther.93, 539–546 (2013).
28. Huang, L., Zalkikar, J. & Tiwari, R.C. Likelihood ratio test-based method for signal detection in drug classes using FDA’s AERS database. J. Biopharm. Stat.23, 178–200 (2013).
interactions in the post-marketing setting.Pharmacoepidemiol. Drug Saf.12, 517–521 (2003).
30. DuMouchel, W. & Pregibon, D. Empirical Bayes screening for multi-item associations. 67–76. KDD ’01 Proceedings of the seventh ACM SIGKDD international conference on knowledge discovery and data mining. San Francisco, California, 26–29 August 2001. 31. Noren, G.N., Sundberg, R., Bate, A. & Edwards, I.R. A statistical methodology for
drug-drug interaction surveillance.Stat. Med.27, 3057–3070 (2008).
32. Van Puijenbroek, E.P., Egberts, A.C., Meyboom, R.H. & Leufkens, H.G. Signalling possible drug-drug interactions in a spontaneous reporting system: delay of with-drawal bleeding during concomitant use of oral contraceptives and itraconazole.Br. J. Clin. Pharmacol.47, 689–693 (1999).
33. Thakrar, B.T., Grundschober, S.B. & Doessegger, L. Detecting signals of drug-drug interactions in a spontaneous reports database.Br. J. Clin. Pharmacol.64, 489–495 (2007).
34. Zhang, P.et al. A mixture dose-response model for identifying high-dimensional drug interaction effects on myopathy using electronic medical record databases.CPT Phar-macometrics Syst. Pharmacol.4, 474–480 (2015).
35. Xiang, Y.et al. Efficiently mining adverse event reporting system for multiple drug interactions.AMIA Jt. Summits Transl. Sci. Proc.2014, 120–125 (2014).
36. Harpaz, R., Chase, H.S. & Friedman, C. Mining multi-item drug adverse effect associ-ations in spontaneous reporting systems.BMC Bioinformatics11Suppl 9, S7 (2010). 37. Jamei, M., Dickinson, G.L. & Rostami-Hodjegan, A. A framework for assessing
inter-individual variability in pharmacokinetics using virtual human populations and integrat-ing general knowledge of physical chemistry, biology, anatomy, physiology and genet-ics: a tale of ’bottom-up’ vs ’top-down’ recognition of covariates. Drug Metab. Pharmacokinet.24, 53–75 (2009).
38. Yeo, K.R., Jamei, M. & Rostami-Hodjegan, A. Predicting drug-drug interactions: appli-cation of physiologically based pharmacokinetic models under a systems biology approach.Expert Rev. Clin. Pharmacol.6, 143–157 (2013).
39. Ito, K., Hallifax, D., Obach, R.S. & Houston, J.B. Impact of parallel pathways of drug elimination and multiple cytochrome P450 involvement on drug-drug interactions: CYP2D6 paradigm.Drug Metab. Dispos.33, 837–844 (2005).
40. Lu, C., Miwa, G.T., Prakash, S.R., Gan, L.S. & Balani, S.K. A novel model for the prediction of drug-drug interactions in humans based on in vitro cytochrome p450 phenotypic data.Drug Metab. Dispos.35, 79–85 (2007).
41. Brunton, L.L., Lazo, J.S. & Parker, K.L.Goodman & Gilman’s the Pharmacological Basis of Therapeutics, 11th Edition(McGraw-Hill, New York, NY, 2006).
42. Yeung, C.K.et al. Organ impairment-drug-drug interaction database: a tool for evaluat-ing the impact of renal or hepatic impairment and pharmacologic inhibition on the sys-temic exposure of drugs.CPT Pharmacometrics Syst. Pharmacol.4, 489–494 (2015). 43. McGourty, J.C., Silas, J.H., Lennard, M.S., Tucker, G.T. & Woods, H.F. Metoprolol
metabolism and debrisoquine oxidation polymorphism–population and family studies. Br. J. Clin. Pharmacol.20, 555–566 (1985).
44. Li, Z.M., Guo, L.H. & Ren, X.M. Biotransformation of 8:2 fluorotelomer alcohol by recombinant human cytochrome P450s, human liver microsomes and human liver cytosol.Environ. Sci. Process. Impacts18, 538–546 (2016).
45. Bohnert, T.et al. Evaluation of a new molecular entity as a victim of metabolic drug-drug interactions-an industry perspective.Drug Metab. Dispos.44, 1399–1423 (2016). 46. Stephenne, X., Najimi, M. & Sokal, E.M. Hepatocyte cryopreservation: is it time to
change the strategy?World J. Gastroenterol.16, 1–14 (2010).
47. Mao, J., Mohutsky, M.A., Harrelson, J.P., Wrighton, S.A. & Hall, S.D. Prediction of CYP3A-mediated drug-drug interactions using human hepatocytes suspended in human plasma.Drug Metab. Dispos.39, 591–602 (2011).
48. Desbans, C.et al. Prediction of fraction metabolized via CYP3A in humans utilizing cryopreserved human hepatocytes from a set of 12 single donors.Xenobiotica44, 17–27 (2014).
49. Law, V.et al. DrugBank 4.0: shedding new light on drug metabolism.Nucleic Acids Res.42, D1091–D1097 (2014).
50. Drugs.com.<www.drugs.com>(2000). Accessed 12 August 2017.
51. Kyoto Encyclopedia of Genes and Genomes (KEGG).<http://www.genome.jp/kegg/> (1995). Accessed 12 August 2017.
52. Whirl-Carrillo, M.et al. Pharmacogenomics knowledge for personalized medicine. Clin. Pharmacol. Ther.92, 414–417 (2012).
53. Li, Q. et al. Phenotyping for patient safety: algorithm development for electronic health record based automated adverse event and medical error detection in neonatal intensive care.J. Am. Med. Inform. Assoc.21, 776–784 (2014).
54. Kirby, J.C. et al. PheKB: a catalog and workflow for creating electronic
phenotype algorithms for transportability.J. Am. Med. Inform. Assoc.23, 1046–1052 (2016).
55. Fox, B.I., Hollingsworth, J.C., Gray, M.D., Hollingsworth, M.L., Gao, J. & Hansen, R.A. Developing an expert panel process to refine health outcome definitions in observational data.J. Biomed. Inform.46, 795–804 (2013).
56. UpToDate.<http://www.uptodate.com/contents/search>(2017). Accessed 12 August 2017.
57. Kuhn, M., Letunic, I., Jensen, L.J. & Bork, P. The SIDER database of drugs and side effects.Nucleic Acids Res.44, D1075–D1079 (2016).
58. Brown, E.G., Wood, L. & Wood, S. The medical dictionary for regulatory activities (MedDRA).Drug Saf.20, 109–117 (1999).
59. Chen, A.P.et al. Grading dermatologic adverse events of cancer treatments: the Common Terminology Criteria for Adverse Events version 4.0.J. Am. Acad. Derma-tol.67, 1025–1039 (2012).
60. CPT - Current Procedural Terminology. <https://www.ama-assn.org/practice-manage-ment/cpt-current-procedural-terminology>(1995). Accessed 12 August 2017. 61. International Classification of Diseases (ICD) <http://www.who.int/classifications/icd/
en/>(2017). Accessed 12 August 2017.
62. Wilson, P.S. & Scichilone, R.A. LOINC as a data standard: how LOINC can be used in electronic environments.J. AHIMA82, 44–47 (2011).
63. Systematized Nomenclature of Medicine-Clinical Terms (SNOMED CT).<http://www. ihtsdo.org/snomed-ct/>(2011). Accessed 12 August 2017.
64. RxNorm. <https://www.nlm.nih.gov/research/umls/rxnorm/> (2004). Accessed 12 August 2017.
65. Hansen, R.A., Gray, M.D., Fox, B.I., Hollingsworth, J.C., Gao, J. & Zeng, P. How well do various health outcome definitions identify appropriate cases in observational studies?Drug Saf.36Suppl 1, S27–S32 (2013).
66. Boyce, R., Collins, C., Horn, J. & Kalet, I. Computing with evidence part I: a drug-mechanism evidence taxonomy oriented toward confidence assignment.J. Biomed. Inform.42, 979–989 (2009).
67. Boyce, R., Collins, C., Horn, J. & Kalet, I. Computing with evidence: part II: an evi-dential approach to predicting metabolic drug–drug interactions.J. Biomed. Inform.
42, 990–1003 (2009).
68. Ayvaz, S.et al. Toward a complete dataset of drug-drug interaction information from publicly available sources.J. Biomed. Inform.55, 206–217 (2015).
69. Bekhuis, T. Conceptual biology, hypothesis discovery, and text mining: Swanson’s legacy.Biomed. Digit. Libr.3, 2 (2006).
70. Weeber, M., Kors, J.A. & Mons, B. Online tools to support literature-based discovery in the life sciences.Brief. Bioinform.6, 277–286 (2005).
71. Srinivasan, P. Text mining: generating hypotheses from MEDLINE.J. Assoc. Inf. Sci. Technol.55, 396–413 (2004).
72. Hristovski, D., Friedman, C., Rindflesch, T.C. & Peterlin, B. Exploiting semantic rela-tions for literature-based discovery. AMIA Annual Symposium proceedings AMIA Symposium. 349–353 (2006).
73. Tsuruoka, Y. & Tsujii, J. Improving the performance of dictionary-based approaches in protein name recognition.J. Biomed. Inform.37, 461–470 (2004).
74. Frijters, R., van Vugt, M., Smeets, R., van Schaik, R., de Vlieg, J. & Alkema, W. Lit-erature mining for the discovery of hidden connections between drugs, genes and diseases.PLoS Comput. Biol.6, 9 (2010).
75. Yetisgen-Yildiz, M. & Pratt, W. A new evaluation methodology for literature-based dis-covery systems.J. Biomed. Inform.42, 633–643 (2009).
76. Kolchinsky, A., Lourenc?o, A., Wu, H.Y., Li, L. & Rocha, L.M. Extraction of pharmaco-kinetic evidence of drug-drug interactions from the literature. PLoS One 10, e0122199 (2014).
77. Segura-Bedmar, I., Martınez, P. & Sanchez-Cisneros, D.The 1st DDIExtraction-2011 Challenge Task: Extraction of Drug-Drug Interactions from Biomedical Texts.<http:// ceur-ws.org/Vol-761/paper0.pdf>(2011).
78. Segura-Bedmar, I., Martinez, P. & Herrero-Zazo, M. Lessons learnt from the DDIExtraction-2013 shared task.J. Biomed. Inform.51, 152–164 (2014).
79. Herrero-Zazo, M., Segura-Bedmar, I., Martınez, P. & Declerck, T. The DDI corpus: an annotated corpus with pharmacological substances and drug-drug interactions.J. Biomed. Inform.46, 914–920 (2013).
80. Wu, H.Y.et al. An integrated pharmacokinetics ontology and corpus for text mining. BMC Bioinformatics14, 35 (2013).
81. Tateisi, Y., Yakushiji, A., Ohta, T., Tsujii, J.I., eds.Syntax Annotation for the GENIA Corpus. Proceedings of the 2nd International Joint Conference on Natural Language Processing (IJCNLP-2005), Jeju Island, Korea, October 2005.
82. Wilbur, W.J., Rzhetsky, A. & Shatkay, H. New directions in biomedical text annota-tion: definitions, guidelines and corpus construction. BMC Bioinformatics 7, 356 (2006).
83. Boyce, R., Gardner, G. & Harkema, H., eds.Using natural language processing to extract drug-drug interaction information from package inserts. BioNLP: Proceedings of the 2012 Workshop on Biomedical Natural Language Processing.
84. Stan, J.A machine-learning approach for drug-drug interaction extraction from FDA structured product labels. National Library of Medicine Training Conference, Pitts-burgh, Pennsylvania.
85. Vilar, S., Friedman, C. & Hripcsak, G. Detection of drug-drug interactions through data mining studies using clinical sources, scientific literature and social media.Brief. Bioinform.(2017).
86. Alvaro, N., Miyao, Y. & Collier, N. TwiMed: Twitter and PubMed comparable corpus of drugs, diseases, symptoms, and their relations.JMIR Public Health Surveill.3, e24 (2017).
88. Sarker, A. & Gonzalez, G. A corpus for mining drug-related knowledge from Twitter chatter: language models and their utilities.Data Brief10, 122–131 (2017). 89. Zhang, Y.et al. Leveraging syntactic and semantic graph kernels to extract
pharma-cokinetic drug drug interactions from biomedical literature.BMC Syst. Biol.10(suppl. 3), 67 (2016).
90. Wu, H.Y.et al.Translational drug interaction evidence gap discovery using text min-ing. 2017 Joint Summits, San Francisco, California, 27–30, March 2017.
91. Harpaz, R.et al. Text mining for adverse drug events: the promise, challenges, and state of the art.Drug Saf.37, 777–790 (2014).
92. Abbasi, A.et al. Social media analytics for smart health.IEEE Intell. Syst.29, 60–80 (2014).
93. Sarker, A. & Gonzalez, G. Portable automatic text classification for adverse drug reaction detection via multi-corpus training. J. Biomed. Inform. 53, 196–207 (2015).
94. Carbonell, P., Mayer, M.A. & Bravo, A. Exploring brand-name drug mentions on Twit-ter for pharmacovigilance.Stud. Health Technol. Inform.210, 55–59 (2015). 95. Nikfarjam, A., Sarker, A., O’Connor, K., Ginn, R. & Gonzalez, G. Pharmacovigilance
from social media: mining adverse drug reaction mentions using sequence labeling with word embedding cluster features.J. Am. Med. Inform. Assoc. 22, 671–681 (2015).
96. Wong, C.M., Ko, Y. & Chan, A. Clinically significant drug-drug interactions between oral anticancer agents and nonanticancer agents: profiling and comparison of two drug compendia.Ann. Pharmacother.42, 1737–1748 (2008).
97. Tari, L., Anwar, S., Liang, S., Cai, J. & Baral, C. Discovering drug-drug interactions: a text-mining and reasoning approach based on properties of drug metabolism. Bioin-formatics (Oxford, England).26, i547–i553 (2010).
98. Percha, B., Garten, Y. & Altman, R.B. Discovery and explanation of drug-drug inter-actions via text mining.Pac. Symp. Biocomput.410–421 (2012).
99. Raja, K., Patrick, M., Elder, J.T. & Tsoi, L.C. Machine learning workflow to enhance predictions of adverse drug reactions (ADRs) through drug-gene interactions: applica-tion to drugs for cutaneous diseases.Sci. Rep.7, 3690 (2017).
100. Hamed, A.A., Wu, X., Erickson, R. & Fandy, T. Twitter K-H networks in action: advanc-ing biomedical literature for drug search.J. Biomed. Inform.56, 157–168 (2015).
VC 2018 The Authors CPT: Pharmacometrics & Systems
Pharmacology published by Wiley Periodicals, Inc. on behalf of American Society for Clinical Pharmacology and Therapeutics. This is an open access article under the
terms of the Creative Commons