1
Long-term exposure to elevated pCO
2more than warming modifies
early-1life shell growth in a temperate gastropod
23
List of Authors: Saskia Rühl1,2*, Piero Calosi2,3, Sarah Faulwetter4, Kleoniki Keklikoglou4, Stephen 4
Widdicombe1, Ana M Queirós1* 5
6 12
Plymouth Marine Laboratory, Prospect Place, West Hoe, Plymouth, PL1 3DH, UK. 7
2
Marine Biology and Ecology Research Centre, School of Marine Science and Engineering, Davy 8
Building, Plymouth University, Drake Circus, Plymouth, Devon, PL4 8AA, UK 9
3
Département de Biologie, Chimie et Géographie, Université du Québec à Rimouski, 300 Allée des 10
Ursulines, Rimouski, QC G5L 3A1, Canada 11
4
Institute of Marine Biology, Biotechnology and Aquaculture, Hellenic Centre for Marine Resarch, 12
Thalassocosmos, 71500 Heraklion, Crete, Greece4) 13
14
*Corresponding Authors: Saskia Rühl: [email protected], 07932529890 15
Ana Queirós: [email protected], 01752 633100 16
17
2
Abstract
19
Co-occurring global change drivers, such as ocean warming and acidification, can have large 20
impacts on the behaviour, physiology and health of marine organisms. However, whilst early-life 21
stages are thought to be most sensitive to these impacts, little is known about the individual level 22
processes by which such impacts take place. Here, using mesocosm experiments simulating ocean 23
warming (OW) and ocean acidification (OA) conditions expected for the NE Atlantic region by 24
2100 using a variety of treatments of elevated pCO2 and temperature. We investigated their 25
impacts on bio-mineralisation, microstructure and ontogeny of Nucella lapillus (L.) juveniles, a 26
common gastropod predator that exerts important top-down controls on biodiversity patterns in 27
temperate rocky shores. The shell of juveniles hatched in mesocosms during a 14 month long 28
experiment were analysed using micro-CT scanning, 3D geometric morphometrics and scanning-29
electron microscopy. Elevated temperature and age determined shell density, length, width, 30
thickness, elemental chemistry, shape and shell surface damages. However, co-occurring elevated 31
pCO2 modified the impacts of elevated temperature, in line with expected changes in carbonate 32
chemistry driven by temperature. Young N. lapillus from acidified treatments had weaker shells 33
and were therefore expected to be more vulnerable to predation and environmental pressures 34
such as wave action. However, in some instances, the effects of both higher CO2 content and 35
elevated temperature appeared to have reversed as the individuals aged. This study suggests that 36
compensatory development may therefore occur, and that expected increases in juvenile 37
mortality under OA and OW may be counteracted, to some degree, by high plasticity in shell 38
formation in this species. This feature may prove advantageous for N. lapillus community 39
dynamics in near-future conditions. 40
41
Keywords: Climate change; CT scanning; Early-life stage; Electron microscopy; Juvenile; Mollusc; 42
Ocean acidification; Ocean warming 43
3 44
4
Introduction
45
Many marine organisms have evolved external shells that provide protection against predation, 46
desiccation and other inhospitable abiotic factors, and prevent parasitism (Brusca & Brusca 2003). 47
A damage or loss of shell-mass therefore diminishes the organism’s likelihood of survival (Parker 48
et al. 2013). Marine external shells are most frequently composed of a number of carbonated 49
forms including minerals such as calcium and magnesium, as well as organic coatings (Vermeij 50
1995). 51
Calcium carbonate (CaCO3) is the most common material in marine shells and can occur in several 52
forms with different chemical and mechanical properties (Weiss et al. 2002). Shell CaCO3 53
composites are arranged in layers of varying complexity, each consisting of a different form of 54
CaCO3 (Falini et al. 1996). Aragonite and calcite are the two most common CaCO3 forms (Suzuki & 55
Nagasawa 2013). Calcite is more structurally diverse and more stable but requires comparatively 56
more time and energy to be produced than aragonite (Weiss et al. 2002). Calcite is also 57
mechanically weaker, and more resistant to corrosive effects of low pH environments than 58
aragonite, typically forming trigonal-rhombohedrally shaped crystals, (Weiss et al. 2002). 59
Conversely, aragonite occurs in orthorhombic acicular crystals, often appearing in parallel layers. 60
Both materials vary in seawater solubility according to variations in ocean carbonate chemistry 61
and temperature (Plummer & Busenberg 1982,). For instance, CO2 driven acidification can cause 62
reductions in CaCO3 saturation, making calcification more energetically costly for individuals 63
relying on aragonite and calcite (Feely et al. 2004). Under-saturation of CaCO3 therefore increases 64
the risk of fast rates of shell dissolution, at which recovery may not take place (Nienhuis et al.
65
2010). In addition, seawater magnesium carbonate (MgCO3) may also become under-saturated 66
because of carbonate chemistry changes in seawater. The magnesium: calcium (Mg2+:Ca2+) ratio in 67
seawater influences organic calcification processes on a microscopic level, so acidification can tip 68
calcification towards the deposition of specific forms (Ries 2010). Low levels of Mg2+ favour the 69
formation of calcite, and high levels favour the deposition of aragonite (Ries 2010). Juvenile 70
5
molluscs preferentially deposit aragonite, possibly due to weaker controls over the early bio-71
mineralisation processes (Weiss 2002), and on approaching maturity, calcite deposition increases. 72
Differences in mineralisation over the individual life cycle can therefore lead to higher mortality in 73
juveniles due to predation or parasitism, because shells are not yet as stable nor as thick as in 74
adults. These shells are also thought to dissolve more easily in conditions of lowered pH, 75
especially in or just after the settling process (Green et al. 2004). Such conditions have been found 76
increasingly often in marine environments around the world as a consequence of global climate 77
change. 78
Changes in seawater temperature (i.e. ocean warming, “OW”) and in carbonate chemistry and pH 79
driven by increasing CO2 emissions (i.e. ocean acidification, “OA”) (IPCC 2014) are known to 80
impact the integrity and morphology of the shell of adult marine organisms (Nienhuis et al. 2010, 81
Thompsen et al. 2010, Melatunan et al. 2013). Some defence mechanisms such as decreased shell 82
growth rates to preserve energy (Findlay et al. 2010) and increased calcification in a range of 83
calcifying species across taxa have been observed in acidified conditions (Ries et al. 2009). 84
However, whilst we have a good understanding of OW and OA impacts on adult shell bearing 85
organisms, our current understanding of how the same stressors and their interactions may 86
impact embryos and juveniles is still limited (Byrne and Przelawsky 2013, Kurihara 2008, 87
Melatunan et al. 2013, Sanford et al. 2014). The energetic implications of dealing with multiple 88
stressors can cause a reduction and/or reallocation of an organism’s energy budget (Melzner et
89
al. 2013) such that trade-offs among different homeostatic processes caused by a given stressor 90
can reduce the individual’s ability to cope with another stressor (e.g. Calosi et al. 2013). These 91
interactions can lead to complex changes at the individual-level and in species interactions, 92
affecting the natural structuring of biological communities (Queirós et al. 2015). As the survival of 93
populations depends on the survival of their offspring (Widdicombe & Spicer 2008), early-life 94
stages (e.g. Dupont & Thorndyke 2009), on transgenerational responses (e.g. Sunday et al. 2014) 95
6
and species interactions are therefore needed to scale up population and community level 96
responses to climate change and OA (Reusch 2014, Sunday et al. 2014). 97
This study aimed to quantify the combined effects of OW and OA as simulated through elevated 98
CO2 content and temperature treatments, on the shell development and growth of the juveniles 99
of the temperate marine gastropod Nucella lapillus (Linnaeus 1758), a predator that exerts 100
important top-down controls on the biodiversity of North Atlantic temperate rocky shores 101
(Trussel et al. 2003). Nucella lapillus (hereafter “N. lapillus”) is an abundant species in temperate 102
shores of the North Atlantic that exhibits a certain phenotypic plasticity in shell morphology and 103
colour depending on latitude, microhabitat, physiological stress, and mechanical stresses such as 104
those caused by wave actions and predation. N. lapillus is a direct developer that predates on 105
habitat forming species such as barnacles and mussels, and has a great influence on benthic 106
community structure and dynamics, habitat complexity and diversity (Trussel et al. 2003, Sanford 107
et al. 2014). In this study, shell length, width, thickness, density, crystallisation, chemical make-up 108
and overall shapes of juveniles from different treatment combinations, at three and nine weeks 109
post hatching, were examined. Animals were collected over a 14 month mesocosm experiment 110
featuring multiple combinations of elevated CO2 content and temperature treatments (simulating 111
various scenarios of OA and OW projected for the end to the 21st century in the region), during 112
which marked effects of both stressors were observed in adult N. lapillus energetics and shell 113
structure (Queirós et al. 2015). Considering that N. lapillus is a direct developer, we expected that 114
if no phenotypic adjustment occurred during embryonic and post-hatching ontogeny, juveniles 115
hatched during the experiment would develop shells with significant changes in growth patterns 116
and chemistry, reflecting impacts observed in the parental lineage. However, if developmental 117
acclimatisation was to occur, we expect no significant changes to be observed at the levels of 118
shell, as phenotypic buffering could favour the maintenance of this ecologically and 119
physiologically important structure. 120
7
Material and Methods
122
Specimen acquisition
123
Juveniles of N. lapillus were collected during the NERC-DECC UK Ocean Acidification Research 124
Programme’s mesocosm experiments (Queirós et al. 2015), carried out at Plymouth Marine 125
Laboratory’s Intertidal Mesocosm Acidification System (PML-IMAS, Findlay et al. 2013) during 126
2011-2012. Mature individuals from a native population at Mouth Batten, Plymouth (N50° 21’ 127
30.29”, E -4° 7’ 50.07”) were collected and transferred to the PML-IMAS where they were exposed 128
to five different treatments combining various temperature and pCO2 levels for 14 months 129
(Queiros et al. 2015). During the experiment, the offspring hatched from egg capsules laid in the 130
mesocosm were maintained in this system, and analysed in the present study. A detailed 131
description of the set-up, carbonate chemistry parameters and of how the experimental 132
treatments were controlled can be found in Queirós et al. (2015). Briefly, five treatments 133
combining seawater pCO2 (380, 750 and 1000 ppm) at ambient temperature (A) and two pCO2 134
treatments (380 and 750 ppm) at elevated temperature were simulated. These treatments are 135
hereafter referred to as 380A, 750A and 1000A, and 380T and 750T, respectively. Ambient 136
temperature was controlled to follow the seasonal cycle at the population source conditions 137
(typically between 9 and 15 °C) and warming was simulated as a 2 °C offset above that variation 138
(Queirós et al. 2015). Throughout the experiment, egg capsules laid by adults in the treatment 139
tanks were inspected on a weekly basis, and hatched juveniles varying between one and 14 weeks 140
of age were recorded and collected for later analyses. Out of this collection, only those of three 141
and nine weeks of age were examined in the present study. The number of eggs and juveniles 142
produced by the adults varied greatly between treatments, and in the 1000A treatment, only four 143
individuals hatched in 14 months, possibly as the result of metabolic depression observed in adult 144
N. lapillus (Queirós et al. 2015). Due to the low replication level, this treatment group was 145
therefore excluded from the current analysis. Twenty-four individuals from the other four (OA x 146
OW) treatments were collected at random and analysed, three from each age group and 147
8
treatment combination. All specimens were stored dry or in minimal amounts of distilled water at 148
-80 °C before, in between and after analyses, and transported in liquid nitrogen where necessary. 149
150 151
Micro-CT scanning
152
Scanning was carried out at the Hellenic Centre of Marine Research (Crete, Greece). Each 153
individual was inserted into an individual pipette tip which was sealed airtight and positioned 154
upright in the scan chamber of a micro-tomograph (Skyscan 1172, Bruker, Belgium). The scan 155
medium was always air, and no stains were used. Specimens were scanned with a voltage of 59 156
kV and a 167 µA current for the acquisition of morphological and density related data. Density 157
measurement calibration was achieved experimentally and from past measurements of similar 158
materials. The micro-tomograph has a maximum resolution of 4000 x 2672 pixels (~0.8 µm per
159
pixel). A filter with two layers of aluminium foil was used to minimise excess charge. These 160
settings were optimised for the highest resolution (4,000x), an exposure time of 1915 ms and 161
between 0.85 and 1.3 µm zoom, depending on the size of the specimen. Images were collected at 162
full 360° rotation with no random movement, and averaging every two images at every rotation 163
angle. Scanning parameters were recalibrated before each scan to ensure comparability between 164
image sets (i.e. individuals). 165
166
Reconstruction of scanned specimens
167
The micro-CT projections were reconstructed into cross-sectional images of shells using a 168
reconstruction software (NRecon, Skyscan, Bruker, Belgium), which is based on a modified 169
Feldkamp’s back-projection algorithm (Feldkamp et al. 1984). This was accomplished as an 170
automated function of the scanning process using graphics processor unit reconstruction (GPU 171
recon). If specimens had inadvertently moved during image acquisition, the scan was repeated. 172
Reconstructed scans of tilted specimens were straightened to achieve a uniform measure of 173
9
length and width in 3D view (Dataviewer, Skyscan, Bruker, Belgium). Ten cross-sections of each 174
shell (hereafter “slices”) were reconstructed in pre-selected locations across the shell, which were 175
standardised across individuals to optimise comparability between individual results (Fig. 1). 176
177
Scan analysis and data extraction
178
Shell length, width and thickness measurements were acquired using Dataviewer (Bruker 2014). 179
Shell thickness was averaged across the widest part of the shell (WP1) as well as the Mid-lip slice 180
(ML1; Figure 1). A 15 pixel thick band was selected from the edge of the shell and inwards around 181
the outside of each of the ten slices for density measurements, using the software Image J1.45S 182
(National Institutes of Health, USA). This band ensured that the selected area had been in 183
immediate contact with the external conditions and not protected by soft tissue or body fluids. 184
Shell density was measured as the average 2D grey-scale pixel intensity using the whole band. 185
The visual comparison of shell surface damage between individuals was accomplished in a 186
volume rendering software (CTVox, Skyscan, Bruker, Belgium), where a 3D visualisation of the 187
shells as image stacks was produced, manipulating factors such as opacity and lighting (Fig.2). 188
3D Geometric Morphometrics measurements
189
3D geometric morphometric methods were applied to the reconstructed 3D scans (i.e. shell 190
plastic model, see Fig. 2) to investigate potential changes in shell morphology associated with 191
phenotypic plasticity responses. Due to limits on computer memory during processing, scan file 192
size was reduced and, consequently, resolution also reduced by a factor of 16. This was achieved 193
using the Dataviewer resizing option prior to reconstructing triangulated surfaces for each of the 194
specimens using the software Amira (FEI, 2013). Surfaces were reconstructed using the 195
‘SurfaceGen’ option on the resampled dataset and the resulting models were saved in ‘Polygon 196
File Format’ (.ply). Overall, the scans were reduced in size by a factor of ~64, but only a low level 197
of detail was lost post processing. 198
10
Surface models were then uploaded into software designed for the analysis and interpretation of 199
three-dimensional shapes (Landmark editor, Wiley 2007). Here, a series of type 1 and 2 landmarks 200
were introduced in the form of single landmarks and curves (Fig. 2) on the lip, on minimum and 201
maximum points as well as on each end of and along the whorl. 202
By establishing this landmark protocol (Fig. 2) in the first shell and reproducing it in the others 203
through correspondence of each set of landmarks with those of the original specimen, 204
comparable measures of shape could be applied to the distinct features shared by all shells. Data 205
points were exported from Landmark into MorphoJ (Klingenberg 2011) where models were 206
adjusted in a procrustes fit: a forced adjustment of all involved models for the sake of 207
comparability, before generating covariance matrices and conducting procrustes analyses. These 208
measures were taken in order to achieve optimal shape alignment through scaling, rotation and 209
translation of the models. Amira (FEI 2013), the programme used to make the original 3D models, 210
was also used to measure the volume of each of the specimen’s shells. 211
212
Analysis of crystalline properties
213
At Plymouth University (Plymouth, UK), scanned specimens were positioned on the bottom of 214
cylindrical moulds with the youngest shell part facing downwards and fixed in this position on a 215
thin layer of generic superglue. The mould was filled with epoxy resin and left in a vacuum 216
chamber to de-gas, until the shells were enclosed inside and outside by the resin. The encased 217
specimens were left at 30 °C over night to allow the epoxy resin to harden before sanding and 218
polishing the formerly lower surface off to the desired cross-section. 219
Hand polishing was carried out using first abrasive paper (P800 and P2500, FEPA P-grade), then 1 220
µm fine diamond paste on a bench-top sander (Kemet Int. Ltd., UK) with a fabric disc as 221
foundation for the paste. Cross-sections were taken from comparable points in all shells. The 222
surface of each cross-section was further etched with hydrochloric acid for 45 s to improve the 223
exposure of a shell surface for visualisation. Specimens were then carbon coated in a carbon 224
11
sputter-coater (K450X, EmiTech, Quorum Technologies, UK) using carbon rods. Scanning electron 225
microscopic energy dispersive x-ray analysis (JEOL JSM-6610 LV, JEOL, Tokyo, Japan) was used to 226
determine the crystalline structure of each shell, and the relative thickness of homogenous and 227
crossed-lamellar layers were recorded, as possible. Where more than one crystal layer was 228
present, x-ray spectra were selected from each of the cross-sections in the outermost layer of 229
crystals to examine the most exposed regions. Images of each cross-section were taken for 230
further analysis at appropriate magnification to determine crystal polymorph structure (Marxen 231
et al. 2008). The elemental ratio from each x-ray spectrum was recorded (for technique see Reed 232 2005). 233 234 Statistical analysis 235
Shell weight, length, width, thickness, volume and density data sets were analysed separately and 236
differences between treatment and age groups investigated. All data were screened on whether 237
they met the assumptions of a linear model by assessing independence of errors, 238
homoscedasticity and normality of residuals. Where assumptions were met, Analysis of Variance 239
(ANOVA; Fisher 1925) was carried out for each response variable. Else, datasets we analysed using 240
Generalized Least Squares (GLS; Cascetta 1984) modelling, wherein the best fitting and most 241
parsimonious models were selected, based on Akaike’s Information Criterion (AIC; Akaike 1973). 242
The combined effects of temperature, pH and age on the similarity structures of the aggregated 243
datasets (all response variables) were also investigated using crossed Analysis of Similarity 244
(ANOSIM; Clarke 1993) and the software Primer (Clarke & Gorley 2014). This further step was 245
undertaken to investigate whole-individual responses between treatments, allowing for 246
consideration to be given to the potential variability in specific responses of individuals within 247
treatment groups. 248
Additionally, similarity percentage tests (SIMPER; Clarke 1993) were used to determine which 249
variables most explained observed variation in the chemical make-up of the shells (i.e. elemental 250
12
composition) between treatment and age groups. Statistical difference in chemical make-up of 251
shells was tested between individuals as well as treatment- and age groups. Mean weights of each 252
element within individual samples were then compared in Primer and R using crossed ANOSIM 253
tests and GLS modelling. Out of all the elements (and element ratios) recorded in the spectral 254
analysis, a special focus was put on analysing the magnesium:calcium ratios (Mg:Ca) because it is 255
one of the factors determining crystallisation within the shells. Non-metric Multi-Dimensional 256
scaling (nMDS; Kruskal 1964) was estimated based on Euclidean distances to explore overall 257
dissimilarities between age and treatment groups. Unless otherwise specified, all data analyses 258
were carried out in R (R foundation, Vienna). 259
13
Results
261
Shell surface
262
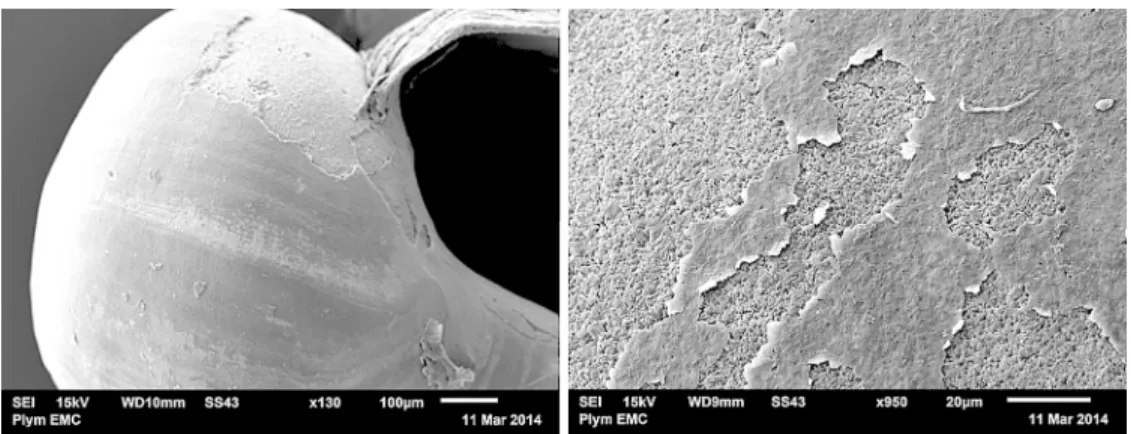
Shells of individuals exposed to elevated pCO2 (i.e. 750 ppm, Fig. 3) exhibited overall a greater 263
proportion of rough textures and indentures on their surface than at ambient pCO2, in both age 264
groups, and this effect that was more pronounced under co-occuring elevated temperature 265
conditions (750T cf. 380A). This can also be seen in the cross-sectional images in figure 1, in which 266
the shell exposed to high temperature and elevated pCO2 (750T, Fig. 1C) showed a distinctly more 267
uneven surface than the control shell (380A, Fig. 1B). 268
Shell micro-structure and chemistry
269
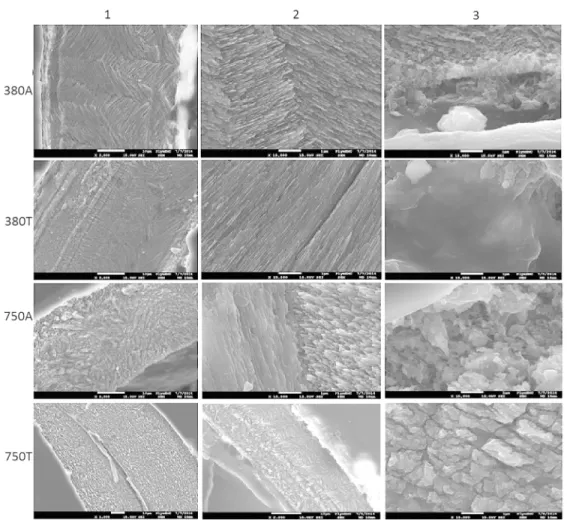
Shells’ microstructures from individuals kept under control conditions (380A) exhibited a structure 270
of separation into a neatly sorted crossed-lamellar (CL) inner layer of thin aragonitic CaCO3 sheets 271
and a thin, grainy homogenous (H) outer layer (Fig. 4, 380A, 1-3). Shells of individuals kept under 272
the elevated temperature condition (380T) exhibited similar structures but the thickness of the 273
layers varied. Crossed-lamellar crystals varied in size and neatness of layering and the H layers 274
were smoother than in the control treatment group (Fig. 4, 380T, 1-3 cf. Fig.4, 380T). Shells kept 275
at ambient temperature and elevated pCO2 had lost the distinct layering and although both CL 276
and H structures were recognisable, the transitional phase contained both (Fig. 4, 750A, 1). The 277
biggest change in shell microstructure however was found in 9 weeks old individuals exposed to 278
high pCO2 at ambient temperature and in shells of all ages where both temperature and pCO2 had 279
been increased. Here, the newest shell parts (closest to the growth edge at the lip) displayed a 280
complete lack of layering with a new crystal structure that resembled neither CL nor H patterns 281
found in other shells (Fig. 4, 750T, 1-3). Although being most easily comparable to homogenous 282
patterns, these new structures had eroded bark-like surfaces and little to no common direction of 283
orientation of the crystals (Fig. 4, 750T, 3). Some of the older parts of shells from elevated 284
temperature and pCO2 conditions displayed an unusually thin CL layer. The CL structures in those 285
14
shells exhibited equally chaotically oriented crystals to what had been observed in 750A shells in 286
both layers, and H structures more closely resembling the bark-like new structure than what had 287
been recorded as H in 380A (Fig. 4, 750T, 1). Crystal degeneration and deformation was stronger 288
in the outermost parts of the shell than those closer to the columella. 289
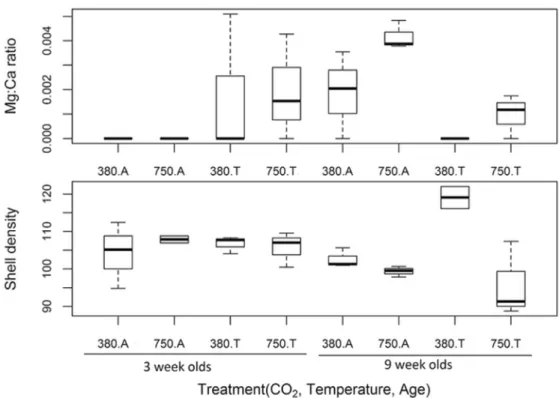
The internal Mg:Ca ratio of the shells varied among individuals of different ages and exposures to 290
different temperatures (p < 0.05, Fig. 5, A). Testing the other elements found within shells with 291
SIMPER analyses confirmed variations in Ca2+ to be the greatest cause of dissimilarity between 292
most sample groups, especially between pCO2 treatments (65.7 %) and age groups (65.1 %). 293
Variations between temperature groups were found to be due in equal parts to variation in 294
oxygen, carbon, calcium and magnesium proportions. The remaining deviations between age and 295
CO2 groups can be explained through variations in oxygen content, though all samples also 296
contained traces of carbon and sodium. 297
Shell density
298
Shell density was found to be significantly lower in all experimental treatments when compared 299
to individuals kept under control conditions. Exceptions to this pattern were 9 weeks old snails 300
maintained at elevated temperature and pCO2 treatment, which had the densest shells (750T). 301
Exposure to elevated pCO2 alone decreased shell density, but only in the 9 week old juveniles. The 302
effects of age and temperature on shell density in isolation were less clear. The best GLS model 303
included as main effects and interactions temperature, age and CO2-content (appendix 1, table 1, 304
p< 0.01, Fig.5, B). 305
Shell growth and shape
306
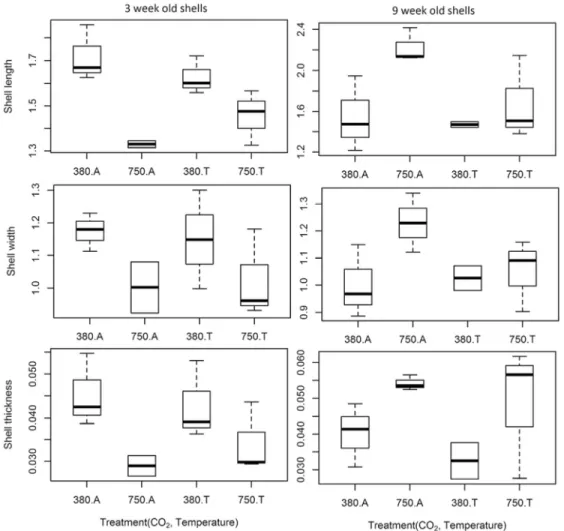
Groups of similar age and pCO2 exhibited more variation shell morphology (i.e. length and shape) 307
at ambient than at warm conditions, suggesting that temperature increased shell variability. The 308
best GLS model for shell length included temperature, pCO2 and age as main effects and 309
15
interaction (p < 0.01, appendix 1, table 2), suggesting that the effects of CO2 and temperature on 310
the shell lengths of N. lapillus differed with age (Fig. 6, A). 311
With regard to shell width, young shells of similar temperature groups treated at elevated pCO2 312
levels (750A and 750T) were narrower than those treated in control pCO2 conditions (380A and 313
380T), yet the opposite was true for old shells, which were wider at higher CO2 (Figure 6, B). 314
Indeed, this effect was clear from the GLS analysis of shell width, for which the best GLS model 315
included age and CO2 as main effects and interaction, but not temperature (p ≤ 0.05, appendix 1, 316
table 3). 317
Shell thickness
318
Similar to the patterns observed in other measurements, shells of young individuals exposed to 319
similar temperature treatments were distinctly thinner when exposed to higher CO2 320
concentrations, while older shells were thicker in high CO2 (Fig. 6, C). The best GLS model included 321
temperature, age and CO2 as main effects and interaction (p < 0.05, appendix 1, table 4). Although 322
temperature appeared to have an effect on shell thickness, this effect was variable across age and 323
CO2, and the effects of CO2 and shell age were greater. 324
325
3D geometric morphometric shape analysis
326
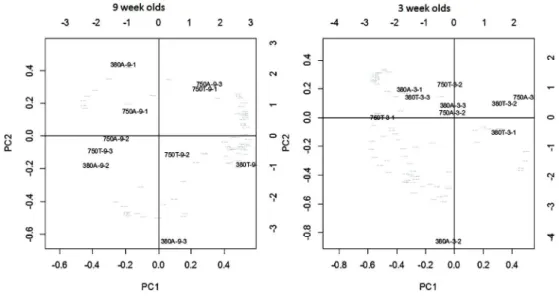
As expected from the previous analyses, individuals variation in shell shape did not appear to be 327
determined by any factor investigated in isolation, but was instead was explained by the 328
combination of factors investigated, as represented by in the principle components (“PC”) biplot 329
(Fig.7). PC1-3 represented the majority of the variance in both the younger (73.17 %, Fig. 7B) and 330
the older shells (77.22 %, Fig. 7A), representing mainly the angle and width of the shell whorl, 331
aperture shape and length and the overall length, together creating the difference between 332
narrower or wider shells. Whilst only a loose separation of the 750T individuals and those in the 333
16
380T treatment was apparent in the younger age group, PC2 (representing the shape of the 334
whorl) clearly separated 750 ppm treatments (750A and 750T, positive PC score) from the 380 335
ppm treatments (380A and 380T, negative PC score) in the older age group. The latter likely 336
reflects higher procrustes distances estimated for older shells, indicating that shell shape (as 337
determined using landmark analysis) varied more in these the older than in the younger age 338
group. 339
These results were confirmed by a two-way crossed ANOSIM analysis of externally measured data 340
sets combined (length, width, density and thickness), which revealed that age (ANOSIM, global R = 341
0.217, p < 0.05) and CO2 content (ANOSIM, global R = 0.208, p < 0.05) were the overall most 342
deciding factors causing dissimilarities in shell variables. Differences in temperature, and the 343
interaction of temperature with other factors however were not. All variables (lengths, width, 344
density and thickness) contributed roughly equal amounts of variation to the dissimilarities 345
between groups (~20% each). Three-week old individuals were more similar to each other in 346
shape (Figure 8), roughly clustering in the middle of the nMDS plot. Nine-week old individuals 347
were distributed more widely around the edges of the plot, exhibiting greater variability in shape 348
and in the relations between the different shape variables, and highlighting the role of treatments 349
on shell development as time passed. The control group (380A) had the least within-group 350
variation when compared with the others, with animals clustering in the centre of the nMDS plot, 351
while the most extreme 750T treatment led to greater dissimilarity in external shell characteristics 352
17
Discussion
354
While the majority of structural shell features in juveniles of the gastropod N. lapillus appear to be 355
influenced significantly by elevated pCO2 and a two degree temperature offset on the 356
temperature seasonal cycle, the impacts of these effects change as juveniles develop. Overall, the 357
effects of CO2 elevation and differences between age groups were evident, while higher 358
temperatures appeared to act as a modifier of juveniles’ responses to pCO2. Differences in 359
response between age groups may reflect how younger individuals are likely less capable to 360
maintain their homeostasis and compensate for the increase in energy expenditure needed to 361
upkeep shell structures. The differences observed between age groups may also likely reflect 362
potential differences in parental investments in reproduction, given that the adults’ metabolism 363
and energy requirements were found to be significantly affected by exposure to both elevated 364
pCO2 and temperature during the 14-month mesocosm experiment (Queirós et al. 2015). N.
365
lapillus typically show a great deal of shell phenotypic plasticity when exposed to OA and OW 366
conditions and our findings are in line with previous work showing shells’ plastic responses to be 367
more marked in individuals exposed to elevated temperature and pCO2 conditions (Lardies et al. 368
2014). This may be a consequence of individuals’ physiological trade-offs (Turner et al. 2015), 369
here specifically between shell formation and repair versus maintaining cellular metabolism and 370
homeostasis. These findings are particularly relevant for N. lapillus ecology, because external 371
shells provide a first barrier against predation, physiological and mechanical stress. Compensatory 372
processes involved in shell deposition in N. lapillus may therefore prove beneficial under near 373
future ocean conditions. 374
A significant reduction of shell growth and thickness after exposure to elevated pCO2 has also 375
been observed in other species (Barros et al. 2013, Sanford et al. 2014) and is thought to be linked 376
to associated alteration of carbonate chemistry and growth inhibition in molluscs. Both of these 377
effects make the organisms more vulnerable to crushing predators, such as crabs (Hughes & Elner 378
1979) and might therefore lead to increased mortality rates in affected populations. It is unclear 379
18
whether N. lapillus growth rates are affected by the higher CO2 content directly, yet this study 380
indicates that shell development was certainly modified. Importantly, and in contrast to previous 381
studies, we found that as N. lapillus grew, older juveniles exhibited potentially compensatory 382
responses. In older juveniles, shells were wider, longer and thicker under elevated pCO2, 383
potentially serving as a better defence. Despite evidence for increased surface damage and 384
dissolution, potentially higher calcification rates may therefore in part have compensated for 385
greater passive dissolution rates. This finding agrees with Melatunan et al. (2013) who, while 386
focusing on adult gastropods, also found advantageous adaptations that allowed shell shape and 387
size changes in molluscs affected by an offset in CO2 content. Whether increased shell size is seen 388
as adaptively advantageous overall is, however, not clear, because larger shells may attract 389
greater risk of crab predation (Cotton et al. 2004). 390
In general, gastropod shells are strengthened gradually through continuous calcification from 391
within, leading to the thickening of the existing shell walls with age, as well as the establishing of a 392
stronger microstructure in older shells (Weiss et al. 2002). Mg:Ca ratios of calcifiers track the ratio 393
of these minerals in seawater (Ries et al. 2010) . Concordantly, higher Mg:Ca ratios observed here 394
in the shells of individuals exposed to elevated pCO2 suggest that this elemental ratio increased in 395
in those treatments. Higher Mg:Ca ratio in seawater is indeed known to favour the formation of 396
Mg rich aragonite, instead of calcite (Ries et al. 2010, Smith et al. 2006), though seawater was not 397
undersaturated for calcite or aragonite during our experiments (Queirós et al. 2015, 398
Supplementary Information Table SI). N. lapillus may therefore have a delayed transition from 399
aragonite to calcite in more energetically challenging conditions (such as OA) as the former is less 400
energetically demanding to deposit, particularly under in low pH scenarios (Weiss et al. 2002). 401
This mechanism could explain the wider, longer and thicker shells observed in the older juveniles 402
from the high pCO2 treatments in relation to the control, as though through this delay, more 403
energy may have been available for the potentially increased calcification rate needed to address 404
the greater shell damages observed in this treatment. Therefore, N. lapillus may have the ability 405
19
to compensate, at least at this early stage of development, against the potential negative effects 406
of carbonate chemistry conditions imposed by high CO2 on shell deposition and dissolution. In line 407
with recent findings (Fitzer et al. 2016), the microstructure of the material deposited though this 408
compensation exhibited a more chaotic CaCO3 crystal formation. CaCO3 microstructure strongly 409
depends upon the presence of specific types of proteins in the extrapallial fluids (Bozhi 2011). As 410
these proteins are influenced by pH conditions (Thomsen et al., 2010; Thompson et al. 2000), 411
organisms have been observed to alter crystallisation patterns in high CO2 conditions (Cusack et
412
al. 2007). The main shell building protein in N. lapillus is dermatopontin, which is ‘acid soluble’ 413
(Suzuki & Nagasawa 2013). Based on our results it is likely that even though these proteins are 414
isolated from surrounding conditions, lower pH in the paleal fluid may have been present in 415
individuals exposed to higher CO2 contents, affecting the quality of crystallisation within the shell. 416
In some cases, proteins sensitive to low pH conditions can be substituted through the production 417
of a range of different, less pH susceptible proteins (Hüning et al. 2012), but this does not seem to 418
be the case here. 419
The most important functions of complex shell structures are to provide structural support and 420
protection from predator and physical stresses (e.g. wave action), which may cause the shell to 421
crack or even break. The crossed-lamellar structures commonly found in the shell of healthy N.
422
lapillus individuals prevent cracks in the shell from propagating through a constant change in 423
crystal orientation (Suzuki & Nagasawa, 2013). Therefore, a thicker shell does not necessarily 424
provide a better protection against predation if the cross-lamellar structure has disappeared, as 425
we observed in the shells of juvenile snails exposed to elevated pCO2, which were exacerbated by 426
an elevation in temperature. Bark-like crystal shapes such as the ones found in the acidified 427
samples in this study seem to be a phenomenon not yet widely described in the literature. Seeing 428
as the current literature is still dominated by short-term single stressors studies of adult 429
specimens, our results highlight the need to investigate the development of shell mineralogy and 430
ultrastructure in juvenile molluscs under high temperature and CO2 environments, over extended 431
20
time periods, and considering the cumulative effects of exposure (such as here and in Dupont et
432
al. 2013). Adult individuals transplanted into conditions of elevated pCO2 exhibit distinctly 433
different calcification patterns in localised, newly built shell areas, including unorganised crystals 434
with varying growth directions (Hahn et al., 2011). However, the impact of high CO2 content (and 435
high temperatures) on shell physiology, as observed here, may still lead juveniles to higher 436
vulnerability to predation and physical damage, despite the potential for adaptive processes 437
taking place during shell deposition. Crystallisation processes are similar in many organisms, even 438
in far related groups, such as brachiopods, suggesting that the results from this study may be 439
generalised to the impacts of similar conditions on the shell formation of juveniles of other 440
species (Cusack et al. 2007). 441
Shell volume and weight were not impacted by exposure to elevated pCO2 or temperature nor by 442
the combination of the two factors, and surprisingly neither differed significantly among snails of 443
different age classes in our experiment. Insignificant differences in shell volume may be due to 444
the differences in shell shape we observed across treatments. A shape change may lead to shells 445
that are more stout or narrow, consequentially changing shell size but not volume. Thicker shells 446
in acidified treatments were also less dense (as seen in adult N. lapillus, Queirós et al. 2015), 447
possibly explaining the lack of significant changes in shell weight. In our experiment, differences in 448
shell shape were also not consistent across age groups, indicating that as Nucella grow, some 449
compensatory responses seem to take place that affect its shape. Younger shells of both control 450
pCO2 treatments were most antithetic to one another while in the older groups it were shells 451
from ambient pCO2 combined with elevated temperature, as well as shells from elevated 452
temperature combined with ambient temperature treatments. Gastropod morphology varies with 453
environmental pressures such as predation, wave action and desiccation, substrate, CaCO3 and O2 454
concentration and temperature (Langerhans & Dewitt 2002, Hollander et al. 2006, Queiroga et al. 455
2011). Although water chemistry, pH and temperature have also been known to affect molluscs’ 456
shell shapes (Melatunan et al. 2013), the main factors influencing gastropods seem to be more of 457
21
a more mechanical nature, namely predation and wave pressure (Queiroga et al. 2011, 458
Langerhans & Dewitt 2002). Shell slandering and squatting as seen in Guerra-Varela et al. (2009) 459
prevents shells from being swept away by waves as well as making it harder for predators to crush 460
them. The findings we observed here regarding shell shape further suggest that high CO2 contents 461
will potentially make young N. lapillus more vulnerable to both pressures, as shells became longer 462
and stouter. Shells that are structurally weakened in this way are more likely to become easy prey 463
to shell-crushing predators such as crabs (e.g. Melatunan et al. 2013). The shell variability we 464
observed within treatment groups may be partly due to the fact that the embryonic development 465
takes place within individual egg capsules which can lead to variations in size and developmental 466
rate (Thorson, 1950). Differences in parental investment may also be a deciding factor of 467
variability within age groups (Órdenes & Antonio 2012). In this study, the duration of elevated 468
pCO2 and temperature exposure of the adults at the time of reproduction has not been taken into 469
account because we could trace parental links within the experimental replicate, but this could 470
have driven some of variation we observed within treatment groups that was not assignable to 471
specific the treatments. This is a factor that should be considered in future studies. 472
The impact of elevated pCO2 and temperature treatments on shell properties and growth pattern 473
may lead to important implications for the size, shape and structural integrity of shells in adult N.
474
lapillus in a future ocean. We observed very little reproductive output in N. lapillus from our 475
highest CO2 treatment, though a congeneric Nucella species occurs and grows in natural vents 476
(Selin 2010), and as Nucella are direct developers, reliance on lateral input of individuals from 477
adjacent areas seems unlikely. Survival and viable reproduction of N. lapillus therefore seems 478
possible below or even up to 1000 ppm of CO2, though the viability of offspring may be limited at 479
this high level of pCO2 (Queirós et al. 2015). At this most extreme pCO2 level, expected in about a 480
century according to projections reviewed by the IPPC (2014) in which seawater CO2 may reach 481
1000 ppm, the combination of decreased investment in offspring by adults (4 juveniles born in 14 482
months, compared to 280 that were born in control conditions in the same time) and the 483
22
observed impairment of the protective shell structures of juveniles leading to increased juvenile 484
mortalities paint a bleak picture for Nucella in the near future ocean. Queirós et al. (2015) found 485
that sea warming may counter-act metabolic depression caused by elevated pCO2 in adult N.
486
lapillus, and that decrease in prey acquisition due to limited chemo-sensory function under high 487
CO2 may be counter-acted by adaptive predatory behaviour, in the absence of predators. 488
However, weakened shell structures that make N. lapillus more vulnerable to predation may 489
hinder the latter, both in adults and juveniles, as the observed altered predation behaviour 490
requires more extensive foraging times and would therefore expose the individuals to predators 491
for longer periods of time. It follows that, overall, Nucella lapillus and other calcifiers with similar 492
ecology are more likely to suffer from the effects of climate change and acidification than to 493
benefit from it. N. lapillus’s predation on important habitat forming species plays a key role in the 494
shaping the biodiversity of temperate rocky shores and so these findings have potentially 495
important consequences for the structuring of these communities under near future ocean 496
conditions. 497
Conclusion
498
Queirós et al. (2015) found that, considering a large number of ecological processes, N. lapillus
499
populations from highly productive areas may be more likely to be able to compensate for the 500
energetically costly effects of elevated pCO2 and temperature levels. Nevertheless, changes to the 501
shell development, morphology and composition of juvenile N. lapillus exposed to high pCO2 and 502
temperature conditions observed in this study may lead to higher predation risks. Thus, though 503
some populations may be expected to be more heavily affected by OA and OW than others, 504
considering the low dispersal rates of Nucella due to the direct development, changes in 505
distributional ranges may be foreseen through this enhanced sensitivity of the juvenile stage. 506
Sustainability of populations in regions changing less within the near future and in populations 507
with exceptionally wide genome range could be expected, as some phenotypic plasticity was 508
observed, even within our across-generation study (Lardies et al. 2014, Sunday et al. 2014). 509
23
However, even sub-lethal effects can affect communities in composition and fitness (Parker et al. 510
2013), and sub-lethal modifications that may be seen as adaptive, e.g. in behaviour, may be 511
detrimental within a community setting (Queirós et al. 2015). This study highlights that changes in 512
CO2 content and temperature may impact natural populations via effects on early-life stages and 513
developmental plasticity that are not evident in adults, and a large gap remains about how 514
population-level effects of OA and OW may scale to natural systems, in the context of whole 515
communities. 516
517
Acknowledgements
518
This study was undertaken as part of a Master’s thesis, as an added-value activity within NERC-519
DEFRA-DECC funded UK Ocean Acidification Research Programme (grant agreement 520
NE/H01747X/1). Analyses of impacts on shell structure were supported by the Research 521
Programme AcidiCO2ceans funded by the Latsis Foundation (Greece). SR was awarded a 522
Santander Internationalization Postgraduate Scholarship that supported this work. PC is 523
supported by a NSERC Discovery Grant. Joana Nunes, and other staff and students at Plymouth 524
Marine Laboratory are thanked for support provided during the mesocosm experiments at PML. 525
Nafsika Papageorgiou (HCMR) is thanked for her kind support and advice during the stay of SR at 526
HCMR. Glenn Harper, Peter Bond, Terry Richards, and Roy Moate at Plymouth University are 527
thanked for aiding with the development of the methodology for specimens preparation and 528
subsequent electron microscopic imaging and x-ray spectra acquisition. Andrew Foggo is thanked 529
for support in travel through Plymouth University. 530
531
532
References
24
Akaike, H. 1973. Information theory and an extension of the maximum likelihood principle. In 2nd 534
International Symposium on Information Theory, Tsahkadsor, Armenia, USSR, September 2-8, 535
1971. Ed. by Petrov, B.N. and Csáki, F. Akadémiai Kiadó, Budapest. 267-281. 536
Barros, P., Sobral, P., Range, P., Chicharo, L., Matias, D. 2013. Effects of sea-water acidification on 537
fertilization and larval development of the oyster Crassostrea gigas, Journal of Experimental 538
Marine Biology and Ecology, 440, 200-206 539
Bozhi, J. 2011. Screening of molluscan extrapallial proteins on CaCO3 crystallisation via 540
microfluidics. PhD thesis, University of Glasgow 541
Bruker 2014. DATAVIEWER v1.5.1. Bruker microCT. Kontich, Belgium 542
Brusca, R.C., Brusca, G.J. 2003. Invertebrates. Sinauer Associates, 2nd Edition 543
Byrne, M., Przesllawski, R. 2013. Multistressor impacts of warming and acidification of the ocean 544
on marine invertebrates’ life histories. Integrative and Comparative Biology. 53: 1-15 545
Calosi, P., Rastrick, S. P., Lombardi, C., de Guzman, H. J., Davidson, L., Jahnke, M., et al. 2013.
546
Adaptation and acclimatization to ocean acidification in marine ectotherms: an in situ transplant
547
experiment with polychaetes at a shallow CO2 vent system. Philosophical Transactions of the
548
Royal Society of London B: Biological Sciences. 368: 1627
549
Cascetta, E. 1984. Estimation of trip matrices from traffic counts and survey data: A Generalized 550
Least Squares estimator, TransportationResearch. 18: 289-299 551
Clarke, K. R. 1993. Non-parametric multivariate analyses of changes in community structure. 552
Australian Journal of Ecology. 18: 117-143 553
Clarke, B., Gorley, R. 2014. Primer 6. PRIMER-E Ltd., Ivybridge, UK 554
Cotton, P.A., Rundle, S.D., Smith, K.E. 2004. Trait compensation in marine Gastropods: Shell 555
shape, avoidance behavior, and susceptibility to predation. Ecology. 85: 1581-1584 556
25
Cusack, M., Perez-Huerta, A., Dalbeck, P. 2007. Common crystallographic control in calcite 557
biomineralisation of bivalve shells. CrystEngComm. 9: 1215-1218 558
Dupont, S., Thorndyke,M. C. 2009. Impact of CO2-driven ocean acidification on invertebrates early
559
life-history – What we know, what we need to know and what we can do. Biogeosciences
560
Discussions. 6: 3109-3131
561
Dupont, S., Dorey, N., Stumpp, M., Melzner, F., & Thorndyke, M. 2013. Long-term and
trans-life-562
cycle effects of exposure to ocean acidification in the green sea urchin Strongylocentrotus
563
droebachiensis. Marine Biology. 160: 1835-1843
564
Falini, S., Albeck, S., Weiner, S., Addadi, L. 1996. Control of aragonite polymorphism by mollusk 565
shell macromolecules. Science. 271: 67-69 566
Feely, R.A., Sabine, C.L., Lee, K., Berelson, W., Kleypas, J., Fabry, V.J., Millero, F.J. 2004. Impact of 567
anthropogenic CO2 on the CaCo3 systems in the oceans. Science. 305: 362-366 568
FEI 2013. Amira 5.5, Visualization Sciences Group. FEI Company. Burlington, USA 569
Feldkamp, L., Davis, L., Kress, J. 1984. Practical cone-beam algorithm. Journal of the Optical 570
Society of America, 1: 612-619 571
Findlay, H.S., Kendall, M.A., Spicer, J.I., Widdicombe, S. 2010. Post-larval development of two 572
intertidal barnacles at elevated CO2 and temperature. Marine Biology. 157: 725-735 573
Findlay, H.S., Beesley, A., Dashfield, S., Mcneill, C.L., Nunes, J., Queirós, A.M., Woodward, E.M.S. 574
2013. UKOA Benthic Consortium, PML intertidal mesocosm experimental environment dataset (ed 575
Laboratory PM). British Oceanographic Data Centre - Natural Environment Research Council, UK 576
Fisher, R. A. 1925. Statistical methods for research workers. Genesis Publishing Pvt Ltd.
26
Fitzer, S. C., Chung, P., Maccherozzi, F., Dhesi, S. S., Kamenos, N. A., Phoenix, V. R., & Cusack, M.
578
2016. Biomineral shell formation under ocean acidification: a shift from order to chaos. Scientific
579
reports, 6.
580
Green, M.A., Jones, M.E., Boudreau, C.L., Moore, R.L., Westman, B.A. 2004. Dissolution mortality 581
of juvenile bivalves in coastal marine deposits. Journal ofLimnology and Oceanography. 49: 727-582
734 583
Guerra-Varela, J., Colson, I., Backeljau, T., Breugelmans, K., Hughes, R. N., & Rolán-Alvarez, E.
584
2009. The evolutionary mechanism maintaining shell shape and molecular differentiation
585
between two ecotypes of the dogwhelk Nucella lapillus. Evolutionary Ecology. 23: 261-280
586
Hahn, S., Rodolfo-Metalpa, R., Griesshaber, E., Schmahl, W.W., Buhl, D., Hall-Spencer, J.M., 587
Baggini, C., Fehr, K.T., Immenhauser, A. 2011. Marine bivalve geochemistry and shell 588
ultrastructures from modern low pH environments. BiogeosciencesDiscussions. 8: 10351-10388 589
Hollander, J., Collyer, M.L., Adams, D.C., Johannesson, K. 2006. Phenotypic plasticity in two 590
marine snails: constraints superseding life history. The Authors Journal Compilation. 19: 1861-591
1872 592
Hughes, R.N., Elner, R. 1979. Tactics of a predator, Carcinus maenas, and morphological responses 593
of the prey, Nucella lapillus. The Journal of Animal Ecology. 48: 65-78 594
Hüning, A.K., Melzner, F., Thomsen, J., Gutowska, M.A., Krämer, L., Frickenhaus, S. et al. 2012. 595
Impacts of seawater acidification on mantle gene expression patterns of the Baltic Sea blue 596
mussel: implications for shell formation and energy metabolism. Marine Biology. 160: 1-17 597
IPPC 2014. Summary for Policymakers, In: Climate Change 2014: The Physical Science Basis. 598
Cambridge University Press, Cambridge, United Kingdom and New York, USA 599
Klingenberg, C.P. 2011. MorphoJ: an integrated software package for geometric morphometrics, 600
Molecular Ecology Resources. 11: 353-357 601
27
Kroeker, K.J., Kordas, R.L., Crim, R.N., Singh, G.G. 2010. Meta-analysis reveals negative yet variable 602
effects of ocean acidification on marine organisms. Ecology Letters. 13: 1419-1434 603
Kruskal, J.B. 1964. Multidimensional scaling by optimizing goodness of fit to a nonmetric 604
hypothesis. Psychometrika. 29: 1-27 605
Kurihara, H. 2008. Effects of CO2-driven ocean acidification on the early developmental stages of 606
invertebrates. Marine Ecology Progress Series. 373: 275-284 607
Langerhans, R.B., Dewitt, T.J. 2002. Plasticity constrained: over-generalized induction cues cause 608
maladaptive phenotypes. Evolutionary Ecology Research. 4: 857-870 609
Lardies, M.A., Arias, M.B., Poupin, M.J., Manriquez, P.H., Torres, P.H., Vargas, C.A., Navarro, J.M., 610
Lagos, N.A. 2014. Differential response to ocean acidification in physiological traits of Concholepas
611
concholepas populations. Journal of Sea Research. 90: 127-134 612
Marxen, J.C., Prymak, O., Beckmann, F., Neues, F., Epple, M. 2008. Embryonic shell formation in 613
the snail Biomphalaria glabrata: A comparison between scanning electron microscopy (SEM) and 614
synchrotron radiation microcomputer tomography (SRµCT). Journal of Molluscan Studies. 74: 19-615
25 616
Melatunan, S., Calosi, P., Rundle, S.D., Widdicombe, S., Moody, A.J. 2013. Effects of ocean 617
acidification and elevated temperature in shell plasticity and its energetic basis in an intertidal 618
gastropod. Marine Ecology Progress Series. 472: 155-168 619
Melzner, F., Thomsen, J., Koeve, W., Oschlies, A., Gutowska, M.A., Bange, H.W., Hansen, H.P., 620
Körzinger, A. 2013. Future ocean acidification will be amplified by hypoxia in coastal habitats. 621
MarineBiology. 160: 1875-1888 622
Nienhuis, S., Palmer, A.R., Harley, C.D.G. 2010. Elevated CO2 affects shell dissolution rate but not 623
calcification rate in a marine snail. Proceedings of the Royal Society of Biological Sciences. 277: 624
2553-2558 625
28
Órdenes, C., Antonio, S. 2012. Offspring size, provisioning and performance as a function of 626
maternal investment in direct developing whelks. PhD Thesis, Victoria University of Wellington, 627
New Zealand 628
Parker, L.M., Ross, P.M., O’Connor, W.A., Pörtner, H.O., Scanes, E., Wright, J.M. 2013. Predicting 629
the Response of Molluscs to the Impact of Ocean Acidification. Biology. 2: 651-692 630
Plummer, L.N., Busenberg, E. 1982. The solubilities of calcite, aragonite and vaterite in CO2-H2O 631
solutions between 0-90 °C, and an evaluation of the aqueous model for the system CaCO3-CO2-632
H2O. Geochimica e Cosmochimica Acta. 46: 1011-1040 633
Queiroga, H., Costa, R., Leonardo, N., Soares, D., Clearly, D.F.R. 2011. Morphometric variation in 634
two intertidal littorinoid gastropods. Contributions to Zoology. 80: 201-211 635
Queirós, A. M., Fernandes, J. A., Faulwetter, S., Nunes, J., Rastrick, S. P. S, Mieszkowska, N., Artioli, 636
Y. et al. 2015. Scaling up experimental ocean acidification and warming research: from individuals 637
to the ecosystem, Global Change Biology. 21: 130-143 638
Reed, S.J.B. 2005. Electron Microprobe Analysis and Scanning Electron Microscopy in Geology. 639
Cambridge University Press. Cambridge, UK 640
Reusch, T. B. 2014. Climate change in the oceans: evolutionary versus phenotypically plastic
641
responses of marine animals and plants. Evolutionary Applications. 7: 104-122.
642
Ries, J.B., Cohen, A.L., McCorkle, D.C. 2009. Marine calcifiers exhibit mixed responses to CO2-643
induced ocean acidification. Geology. 37: 1131-1134 644
Ries, J.B. 2010. Review: geological and experimental evidence for secular variation in seawater 645
Mg:Ca (calcite-aragonite seas) and its effects on marine biological calcification. Biogeosciences. 7:
646
2795-2849 647
29
Sanford, E., Gaylord, B., Hettinger, A., Lenz, E.A., Meyer, K., Hill, T.M. 2014. Ocean acidification 648
increases the vulnerability of native oysters to predation by invasive snails. Proceedings of the 649
Royal Society of Biological Sciences.281: 1-8 650
Selin, N. 2010. Peculiarities of the habitat of Nucella freycineti (Mollusca: Gastropoda) at 651
volcanogenic vent sites. Russian Journal of Marine Biology.36: 26-33 652
Smith, A.M., Key Jr., M.M., Gordon, D.P. 2006. Skeletal mineralogy of bryozoans: Taxonomic and 653
temporal patterns. Earth-Science Reviews. 78: 287-306 654
Sunday, J. M., Calosi, P., Dupont, S., Munday, P. L., Stillman, J. H., & Reusch, T. B. 2014. Evolution
655
in an acidifying ocean. Trends in Ecology & Evolution. 29: 117-125
656
Suzuki, M, Nagasawa, H. 2013. Shell structures and their formation mechanisms. Canadian Journal 657
of Zoology. 91: 349-366 658
Thompson, J.B., Palcoczi, G.T., Kindt, J.H., Michenfelder, M., Smith, B.L., Stucky, G., Morse, D.E., 659
Hansma, P.K. 2000. Direct observation of the transition from calcite to aragonite growth as 660
induced by abalone shell proteins. Biophysical Journal. 79: 3307-3312 661
Thomsen, J., Gutowska, M.A., Saphörster, J., Heinemann, A., Trübenbach, K., Fietzke, J., 662
Hiebenthal, C., Eisenhauer, A., Körzinger, A., Wahl, M., Melzner, F. 2010. Calcifying invertebrates 663
succeed in a naturally CO2 enriched coastal habitat but are threatened by high levels of future 664
acidification. Biosciences Discussions. 7: 5119-5156 665
Thorson, G. 1950. Reproductive and larval ecology of marine bottom invertebrates. Biology 666
Revisions. 25: 1-45 667
Trussel. G.C., Ewanchuck, P.J., Bertness, M.D. 2003. Trait-mediated effects in rocky intertidal food 668
chains: predator risk cues alter prey feeding rates. Ecology. 84: 629-640 669
Turner, L. M., Ricevuto, E., Massa-Gallucci, A., Gambi, M. C., & Calosi, P. 2015. Energy metabolism 670
and cellular homeostasis trade-offs provide the basis for a new type of sensitivity to ocean 671
acidification in a marine polychaete at a high-CO2 vent: adenylate and phosphagen energy pools 672
versus carbonic anhydrase. Journal of Experimental Biology. 218: 2148-2151 673
30
Vermeij, G.J. 1995. A natural history of shells. Princeton, NJ: Princeton University Press 674
Weiss, I.M., Tuross, N., Addadi, L., Weiner, S. 2002. Mollusc larval shell formation: Amorphous 675
calcium carbonate is a precursor phase for aragonite. Journal of Experimental Zoology. 293: 478-676
491 677
Widdicombe, S., Spicer, J.I. 2008. Predicting the impact of ocean acidification on benthic 678
biodiversity: What can animal physiology tell us?. Journal of Experimental Marine Biology and 679
Ecology. 366: 187-197 680
Wiley, D.F. 2007. Landmark 3.6. Institute of Data Analysis and Visualization (IDAV). University of 681
California, Davis, USA 682
31
Figures Legends:
683
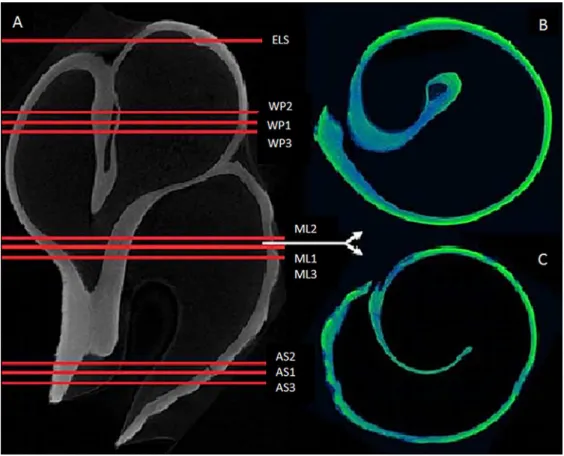
Figure 1
684
(A) Cross-sectional image of a nine week old Nucella shell taken with the micro-CT scanner, 685
indicating the position of the horizontal shell slices used for analysis. ELS = 3 % from the top 686
(posterior), AS1 = 3 % from the bottom (anterior), AS2 = 4 % from the bottom, AS3 = 5 % from the 687
bottom, WP1 = Widest Point, WP2 = WP1+1 %, WP3 = WP1-1 %, ML1 = Mid-Lip, ML2 = Mid-Lip 688
+1 %, ML3 = Mid-Lip -1 %. Lighter colour indicates higher shell density, while black illustrates the 689
background medium (air), not included in the analysis. 1 (B) and (C) are horizontal slices which 690
illustrate the differences in density throughout two randomly selected three week old shells. (B) is 691
a shell from ambient conditions (380ppm CO2 / 9-15 °C), while (C) was exposed to elevated 692
temperatures and CO2 input (750ppm CO2 / 9-15 +2 °C) . Colours represent densities: green: 693
denser areas, blue: less dense areas. The scale bar below the vertically cross-sectioned shell 694
equates to roughly 0.5 mm. 695
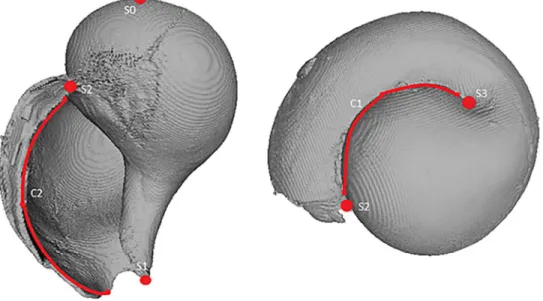
Figure 2
696
Surface model of a shell, reconstructed using µ-CT. The landmark protocol used in this study to 697
evaluate shell morphology is represented by the red curves and dots. S0-S3 are single landmarks 698
while C1 and C2 represent curves. 699
Figure 3
700
Images of shell exteriors taken with the electron microscope (EM) to show examples of surface 701
damage in 750T (left) and 750A (right) shells. 702
Figure 4
703
Electron microscopy images of the crystallised structures within shells of the older group in lines 704
according to treatments; columns 1 represents a view of both layers together, 2 shows a close-up 705
32
of the crossed-lamellar layer, and column 3 are images of the homogenous structures. The first 706
picture depicting the 750T treatment represents a shell with no distinct difference between 707
layers, the second in that line shows an example of a shell with remnants of crossed-lamellar 708
structuring and the third picture is a close-up of the bark-like structure. 709
Figure 5
710
The effect of exposure to elevated pCO2 and temperature, in juveniles of N. lapillus of different 711
age (weeks 3 and week 9 post exposure) on shell (A) Mg2+:Ca2+ ratios and (B) density which are 712
coded along the x-axis with a combination of pCO2 content (380 or 750 µatm), temperature (A for 713
ambient, T for elevated by 2 °C) and age (3 and 9 weeks). Where the graph displays a Mg:Ca ratio 714
of 0, this is due to 0 specimens having been available for this analysis from that treatment rather 715
than a ratio of 0. 716
Figure 6
717
The effects of exposure to elevated pCO2 and temperature, in juveniles of N. lapillus of different 718
age (weeks 3 and 9 post exposure) on shell (A) length, (B) width and (C) thickness which are coded 719
along the x-axis with a combination of CO2 content (380 or 750), temperature (A for ambient, T 720
for elevated) and age (3 and 9 weeks). 721
Figure 7
722
PC1 and PC2 of nine week old shells to the left (A) and three weeks old shells to the right (B) 723
Figure 8
724
nMDS plot of similarities and dissimilarities between individuals according to age and treatment 725
groups. 726
727
33 729
34
Figures: submitted in separate files (see tiff files labelled fig1-fig8) 731
35 732
AS2 AS1 AS3 ELS
36
Tables:
733
734
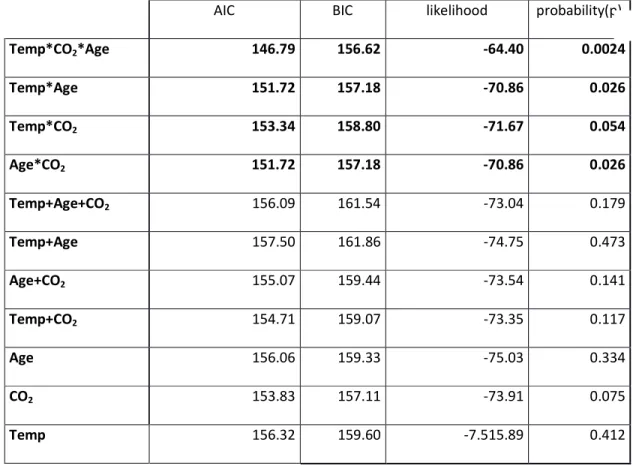
Table 1: GLS test results concerning shell density:
735
Significant results (p < 0.05) are bold. 736
Temp = temperature treatment, CO2 = CO2 treatment, Age = Age group 737
AIC BIC likelihood probability(p)
Temp*CO2*Age 146.79 156.62 -64.40 0.0024
Temp*Age 151.72 157.18 -70.86 0.026
Temp*CO2 153.34 158.80 -71.67 0.054
Age*CO2 151.72 157.18 -70.86 0.026
Temp+Age+CO2 156.09 161.54 -73.04 0.179
Temp+Age 157.50 161.86 -74.75 0.473
Age+CO2 155.07 159.44 -73.54 0.141
Temp+CO2 154.71 159.07 -73.35 0.117
Age 156.06 159.33 -75.03 0.334
CO2 153.83 157.11 -73.91 0.075
Temp 156.32 159.60 -7.515.89 0.412
738
C B