Sharif University of Technology
Scientia IranicaTransactions B: Mechanical Engineering www.scientiairanica.com
Research Note
The use of Taguchi method with grey relational
analysis to optimize the EDM process parameters with
multiple quality characteristics
F. Kolahan
a;and M. Azadi Moghaddam
bDepartment of Mechanical Engineering, Ferdowsi University of Mashhad, Mashhad, P.O. Box 91775-1111, Iran. Received 2 March 2013; received in revised form 9 March 2014; accepted 29 September 2014
KEYWORDS Taguchi technique; Grey relational analysis;
Electrical discharge machining;
Optimization; Analysis of variance; Signal to noise ratio.
Abstract. Multi-criteria optimization of processes parameters could be used to simultaneously achieve several conicting goals such as increasing product quality and reducing production time. In this paper, Grey Relational Analysis (GRA) and Taguchi method have been employed to optimize Electrical Discharge Machining (EDM) process parameters for AISI 2312 (40CrMnMoS86) hot worked steel alloy. The experimental data are gathered based on Taguchi L36design matrix. The tests are conducted under varying
peak current (I), voltage (V ), pulse on time (Ton), pulse o time (To) and duty factor
(). The process output characteristics include Surface Roughness (SR), Tool Wear Rate (TWR) and Material Removal Rate (MRR). The objective is to nd a combination of process parameters to minimize TWR and SR and maximize MRR. The three performance characteristics are combined into a single objective using grey relational analysis. The GRA was followed by the signal to noise ratio to specify the optimal levels of process parameters. The signicance of the process parameters on the overall quality characteristics of the EDM process was also evaluated quantitatively using the Analysis of Variance (ANOVA) method. Optimal results were veried through additional experiments.
© 2015 Sharif University of Technology. All rights reserved.
1. Introduction
Electrical Discharge Machining (EDM) is a non-conventional, thermo-electric process in which the ma-terial from work piece is eroded by a series of discharge sparks between the work and tool electrode immersed in a liquid dielectric medium. These electrical sparks melt and vaporize minute amounts of the workpiece, which are then ushed away by the dielectric liquid.
These electrical discharges melt and vaporize
*. Corresponding author. Tel.: +98 9153114112; Fax: +98 5138763304
E-mail addresses: [email protected] (F. Kolahan); masoud [email protected] (M. Azadi Moghaddam)
minute amounts of work material, which are then ejected and ushed away by the dielectric. Due to the good electrical and thermal properties of tool electrode, a very low wear in tool can be achieved during these electrical discharges. EDM can provide an eective solution for machining hard conductive materials and reproducing complex shapes. EDM involves the phenomena such as: spark initiation, dielectric breakdown, and thermo-mechanical erosion of metals [1]. A schematic illustration of EDM process is presented in Figure 1.
EDM has several distinctive advantages over other machining processes. It does not make direct con-tact between the electrode and the work piece and hence such problems as mechanical stresses, chatter
Figure 1. Schematic illustration of electrical discharge machining [1].
and vibration are eliminated [2,3]. Materials of any hardness can be cut as long as the material can conduct electricity. Complex shapes with high dimensional accuracy and surface nish can be produced. However, EDM is a time consuming and costly process. The proper selection of its process parameters is essential to increase production rate and to improve product quality. Like any other machining processes, the performance of EDM is signicantly aected by its process parameter settings. Important process pa-rameters in EDM are peak current (I), voltage (V ), pulse on time (Ton), pulse o time (To) and duty
factor () [4-6]. These parameters, in turn, determine the process output characteristics among which Tool Wear Rate (TWR), Material Removal Rate (MRR) and Surface Roughness (SR) are the most important ones [2]. It is essential, therefore, to nd an accurate relation between process tuning parameters and its output responses. As a result, a comprehensive study of the eects of EDM parameters on the machining characteristics such as SR, TWR and MRR is of great signicance.
It is well known that modeling the relationships between the input and output variables for non-linear, multi-variable systems are very dicult via traditional modeling methods [7]. In recent years, techniques such as statistical analysis, Design Of Experiments (DOE) and Articial Neural Networks (ANN) have increasingly been employed to establish the relations between various process parameters and the process outputs in variety of manufacturing industries [7,8]. Tzeng et al. [9] investigated the optimization of CNC turning operation parameters for SKD11 (JIS) using the Grey relational analysis and Taguchi method. Sivasankar et al. [10] performed the grey relational analysis and regression modeling for prediction on tool materials performance to minimize the roughness and tool wear rate and taper angel during EDM hot pressed ZrB2. Mohana et al. [11] and Krishna [12]
developed ANN models based on experimental data for EDM. The proposed ANN models were then combined with Genetic Algorithm (GA) to minimize surface
roughness. Ling Wu et al. [13] added aluminum and surfactant in the dielectric in order to improve the surface nish of SKD steel parts. It is observed that the best distribution eect is found when the concentrations of the Al powder and surfactant in the dielectric are 0.1 and 0.25 g/l, respectively. Yang et al. [14] proposed an optimization methodology base on Simulated Annealing (SA) algorithm and ANN to maximize the MRR as well as minimize the SR on steel work pieces. Kansal et al. [15] studied the eect of silicon powder mixing into the dielectric uid of EDM for machining AISI D2 die steel. The conrmation
runs showed that the setting of peak current at a high level, pulse-on time at a medium level, pulse-o time at a low level, powder concentration at a high level, and gain at a low level would result in optimum MRR.
Kiyak and Cakr [16] have studied the eects of EDM parameter levels on surface roughness for machining of 40CrMnNiMo864 tool steel (AISI P20) which is widely used in the production of plastic mold and die. It is observed that surface roughness increases with increasing pulse current and pulse time. Low cur-rent and high pulse time would produce good surface nish quality. The selection of this set of machining parameters is not useful, however, because machining process generally becomes very slow. Material removal rate will be low and thus machining cost increases. This combination should be used in nish machining step of EDM process [16].
As mentioned above, EDM technique is specially useful when the workpiece is hard, and requires high surface nish. The distinct advantages of the EDM method become most evident when it is employed to machine such hard-to-machine materials as AISI 2312 hot worked steel. In addition, mechanical and physical properties of hot worked steel, such as toughness and high wear resistance, has made it an important material for engineering components particularly in making moulds and dies. To the best of our knowledge, there is no published work to statistically study the eects of EDM parameters on the most important output characteristics, namely, MRR, TWR and SR when machining AISI2312 hot worked steel parts. Therefore, the main objectives of the present study are:
1. To establish the relationship between these param-eters and the EDM input paramparam-eters;
2. To derive the optimal parameter levels for max-imum MRR and minmax-imum SR and TWR using statistical analysis of the experimental data. Finally, the article concludes with the verication of the proposed approach and a summary of the major ndings.
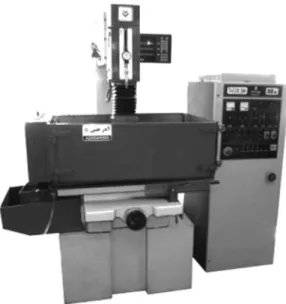
Figure 2. Die-sinking EDM machine used for experiments.
Table 1. Process parameters and their design levels. No. Symbols Factors Units Level
1 2 3
1 A Pulse o time (To) s 10 75 |
2 B Pulse on time (Ton) s 25 100 200
3 C Peak current (I) A 2.5 5 7.5
4 D Duty factor () S 0.4 1 1.6
5 E Voltage (V ) V 50 55 60
2. Experimental equipment and Design Of Experiment (DOE)
In this study, an Azerakhsh-304H die-sinking machine has been used to perform the experiments (Figure 2). The pure kerosene was used as the dielectric uid in all experiments.
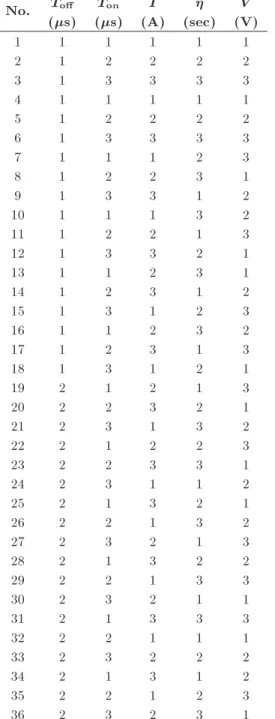
To gather the data needed for process analysis, the Taguchi L36 matrix has been selected. The
main purpose of fractional Design Of Experiments (DOE) techniques, including Taguchi method, is to obtain as much information as possible from a limited number of experiments. In many DOE schemes, it is necessary that all process variables have the same number of levels. Taguchi is one of the few that allows for uneven levels. Table 1 lists the ranges of process parameters and their corresponding levels. As shown, pulse o time is considered at two levels, while all other process variables have three levels. In DOE, the number of required experiments (and hence the experiment cost) increases as the number of parameters and/or their corresponding levels in-crease. That is why it is recommended that the parameters with less likely pronounced eects on the process outputs be evaluated at fewer levels. In
addition, the limitations of test equipment may also dictate a certain number of levels for some of the process parameters. The die-sinking EDM machine used for the experiments had only two settings for pulse of time To (10 and 75 s). Moreover,
reviews of the related literature and the results of our initial tests have revealed that To is not as
important as other process parameters and hence it may be evaluated at fewer levels without loss of accuracy [13,14].
The electrodes were made of 16 mm cylindrical shape copper (99.8% purity and 8.98 g/cm3 density).
The test specimens were made of AISI 2312 hot worked steel with dimensions of 60 mm 20 mm 10 mm. A total of 4 tests were performed on each specimen, two tests on each side. Therefore, nine samples have been used for the 36 required tests. Several other specimens were also used in order to determine the feasible ranges of process parameters and to verify the repeatability of the experiments. The machining time for each test was 45 minutes. Furthermore, the experiments have been done in random order to increase accuracy.
The 36 sets of data needed for modeling are obtained using L36 Taguchi matrix (Table 2). The
most prominent performance characteristics in EDM are MRR, SR and TWR which can be used to evaluate the machining quality [17].
Material Removal Rate (MRR) is a measure of machining speed and is expressed as the Work piece Removal Weight (WRW) in a predetermined machining time in minute (T ) that is:
MRR (gr/min) =WRW
T : (1)
In EDM, both the tool (electrode) and the work piece erode due to repeated electrical discharges between the two. The electrode (tool) wear happens on all the surfaces in which electric discharges take place, including the bottom surface as well as the sides (if the machined cavity is deep). Since in EDM the shape of the tool is projected onto the workpiece, tool wear may cause dimensional and geometrical inaccuracies. This problem would be more severe when machining sharp edges or when performing the nal (nishing) EDM passes on the workpiece. That is why tool wear rate should be kept as low as possible. The tool wear in EDM is usually measured by the Tool Wear Rate (TWR) which is the ratio of material removed from the electrode (TWW) to the material removed from the work piece (WRW):
TWR (%) = TWWWRW 100: (2) After machining, the surface nish of each sample was measured with an automatic digital Surtronic (3+)
Table 2. The L36experimental matrix for 5 input
variables.
No. To
(s) Ton
(s) I (A)
(sec)
V (V)
1 1 1 1 1 1
2 1 2 2 2 2
3 1 3 3 3 3
4 1 1 1 1 1
5 1 2 2 2 2
6 1 3 3 3 3
7 1 1 1 2 3
8 1 2 2 3 1
9 1 3 3 1 2
10 1 1 1 3 2
11 1 2 2 1 3
12 1 3 3 2 1
13 1 1 2 3 1
14 1 2 3 1 2
15 1 3 1 2 3
16 1 1 2 3 2
17 1 2 3 1 3
18 1 3 1 2 1
19 2 1 2 1 3
20 2 2 3 2 1
21 2 3 1 3 2
22 2 1 2 2 3
23 2 2 3 3 1
24 2 3 1 1 2
25 2 1 3 2 1
26 2 2 1 3 2
27 2 3 2 1 3
28 2 1 3 2 2
29 2 2 1 3 3
30 2 3 2 1 1
31 2 1 3 3 3
32 2 2 1 1 1
33 2 3 2 2 2
34 2 1 3 1 2
35 2 2 1 2 3
36 2 3 2 3 1
SR tester. Also, to measure the MRR and TWR an A&D electronic balance with 0.01gr accuracy was used (Figure 3).
3. Grey relational analysis and signal to noise ratio
3.1. Grey relational analysis
As mentioned earlier, MRR and SR are the most important performance characteristics in EDM. How-ever, MRR has contradictory eect on SR and vice versa. This calls for multi-criteria optimization of the
Figure 3. Digital surface roughness tester and electronic balance.
two conicting outputs. In this section, the use of Taguchi technique with the Grey Relational Analysis (GRA) optimization methodology for multi-criteria optimization is discussed.
The grey theory, rst proposed by Deng [16], avoids the inherent defects of conventional statistical methods and only requires a limited set of data to esti-mate the behavior of an unknown system. During the past two decades, the grey theory has been successfully applied in various applications including engineering, social sciences, economy, etc.
The rst step in Grey Relational Analysis (GRA) is normalizing the raw data. Suppose in a system there are n series of data (number of run tests) and in each series m responses (number of dependent variables) measured. Test results are then determined by yi;j
(i = 1; 2; ; n and j = 1; 2; ; m) [18,19].
To perform the GRA on such systems, the follow-ing steps are performed [16]:
a) A linear normalization of the experimental results for the responses, namely MRR, TWR, and SR is performed in the range between 0 and 1. In this step, if the higher value of a response is desired, the equation used for normalizing, which is called \the-higher-the-better" criterion, is:
Zi;j
= (yi;j min(yi;j; i = 1; 2 ; n))
(max(yi;j; i=1; 2 ; n) min(yi;j;i=1; 2 ; n))(3):
Thus, Material Removal Rate (MRR) is normalized by this equation. When the lower value of a re-sponse is preferred, \the-lower-the-better" criterion is used for normalizing, given by:
Zi;j
=(max(y(max(yi;j; i = 1; 2 ; n) yi;j)
i;j; i=1; 2 ; n) min(yi;j;i=1; 2 ; n))(4):
By the same token, the above relationship is used to normalize observed Surface Roughness (SR) and Tool Wear Rate (TWR).
b) The Grey Relational Coecient (GRC) for the normalized values through the following equation is calculated:
(Zo; Zi;j) = min+ max
oj(k) + max; (5)
where is the distinguishing coecient and 0 1. The weighting of parameters depends on the relative importance of each response [19]. When weighting coecients are equal, the value of is set to 0.5. In Table 3, GRG is the weighted for the
Table 3. Results for GRCs, GRGs and S/N ratios. No. GRC of
MRR
GRC of TWR
GRC of
SR GRG S/N
1 0.334 0.676 0.882 0.631 -4.004 2 0.404 0.906 0.574 0.628 -4.042 3 0.566 0.983 0.338 0.629 -4.027 4 0.333 0.725 1.000 0.686 -3.273 5 0.376 0.881 0.586 0.614 -4.231 6 0.576 0.990 0.356 0.640 -3.871 7 0.336 0.783 0.897 0.672 -3.448 8 0.502 0.903 0.502 0.636 -3.936 9 0.398 0.979 0.361 0.580 -4.746 10 0.338 0.819 0.814 0.657 -3.645 11 0.362 0.865 0.544 0.590 -4.576 12 1.000 0.981 0.333 0.771 -2.255 13 0.366 0.396 0.766 0.509 -5.857 14 0.389 0.762 0.517 0.556 -5.099 15 0.346 0.961 0.636 0.678 -3.771 16 0.355 0.396 0.789 0.513 -5.788 17 0.381 0.783 0.436 0.533 -5.467 18 0.352 0.972 0.669 0.664 -3.556 19 0.338 0.402 0.755 0.498 -6.045 20 0.403 0.684 0.580 0.555 -5.107 21 0.345 0.960 0.614 0.639 -3.882 22 0.353 0.375 0.766 0.498 -6.048 23 0.453 0.752 0.488 0.565 -4.961 24 0.334 0.903 0.644 0.627 -4.051 25 0.374 0.336 0.695 0.695 -6.588 26 0.343 0.955 0.669 0.656 -3.667 27 0.367 0.984 0.399 0.583 -4.681 28 0.369 0.345 0.755 0.490 -6.193 29 0.341 0.947 0.789 0.692 -3.190 30 0.371 0.986 0.385 0.581 -4.721 31 0.362 0.359 0.755 0.492 -6.156 32 0.336 0.9186 0.629 0.628 -4.045 33 0.447 0.979 0.484 0.636 -3.924 34 0.345 0.333 0.755 0.478 -6.414 35 0.340 0.945 0.695 0.660 -3.607 36 0.483 1.000 0.443 0.642 -3.848
three process outputs. Zo(k) is called the reference
sequence and it could take either the largest or smallest values given by Eqs. (3) and (4). When the higher value of a response is preferred, it is the largest value among all Zi;j, and when the
lower value of a response is desired, Zo(k) takes
the smallest value of all Zi;j: oj is the absolute
value of the dierence between Zo(k) and Zi;j(k);
oj = jZo(k) Zi;jj. min and max are the
smallest and the largest value of dierence between Zo(k) and Zi;j(k) which are given by:
min= min jZo(k) Zi;jj;
max= max jZo(k) Zi;jj: (6) c) Grey Relational Grade (GRG) for any response is
computed by: Grade(Zo; Zi;j) =
n
X
k=1
k(Zo; Zi;j); (7)
where:
n
X
k=1
k(Zo; Zi;j) = 1;
in which k is the weighting factor of each
re-sponse [16].
3.2. Signal to Noise (S/N) ratio
Taguchi method uses design of experiments to study the entire parameters space with small number of experiments. It also makes use of signal-to-noise (S/N) ratios as performance measures to optimize the output quality characteristic against such variations in noise factors. In this method, a loss function is dened to calculate the deviation between the experimental value and the desired value. This loss function is further transformed into S/N ratio. Based on the process under consideration, the S/N ratio calculation may be decided as \the Lower the Better, (LB)" or \the Higher the Better, (HB)" as given in the following [7]:
LB: S/N() = 10 log 1n
n
X
i=1
z2 i
!
; (8)
HB: S/N() = 10 log 1 n
n
X
i=1
1 z2
i
!
; (9)
where n is the number of iteration in a trial, in this case, n = 1 and zj is the jth measured value in a run.
The experimental results of GRGs for 36 tests and their corresponding S/N ratios are listed in Table 3.
However, the S/N analysis could determine the best set of parameters levels so as only a single objec-tive is optimized. Here, the problem under considera-tion has three distinctive (some conicting) objectives
Table 4. Response (mean) of S/Ns. Symbol Level 1 Level 2 Level 3
A -4.199 -4.840 |
B -5.288 -4.327 -3.944 C -3.678 -4.808 -5.074 D -4.760 -4.397 -4.402 E -4.346 -4.640 -4.574
and, in many practical cases, it is desirable to make a balance among these objectives. To overcome this shortcoming of S/N, we have employed GRA to turn all three objectives into a single criterion called GRGs. Although in our example problem the weighting factors are considered to be equal, the weights can be adjusted based on the relative importance of the objectives. The S/N analysis is then applied to the GRGs in order to determine optimal levels of parameters settings for multi criteria optimization. In the next step, since the higher values of the GRGs are preferred, the S/N ratio values are calculated for observed GRGs by taking into consideration Eq. (9).
4. Results and discussion 4.1. Selecting optimal levels
To determine the eect of any parameter on the output response, it is enough to compute the average of S/N for each test containing this parameter in desired level [20]. For example, mean eect of To in level 1 is obtained
from averaging test runs number 12 up to 18. In this way, the mean eects of parameters are computed and listed in Table 4. Since larger value of mean S/N is always favorable, with respect to the data in Table 4, optimal set of parameters are: To at level 1, Ton at
level 3, I at level 1, at level 2 and V at level 1, i.e., (A1 B3 C1D2 E1).
4.2. Performing ANOVA
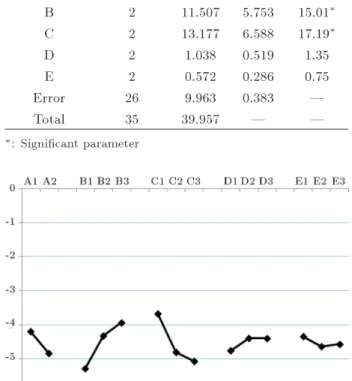
Using Minitab software, the Analysis of Variance (ANOVA) is performed to determine how well a model ts the experimental data and, therefore, represents the actual process under study [19]. The results of ANOVA for S/Ns values with A, B, C, D, and E are shown in Ta-ble 5. According to ANOVA procedure, large F-value indicates that the variation of the process parameter makes a big change on the performance characteristics. In this study, a condence level of 95% is selected to evaluate parameters signicances. Therefore, F-values of machining parameters are compared with the appropriate values from condence table, F;v1;v2,
where is risk, v1 and v2 are degrees of freedom
associated with numerator and denominator illustrated in Table 5 [19]. Within 95% condence limit, ANOVA results indicate that peak current, pulse on time, and
Table 5. Result of ANOVA for S/N. EDM
parameters
Degree of freedom
(Dof)
Sum of square (SSj)
Mean
square F-value
A 1 3.699 3.699 9.65
B 2 11.507 5.753 15.01
C 2 13.177 6.588 17.19
D 2 1.038 0.519 1.35
E 2 0.572 0.286 0.75
Error 26 9.963 0.383 |
Total 35 39.957 | |
: Signicant parameter
Figure 4. The eect of machining parameters on signal to noise (S/N).
pulse o time are, respectively, the most important input parameters.
The optimum level of these signicant parameters has been found by examining the level averages of the factors. For each process output response, the S/N ra-tio determined from the experimentally observed values has been statistically evaluated by ANOVA technique (Figure 4). Generally, a greater S/N corresponds to a better performance and hence the optimal level of each machining parameter is the level with the greatest S/N value [20]. As shown, Figure 4 demonstrates that the optimal combination of parameters settings for maximizing S/N value is 1-3-1-2-1 which corresponds to To= 10 s, Ton= 200 s, I = 2:5 A, = 1 s and
V = 50 V.
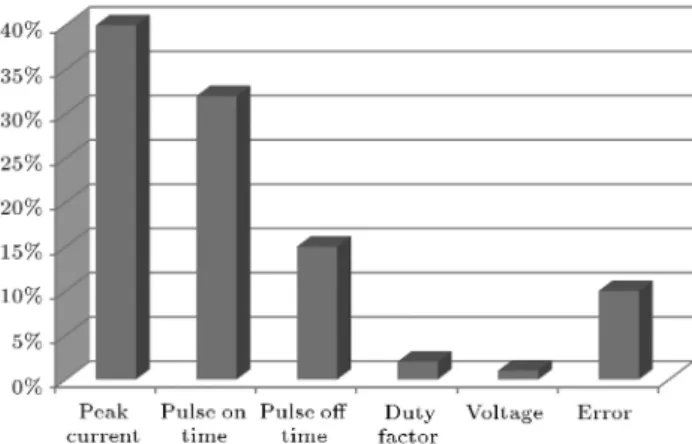
ANOVA results may provide the percent contribu-tions of each parameter [21]. The percent contribucontribu-tions of the EDM parameters on the three weighted process parameters are shown in Figure 5. According to this gure, peak current is the major factor aecting the process outputs with 38% contribution. It is followed by pulse on time and pulse o time with 31% and 15%, respectively. Figure 5 reveals that duty factor and voltage have no signicant eects on process output responses. The 9% error shown may be related to the
Figure 5. Percent contributions of machining parameters on the three weighted process outputs.
uncontrolled parameters and process noises, given as: Pi(%) = SSTotal sum of squarei (DOFi MSerror): (10)
In the above formula, according to the ANOVA results (Table 5), Piis contribution percentage, SSiis the sum
of square, DOFi is the degree of freedom of ith factor,
and MSerror is the mean sum of square of error [21].
4.3. Conrmation experiments
The nal step is to predict and verify the improvement of the quality characteristics using the optimal level of the EDM process parameters. Since the optimum values of parameter levels were not included in the main experiments, an indirect method has been employed to predict both single and multiple characteristics. The predicted optimum value of each response (opt) at
optimum set (A1B3 C1 D2 E1) is determined by [20]:
opt= m+
X
i=1
(i m); (11)
where m is total average of any response, i is
pre-dicted mean response at optimum level i of parameter j, and is the number of main design parameters that aect the performance measure.
In Table 6, the predicted and actual (experimen-tal) S/N values for MRR, SR and TWR based on the optimal parameter levels are listed. Moreover, in the rst column of this table, the S/N value for the best set of parameters in L36 Taguchi matrix is given
(experiment No. 12). The predicted optimal settings
results in the S/N ratios of -2.044 which shows an improvement of more than 9% over the best settings in L36 Taguchi matrix. For comparison purposes, we
have conducted a verication test using these optimal settings whose S/N ration is reported in the third column (-1.84). The error between the predicted and actual optimal S/N ratios is around 9.5%. Given the nature of EDM process and its many variables, the result is quite acceptable and proves that the experimental result is correlated with the estimated value.
5. Conclusion
The quality of nal product in EDM is signicantly aected by the choice of process parameters levels. On the other hand, the interactions of these parameters call for simultaneous selection of their optimal values. In this study, the eects of EDM process parameters settings on the three important output characteris-tics for AISI 2312 hot worked steel alloy have been investigated. Also, based on GRG values, the multi criteria process parameters optimization is successfully carried out. First, using Taguchi technique, a set of experiments has been performed to collect required data. Then, Grey Relational Grades (GRG) has been employed to combine three important process characteristics, including material removal rate, surface roughness and tool wear rate, into a single multi-criteria measure of performance. The results of analysis of variance, performed on the S/N of GRG values, indicate that peak current, pulse on time and pulse o time are, respectively, the most eective parameters aecting EDM characteristics. Next, mean of S/N values have been used to determine the optimal levels of process parameters. It is shown that by setting To at level 1, Ton at level 3, I at level 1, at
level 2 and V at level 1, the combined measure of performance would be optimized. Using the optimal settings, tool wear rate and surface roughness have been signicantly improved while material removal rate has been reduced. However, it is noted that the rela-tive importance of the three measures of performance could be accommodated by changing the corresponding weights in GRG analysis. The approach proposed here, with minor changes, may be implemented for modeling and optimization of other manufacturing
Table 6. Comparison between optimal S/N values (predicted vs. experimental). Best set of parameters
in L36 (No.12) Prediction Experiment
Setting level A1B3C3D2E1 A1B3C1D2E1 A1B3C1D2E1
S/N -2.255 -2.044 -1.845
processes and engineering materials. In this work, Grey Relational Analysis and Signal to Noise method have been employed for multi-criteria optimization of EDM parameters. Using other heuristic proce-dures, such as Genetic Algorithm (GA) and Simu-lated Annealing (SA), for multi-criteria optimization of machining parameters could be a promising area of research. In such study the optimization results may be compared with those of present work as benchmark analysis.
Nomenclature
n Number of test runs
m Number of dependent variables measured
yi;j Identication of test results (i =
1; 2; ; n and j = 1; 2; ; m) The distinguishing coecient
(0 1)
Zo(k) The reference sequence (Zo(k) = 1 or
0, k = 1; 2 ; m);
oj The absolute value of the dierence
between Zo(k) and Zi;j(k)
k Weighting factor of each response
n Number of iterations in a trial (for LB and HB equations)
yj The jth measured value in a run
References
1. Zlem, O., Salman, M. and Kayacan, C. \Evolutionary programming method for modeling the EDM param-eters for roughness", Journal of Materials Processing Technology, 200(1-3), pp. 347-355 (2008).
2. Kaladhar, M., Subbaiah, K., Srinivasa C. and Narayana, K. \Application of Taguchi approach and utility concept in solving the multi-objective problem when turning AISI 202 austenitic stainless steel", Journal of Engineering Science and Technology, 4(1), pp. 55-61 (2011).
3. Amri, M.A. and Amin, A.K. \The implementation of Taguchi method on EDM process of Tungsten car-bide", European Journal of Scientic Research, ISSN 1450-216X, 26(4), pp. 609-617 (2009).
4. Kumar, S., Singh, R., Singh, T.P. and Sethi, B.L. \Sur-face modication by electrical discharge machining: A review", Journal of Materials Processing Technology, 209(8), pp. 3675-3687 (2009).
5. Bonny, K., Debaets, P., Quintelier, J., Vleugels, J., Jiang, D., Vander Biest, O., Lauwers, B. and Liu, W. \Surface nishing: Impact on tribological character-istics of WC-Co hard metals", Journal of Materials Processing Technology, 43(1-2), pp. 40-54 (2010).
6. Goparsamy, A., Mondal, B. and Ghosh, B. \Taguchi method and ANOVA: An approach for process param-eter optimization of hard machining while machining hardened steel", International Journal of Scientic and Industrial Research, 68(8), pp. 686-695 (2009).
7. Kao. B. and Hocheng, H. \Optimization of electro-chemical polishing of stainless steel by grey relational analysis", International Journal of Materials Process-ing Technology, 140(1-3), pp. 255-259 (2003).
8. Sexton, R., Dorsey, S. and Johnson, J.D. \Optimiza-tion of neural networks: A comparative analysis of the genetic algorithm and simulated annealing", European Journal of Operational Research, 114(3), pp. 589-601 (1999).
9. Chiang, K. and Chang, F. \Optimization of the WEDM process of particle-reinforced material with multiple performance characteristics using grey re-lational analysis", Journal of Materials Processing Technology, 180(3), pp. 96-101 (2006).
10. Cheng, Y. and Chung, C. \Optimization of micro milling electrical discharge machining of Inconel 718 by Grey-Taguchi method", Journal of Manufacturing Processes, 23(3), pp. 661-666 (2013).
11. Mohana, G.K., Hanumantha, D. and Rajurkar, K. \Hybrid modeling and optimization of surface pro-duced by electric discharge machining using articial neural network and genetic algorithm", International Journal of Engineering and Applied Sciences, 5(5), pp. 72-81 (2010).
12. Krishna, M.R. and Hanumantha, D. \Development of hybrid model and optimization of surface roughness in electric discharge machining using articial neural net-works and genetic algorithm", International Journal of Materials Processing Technology, 209(2), pp. 1512-1520 (2009).
13. Lin, Y.C., Chen, Y.F., Wang, D.A. and Lee, H.S. \Optimization of machining parameters in magnetic force assisted EDM based on Taguchi method", Jour-nal of Materials Processing Technology, 209(3), pp. 3374-3383 (2009).
14. Yang, S.H., Srinivas, J., Mohana, S., Lee, D.M. and Balaji, S. \Optimization of electric discharge machin-ing usmachin-ing simulated annealmachin-ing", Journal of Materials Processing Technology, 209(3), pp. 4471-4475 (2009).
15. Kansal, H.K. \Eect of silicon powder mixed EDM on machining rate of AISI D2 die steel", Journal of Manufacturing Processes, 9(1), pp. 13-22 (2007).
16. Tzeng, C., Lin, Y., Yang, Y. and Jeng, M. \Optimiza-tion of turning opera\Optimiza-tions with multiple performance characteristics using the Taguchi method and Grey relational analysis", Journal of Materials Processing Technology, 209(6), pp. 2753-2759 (2009).
17. Lin, J.L. and Lin, C.L. \The use of the orthogonal array with grey relational analysis to optimize the electrical discharge machining process with multiple performance characteristics", International Journal of Machine Tools & Manufacture, 116(2), pp. 237-244 (2002).
18. Kolahan, F., Golmezerji, R. and Moghaddam, M.A. \Multi objective optimization of turning process using grey relational analysis and simulated annealing algo-rithm", Applied Mechanics and Materials, 110(2), pp. 2926-2932 (2012).
19. Singh, D., Chaturvedi, V. and Vimal, C. \Parametric optimization of TIG process parameters using Taguchi and Grey Taguchi analysis", International Journal of Emerging Trends in Engineering and Development, 4(2), pp. 64-78 (2013).
20. Ahilan, C., Kumanan, C. and Sivakumaran, N. \Appli-cation of grey based Taguchi method in multi-response optimization of turning process", International Jour-nal of Advanced in Production and Management, 5(2), pp. 171-180 (2010).
21. Roy, R.K., A Primer on the Taguchi Method, United states of America, Society of Manufacturing Engineers (2010).
Biographies
Farhad Kolahan is an associate professor at the De-partment of Mechanical Engineering, Ferdowsi
Univer-sity of Mashhad, I.R. Iran. He received his BSc degree in Production and Manufacturing Engineering from Tabriz University, Iran in 1988. He then continued his postgraduate studies abroad and graduated with a PhD degree in Industrial and Manufacturing Engineering from Ottawa University, Canada in 1999. Dr. Ko-lahan's research interests include production planning and scheduling, manufacturing processes optimization and applications of heuristic algorithms in industrial optimization.
Masoud Azadi Moghaddam was born in April 1984, in Mashhad, Iran. He has a BSc Degree in Production and Manufacturing Engineering. He has also obtained an MSc degree in Mechanical Engineering (manufacturing engineering) from Ferdowsi University of Mashhad, I.R. Iran. He is now a PhD candidate in the same university, under the supervision of Dr. Kolahan. The research he has undertaken includes modeling and optimization of advanced manufacturing processes. Mr. Azadi has published several journal and conference papers in his eld of research during his post graduate studies.
![Figure 1. Schematic illustration of electrical discharge machining [1].](https://thumb-us.123doks.com/thumbv2/123dok_us/8387289.2228497/2.892.95.431.150.337/figure-schematic-illustration-electrical-discharge-machining.webp)