Peer Grading in a MOOC: Reliability, Validity, and
Perceived Effects
Heng Luo
John A. Dutton E-Education Institute, Pennsylvania State University
Anthony C. Robinson
Pennsylvania State University
Jae-Young Park
Pennsylvania State University
ABSTRACT
Peer grading offers a scalable and sustainable way of providing assessment and feedback to a massive student population. However, currently there is little empirical evidence to support the credentials of peer grading as a learning assessment method in the MOOC context. To address this research need, this study examined 1,825 peer grading assignments collected from a Coursera MOOC with the purpose of investigating the reliability and validity of peer grading, as well as its perceived effects on students’ MOOC learning experience. The empirical findings provide evidence that the aggregate of student graders can provide peer grading scores fairly consistent and highly similar to instructor grading scores. Student survey responses also indicate peer grading activities to be well received by a majority of MOOC students, who believe it was fair, useful, beneficial, and would recommend it to be included in future MOOC offerings. Based on the empirical results, this study concludes with a set of principles for designing and implementing peer grading activities in the MOOC context.
I.
INTRODUCTION
The recent development of Massive Open Online Courses (MOOCs) has provided instructors with exciting opportunities to teach to a massive and diverse student population through learning platforms such as Coursera, EdX, and Udacity. However, the large-scale participation and open access nature of MOOCs also present many pedagogical problems. One major problem relates to providing MOOC students with timely, accurate, and meaningful assessment of their course assignments since enrollment in a MOOC can be as large as hundreds of thousands of students (Pappano, 2012; Piech, et al., 2013), exceeding the grading capacity of a single instructor or teaching assistant. While automated grading software, like the one used by EdX, provide a potential solution for this problem, many MOOC assignments, such as design projects, art works, and essays, can be too complex to be graded by computers at this point in time.
In an attempt to solve this assessment problem, Coursera has incorporated a peer review system in its learning platform that guides students in using grading rubrics to evaluate and provide feedback for each other’s work. While Coursera’s peer review system is informed by literature on peer review and crowd-sourcing (Coursera, n.d.), its reliability and validity as a learning assessment method in a MOOC
environment has yet to be verified, and little is known regarding how the peer grading practice can affect students’ MOOC learning experience. To address this research need, this study systematically investigates the peer grading process and results from a Coursera-based MOOC offered by The Pennsylvania State University (PSU) in 2013. Findings from this study provide empirical evidence on the reliability, validity, and perceived effects of MOOC-scale peer grading.
II.
LITERATURE REVIEW
A.
Overview of Peer Grading
Peer grading, also known as peer assessment, is defined by Topping (2009) as “an arrangement for learners to consider and specify the level, value, or quality of a product or performance of other equal-status learners” (pp. 20-21). Peer grading has been practiced in a wide range of subject domains, including natural sciences (Billington, 1997; Butcher et al., 1995), medicine (Hammond & Kern, 1959; Magin, 1993), social sciences (Falchikov, 1994; Orpen, 1982), engineering (Fry, 1990; Oldfield & Macalpine, 1995), and business (Freeman, 1995; Kaimann, 1974). Peer grading results typically take the form of a numeric rating, or a written comment—in many cases, a combination of both (Lu & Law, 2012, Strijbos, Narciss, & Dünnebier, 2010).
In addition to reducing instructors’ workloads, peer grading is also believed to bring many potential benefits to student learning, including a sense of ownership and autonomy (Brown, Race, & Rust, 1995; Race, 1998), increased motivation (Bostock, 2000; Vu & Dall'Alba, 2007), enhanced social presence (Strijbos & Sluijsmans, 2010; Topping et al., 2000), and the development of higher-order thinking and metacognition skills (Brown, Rust, & Gibbs, 1994; Mok, 2011; Topping, 2009; Wen, Tsai, & Chang, 2006). Despite the potential benefits, peer grading still faces resistance from both students and instructors (Cho, Schunn, & Wilson, 2006; Magin, 2001; Stefani, 1994). Pre-conceived notions of low reliability and validity of peer grading is found to be one of the main reasons for such resistance (Falchikov & Goldfinch, 2000; McGarr & Clifford, 2013).
B.
Reliability and Validity
The reliability and validity of peer grading have been researched primarily in the context of face-to-face higher education (Cheng & Warren, 1999; Cho et al., 2006; Falchikov & Goldfinch, 2000; Stefani, 1994; Zhang, Johnston, & Kilic, 2008). Reliability is usually measured by the consistency of scores given by multiple student graders, and validity is commonly calculated as the correlation coefficient between student-assigned scores and instructor-assigned scores, assuming that instructors can provide fair and accurate grading results. In other words, reliability and validity discussed in this literature review should be considered as inter-rater reliability and convergent validity.
Peer grading appears to be a valid learning assessment method, as many studies have reported a high correlation between student and instructor grading results. For example, Falchikov and Goldfinch (2000) conducted a meta-analysis of 56 studies on peer grading published between 1959 and 1999 and found a significant overall correlation between student-assigned scores and instructor-assigned scores (r = 0.69). Bouzidi and Jaillet (2009) and Sadler and Good (2006) further investigated peer grading in the contexts of online instruction and secondary education and found its validity to be high in both contexts (r = 0.88-0.91 and r = 0.91-0.94). However, contradictory evidence can also be found in the literature as incidences of low validity were reported in a few studies (Cheng & Warren, 1999; Korman & Stubblefield, 1971; Mowl & Pain, 1995).
Contrary to the extensive body of literature on peer grading validity, there are few studies which calculated the inter-rater reliability of peer grading. The absence of such measurements undermine research findings regarding peer grading validity because a valid assessment should almost always be reliable (Gay & Airasian, 2003), it also makes the interpretation of individual peer grading scores more difficult. Furthermore, researchers sometimes failed to differentiate the two concepts and misreported validity (i.e., students can provide accurate grading) as reliability (i.e., students can provide consistent grading)
(Topping, 1998). Based on patterns of how students grade each other’s work (e.g., the number of graders, the method of selection), researchers have used different metrics to calculate peer grading reliability, including Pearson product-moment correlation (Haaga, 1993), proportion of variance (Marcoulides & Simkin, 1995), and intraclass correlation (Cho et al., 2006; Miller, 2003). Statistical results show students can produce consistent and reliable grading scores. However, more empirical research is needed for any generalizable claims to be made about peer grading reliability.
Factors influencing peer grading validity and reliability were also examined in the literature. Falchikov and Goldfinch (2000) found that using a single composite score to assess academic products based on given criteria improved the agreement between student graders and instructors, and thus identified grade structure, assignment type, and grading criteria as the factors affecting validity. Cho et al (2006) considered the number of student graders to be a key factor for reliability as the consistency of student-assigned scores can be significantly improved with the introduction of more graders. On the other hand, factors such as subject domain, course level, and student attitude were found to have limited impact on peer grading validity and reliability (Falchikov & Goldfinch, 2000; McGarr & Clifford, 2013). In summary, research findings in general support the legitimacy of peer grading and have identified a list of factors that might affect its reliability and validity. However, it is important to note such findings are mainly based on the context of traditional college degree courses with small or moderate enrollments and relatively homogenous student populations, and thus their applicability in the MOOC context remains largely unknown and in need of further research.
C.
Peer Grading in MOOCs
The concept of crowd-sourcing grading activities to MOOC students has garnered a fair amount of attention from interested parties. Many educators and scholars have described their experiences with MOOC-scale peer grading from the perspective of either an instructor or a student, and there are ongoing conversations discussing its validity and effects in the popular press and on personal blogs (McEwen, 2013; Morrison, 2013; Neidlinger, 2013; Rees, 2013; Watters, 2012). Mixed findings regarding the fairness of peer grading in MOOCs have been reported. For example, Rees (2013) described her learning experience in a MOOC on world history. She admitted that she tended to get high grades for those assignments she worked hard on, and commented, “I think my peers graded my essays just right” (para 5). On the other hand, Neidlinger (2013) described the frustration felt by many MOOC students who believed their peers were not qualified to evaluate their assignments as they “don’t grade according to the rubric but according to their opinion” (para 5). McEwen (2013) and Watters (2012) further discussed additional problems facing peer grading in MOOCs, such as the varying quality of feedback, little sense of reciprocity and community, and lack of supervision and moderation. However, these assumptions about MOOC-scale peer grading have not been empirically verified, as none of them were based on the examination of real peer grading data.
III.
RESEARCH CONTEXT AND QUESTIONS
A.
The Peer Grading Assignment
The peer grading assignment examined in this study is the final assignment for a Coursera MOOC named Maps and the Geospatial Revolution (MGR) (www.coursera.org/course/maps), a 5-week introductory course on mapping and geospatial analysis offered by The Pennsylvania State University in 2013. MGR aims to teach students the key concepts in cartography, geographic information systems, and spatial thinking by having students work with contemporary mapping and analysis software to solve real-world geographic problems. There were 48,984 students who registered for the course, with 8,707 students remaining active in the last week of the course. According to self-reported demographic data for 7,551 of the MGR students, 70% of students were male and 30% were female. The average age of students was 36.5, and over 80% of students held post-secondary degrees (33.8% Bachelor’s degree, 39.1% Master’s degree, and 8% Ph.D. degree). About 61% of students reported working full-time, and roughly 30% of students resided in the United States at the time of the course. A total of 3,064 students passed the course (assignment completion rate over 70%), and 1,211 passed with distinction (assignment completion rate
over 90%).
The instructor of MGR is the second author of this paper, and developed most of the course’s content, activities, and assignments, including the peer grading assignment in the final week. In this assignment, each student was required to select a mapping technology platform (e.g. ArcGIS Online, QGIS, and GRASS) and design a map that tells a story about a chosen topic. A possible story topic could be highlights from a recent travel experience, identification of good locations for favorite restaurants, or changes that occurred in a hometown in relation to its neighboring towns. The peer grading assignment accounted for 20% of the overall grade and was evaluated with a grading rubric consisting of four criteria: clarity of presentation, convincingness of the story, quality of cartography (e.g. color, symbology, and layout organization), and aesthetics of design. Each criterion was rated using a 4-point scale from 0 to 3, with the sum of the four criterion scores as the overall peer grading score. As a result, the score for the mapping assignment ranged from 0 to 12.
Each student in MGR was required by the syllabus to grade three mapping assignments submitted by their peers. Many students, however, chose to grade more than three. The MGR instructor also required students to evaluate their own mapping assignments using the same rubric and provide a self-grading score. It is important to note Coursera uses median rather than mean to determine the final peer grading score for an assignment, which is calculated by the sum of all median scores of the rubric criteria (Coursera, 2014).
B.
Research Questions
To extend our understanding of peer grading to the MOOC context, this study investigated the peer grading results and processes in MGR. More specifically, the following three research questions guided our research agenda:
Q1.Can peer grading provide a reliable and valid assessment of student assignments in a Coursera MOOC?
Q2.Does the use of median score provide a more valid assessment than the use of mean score when calculating the final peer grading scores?
Q3.What are the perceived effects of peer grading on students’ MOOC learning experience?
IV.
METHODS
A.
Data Source
The primary data source in this study is the relational database used internally by Coursera containing all of the instructor-provided and student-generated content in MGR, including website content, copies of submitted assignments, peer grading scores and feedback, public forum data, and logs of learning activities. Upon exporting data from the database, personally identifiable information was removed and an anonymized 40-character hexadecimal identifier was assigned to identify each student.
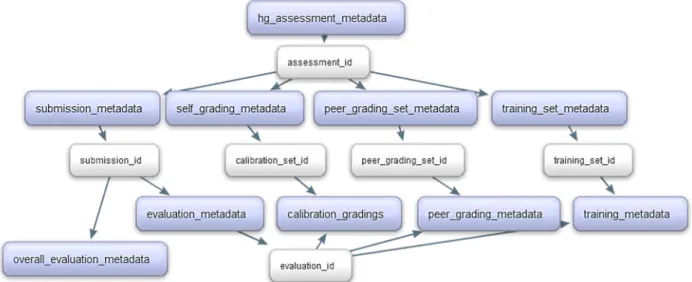
The portion of data on peer grading was organized in the structure shown in Figure 1. The submission_metadata contains the most important information regarding the mapping assignment, such as the submission ID linking back to the actual student work, the final peer grading score (reported in overall_evaluation_metadata), and the five individual peer grading scores (reported in evaluation_metadata). Additional information such as submission time and completion status can be found in peer_grading_set_metadata. Students’ self-grading results (total score and four criterion scores) are stored in self_grading_metadata. Since MGR did not include a peer grading training session, there is no data in training_set_metadata.
The instructor required each student to grade at least three assignments, with many students opting to grade more than three. As a result, there are a total of 1,825 assignment submissions that each received five peer grades. Only fully graded assignments with five peer grading scores (N=1,825) were selected for data analysis in this study, and the assignments with missing peer grading scores were excluded (N=919).
Figure 1. The structure of peer grading assignment data in Coursera’s database
Besides the secondary data exported from Coursera’s database, the MGR instructor also manually graded a 5% sample of peer graded assignments (N=93) randomly selected from the 1,825 submissions. The instructor used the assignment submission IDs to identify the actual student works and evaluated them using the same grading rubric. The instructor assigned a score for each criterion, with the sum of the four criterion scores the final grading score. As a result, a selected mapping assignment (Xassign) has the
following attributes: five individual peer grading scores (Xpeer1-5), one final peer grading score using median
(Xmedian), one final peer grading score using mean (Xmean), one instructor grading score (Xinst), and one
self-grading score (Xself), as shown in Figure 2.
Figure 2. Attributes of a submitted peer grading assignment
Another data source for this study is the end-of-course survey which asked students to rate their MOOC learning experience. Seven 5-point Likert-scale questions were built into the survey to collect students’ opinions about the fairness, usefulness, and potential benefits (e.g. learner engagement, social presence, and higher-order thinking) of the peer grading activities in MGR. The default survey tool of Coursera was not used in this study since all Coursera-based survey data are stored in an unstructured key value store in the database and thus could pose great difficulty for data extraction. Instead, this study employed an external online survey tool named Qualtrics to develop and administer the end-of-course survey, with Coursera user IDs having been passed into the Qualtrics-based survey.
r
2 2 2 / 2 / / /)
N
)
X
(
X
)(
N
)
X
(
X
(
N
X
X
X
X
inst inst mean median mean median inst mean median inst mean median∑
−
∑
∑
−
∑
∑
∑
−
∑
=
B.
Data Analysis
In order to answer the three research questions proposed in this study, the data analysis focused on the following three aspects: (1) calculating the inter-rater reliability of peer grading scores submitted to Coursera’s peer review system, (2) calculating and comparing the convergent validity of peer grading scores based on the median and the mean, and (3) examining the perceived effects of peer grading activities on students’ MOOC learning experience.
The reliability of peer grading in this study is inter-rater reliability, measured by the general agreement among the student graders assigned to grade the same assignment. Because the mapping assignment was graded by five randomly selected students for the given student pool, case1 intraclass correlation coefficient [ICC (1)] was selected as the appropriate statistical model to calculate the rater agreement (absolute agreement) in this situation (Shrout & Fleiss, 1979). Mathematically, this model can be formulated as:
In this model, ICC (1) is used to estimate the reliability of MOOC-scale peer grading, and the variance among student graders and the grader-assignment interaction are viewed as the measurement errors. The calculation of peer grading reliability was conducted using SPSS, as ICC (1) is known as one-way random agreement measure in SPSS for reliability analysis.
The validity of peer grading in this study is convergent validity, measured by the similarity between the final peer grading scores and the instructor grading scores, which is calculated as Pearson product-moment correlation coefficient (r). Two types of final peer grading score were examined: the final score determined by the median (as used in Coursera’s peer review system) and the final score determined by the mean (as calculated in this study). The following is the mathematical model for computing peer grading validity (Pearson’s r) for both types. The computation was executed in SPSS by selecting two-tailed Pearson correlation coefficient for bivariate correlation. By comparing the computation results using the median score and the mean score, this study is able to determine which type of peer grading score has yielded higher validity as an assessment.
Students’ responses to the seven survey questions were downloaded from Qualtrics and were imported into SPSS for descriptive analysis. The descriptive statistics (e.g. mean, frequency) of the survey data provide a tallied summary of students’ overall attitude towards the peer grading assignment in the MOOC and their perceptions of whether peer grading activities have positively influenced their MOOC learning experience in terms of engagement, social presence, and higher-order thinking, as suggested by the literature.
assign assign peer peer peer assign peer peer assign assign peer assign
N
MS
MS
N
MS
df
MS
MS
MS
ICC
)
(
)
(
)
1
(
× × ×−
+
+
−
=
6V.
RESULTS
A.
Inter-Rater Reliability
The inter-rater reliability of peer grading scores was calculated using ICC [1] and the statistical results are presented in Table 1. The Single Measures ICC estimates the inter-rater agreement among the five randomly selected student graders when grading the same assignment. The coefficient value of .262 is considered to be low in strength, indicating peer grading scores tend to vary greatly among individual students and a single student’s grading score is not very reliable. Compared to the Single Measures, the Average Measures ICC (.64) shows moderate strength, suggesting the reliability of peer grading scores can be enhanced if the mean of the five individual scores is used as an index of measurement. To further determine the source of error, the random criteria scenario (i.e., 5 random nested raters and 4 random crossed criteria) was conducted. Results show that the generalizability coefficient remains the same (.64) and the standard error of measurement increases only slightly from .272 to .276. Therefore, there is little room for improvement on the rubrics and scoring criteria, and the source of error is basically student graders.
Table 1.
Intraclass Correlation Coefficient (Case 1) for Peer Grading Scores (N=1825)
Intraclass
Correlation
95% Confidence Interval
F Test with True Value 0
Lower
bound
Upper
bound
Value df1
df2
Sig
Single Measures
.262
.240
.284
2.774 1824 7300 .000
Average Measures .640
.613
.665
2.774 1824 7300 .000
This study also calculates the ICCs for sub-scores assigned to the four grading criteria with the purpose of finding out how reliability measurements might differ due to the varying complexity of grading tasks. These statistical results are presented in Table 2. As can be seen, the Single Measures ICCs are low for all four grading criteria, and the biggest grading disagreement is on the evaluation of cartography quality. The Single Measures ICC for this criterion is only .176. Using the mean score rather than the individual scores can greatly increase the reliability of peer grading scores assigned to a specific criterion, as the Average Measures ICCs for the four criterion scores are between .516 and .579, a significant improvement to the Single Measures ICCs.
Table 2.
Intraclass Correlation Coefficients (Case 1) for the Four Criterion Scores (N=1825)
Clarity of the
Presentation
Convincingness
of the Story
Quality of the
Cartography
Aesthetics of the
Design
Single Measures
.216
.215
.176
.210
Average Measures
.579
.578
.516
.571
In order to examine how many peer grading scores are needed to generate a composite score with acceptable inter-rater reliability, this study also examines ICCs based on the varying numbers of student graders selected for calculation (2-5 graders). As shown in Table 3, the number of student graders has a large effect on Average Measures ICCs, and an increase in graders can generate more reliable grading results. On the contrary, the impact of total graders on Single Measures ICCs is quite limited. Dancey and Reidy (2002) suggested that correlation coefficient between .40 and .69 should be considered as being moderate in strength. As a result, it seems at least three student graders are necessary to produce a composite score with moderate inter-rater reliability (correlation coefficient > .40), whereas peer grading scores based on only two graders tend to be less reliable.
Table 3.
Intraclass Correlation Coefficients (Case 1) for Different Number of Student Graders (N=1825)
5 graders
4 graders
3 graders
2 graders
Single Measures
.262
.256
.256
.241
Average Measures
.640
.580
.508
.389
B.
Convergent Validity
This study assumes the MGR instructor can provide the true score for a submitted assignment; therefore, the validity of peer-grading scores and self-grading scores can be determined by their similarity to instructor-assigned scores, measured by the strength of bivariate correlation. As shown in Table 4, there is a strong, positive correlation (r = .619) between the instructor grading scores and the median-based peer grading scores, indicating Coursera’s peer review system can provide similar scores to those assigned by the course instructor. This correlation coefficient is slightly increased (r = .662) when mean scores rather than median scores are used to calculate the final peer grading scores. However, the difference in correlation coefficient between median-based and mean-based peer grading scores is inconsequential, and the two types of peer grading scores are also highly correlated with each other (r = .952).
Compared to the two types of peer grading scores, students’ self-grading scores seem to be a less valid assessment of the mapping assignment, as the correlation between the self-grading scores and the instructor grading scores is found to be only moderate (r = .341). The descriptive analysis also reveals that the mean of self-grading scores (x̄=10.02) is higher than the means of instructor grading scores (x̄=8.68), median-based peer grading scores (x̄=9.194), and mean-based peer grading scores (x̄=9.103). This result shows that students tend to give higher scores when evaluating their own assignments, and the scores given by the MOOC students in general are higher than those given by the instructor.
Table 4.
Pearson’s Correlation Coefficient between Instructor, Peer, and Self Grading Scores (N=93)
instructor_grading
peer_grading_median
peer_grading_mean
self_grading
instructor_grading
1
.619**
.662**
.341**
peer_grading_median
1
.952**
.279**
peer_grading_mean
1
.464**
self_grading
1
** Correlation is significant at the 0.01 level (2-tailed)
C.
Perceived Effects
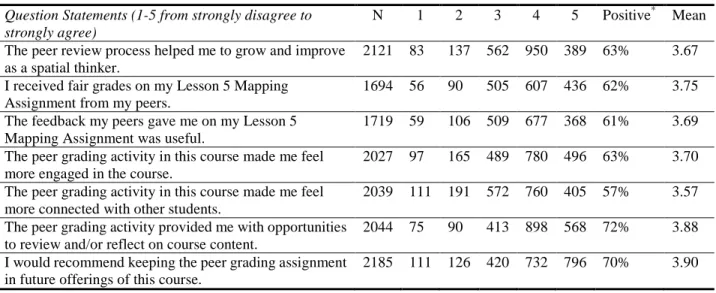
Table 5 summarizes students’ ratings of the seven survey questions regarding the peer grading activity in MGR. Missing responses for each survey question were excluded from the descriptive analysis. As shown in Table 5, about 63% of students believed the peer grading activity was helpful in developing their spatial thinking competencies, which was the main instructional goal of the course. The majority of students felt they received fair grades (62%) and useful feedback (61%) from their peers. Consistent with what the literature suggests, students in general agreed that the peer grading activity benefited their MOOC learning experience due to enhanced learner engagement (63%), an increased sense of social presence (57%), and the added opportunity of higher-order thinking (72%). As a result, about 70% of the students stated they would recommend the peer grading assignment to be included in future offerings of MGR.
Table 5. Students’ Ratings of the Seven Statements Regarding the Peer Grading Activity in MGR Question Statements (1-5 from strongly disagree to
strongly agree)
N 1 2 3 4 5 Positive* Mean The peer review process helped me to grow and improve
as a spatial thinker.
2121 83 137 562 950 389 63% 3.67 I received fair grades on my Lesson 5 Mapping
Assignment from my peers.
1694 56 90 505 607 436 62% 3.75 The feedback my peers gave me on my Lesson 5
Mapping Assignment was useful.
1719 59 106 509 677 368 61% 3.69 The peer grading activity in this course made me feel
more engaged in the course.
2027 97 165 489 780 496 63% 3.70 The peer grading activity in this course made me feel
more connected with other students.
2039 111 191 572 760 405 57% 3.57 The peer grading activity provided me with opportunities
to review and/or reflect on course content.
2044 75 90 413 898 568 72% 3.88 I would recommend keeping the peer grading assignment
in future offerings of this course.
2185 111 126 420 732 796 70% 3.90
* Agreed or strongly agreed responses from the students are considered as positive responses
VI.
DISCUSSION
A.
Research Question One Discussion
To answer Research Question One, the inter-rater reliability of peer grading scores assigned by individual MOOC students was found to be rather low, and large variance among peer-assigned scores should be expected. It is not surprising to find that the source of error is individual student graders rather than the grading criteria, considering MOOC students can be from different backgrounds and vary greatly in terms of knowledge and skills needed for providing accurate evaluation, and no training on grading is typically provided to the students. In this study, all selected assignments were graded by five students, and we found that the reliability of peer grading results can be largely improved when all five grading scores were averaged to create a composite score, as Average Measures ICC is much higher than Single Measures ICC. One easy way to increase the peer grading reliability is to assign more student graders to the assignments, as we found the number of graders to be positively correlated with the reliability measurement (Average Measures ICC), and the use of at least three graders to generate moderately reliable grading scores. This finding is also consistent with what Cho et al. (2006) suggested in their study: the use of multiple graders (4-6 graders) is necessary to achieve satisfactory levels of reliability. It is also interesting to note that the grading criterion with the lowest inter-rater agreement is quality of cartography. One possible explanation is that the evaluation of cartography quality is more closely related to the specific course content taught in the MOOC (e.g. color selection, layout design, symbolization, and data classification), and thus is more likely to suffer from MOOC students’ varying levels of prior knowledge and learning outcomes.
The empirical findings in this study also support the validity of Coursera’s peer review system as an assignment assessment tool. Coursera has taken into consideration MOOC students’ diversity and unpredictability, and attempts to counter the influence of outlier scores by using median values as the final score. The .619 correlation coefficient between Coursera’s final peer grading scores and the scores assigned by the MOOC instructor shows that the peer review system in general can provide grading results similar to what an instructor would provide. It is also interesting to find that using the mean score as the final peer grading score can provide equally valid assessment in this study. The choice of mean or median as peer grading scores is discussed in detail in the next section.
While Coursera’s peer grading results might never be as accurate as instructor grading, they yielded much higher validity than simply having MOOC students evaluate their own works since self-grading scores are found to only moderately correlate with the instructor grading scores (r = .341) and tend to get inflated. Therefore it is unwise to dismiss the validity of peer grading simply because of MOOC students’ unverified
credentials and to substitute peer grading with self-grading when designing a MOOC.
B.
Research Question Two Discussion
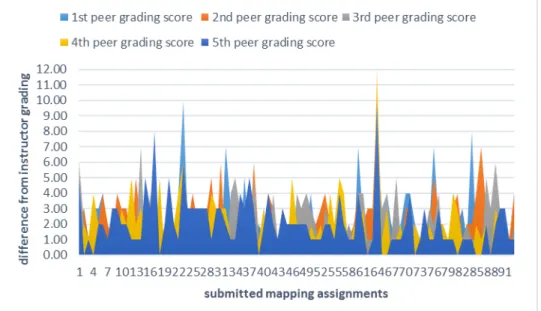
The results of this study actually show that the use of mean scores would yield slightly higher validity than the use of median scores when calculating the peer grading results, as the validity calculations for mean-based and median-based peer grading scores are .662 and .619 respectively. Statistically, median is more effective in dealing with extreme scores, which are expected to occur more often in the MOOC context due to MOOC students’ varying capability and/or motivation to grade. However, median is also a less representative average, as it is calculated based on only one or two students’ grading scores rather than all five, therefore two completely different score distributions might have the same median. In other words, mean is probably a better measurement of average than median when there are not many outlier scores, which happened to be the case in this study. Figure 3 shows how individual peer grading scores differ from the instructor grading scores based on the 5% randomly selected mapping assignments (N=93). It turns out most scoring differences are within 3 points, and outlier scores (5 points or more difference) were minimal. This might explain why mean-based peer grading score turns out to be a slightly better assessment for this MOOC. However, such finding should not be over-generalized as other MOOCs might have more frequent outlier scores where the use of median would be better.
To explore the possible causes for the outlier scores, we selected four assignment submissions with the largest scoring differences (≥ 8 points) for further examination. These assignments are submissions No.17, No.23, No.64, and No.84 as shown in Figure 3. For submissions No.23 and No.64, the assignments were no longer viewable to the instructor at the time of grading (a few months after the course) and the instructor had to assign zero scores to both of them. The fact that those two submissions received fairly consistent high scores from all five student graders made us believe that the authors had posted their works to online places that no longer exist or they removed their submissions intentionally after the MOOC ended. Submissions No.17 and No.84 revealed a different situation: In both cases, the instructor-assigned score is similar to the scores assigned by the student graders (difference ≤ 2 points), except for one student who gave extremely higher or lower scores. It is not surprising to find this type of grader in a MOOC, who always assigns high, low, or random scores regardless of the assignment quality, since there is no way to hold students accountable for the quality of their peer grading services in the course. The statistical solution to this problem is the use of median to counter the influence of outliers, but a more effective solution might be educating MOOC students to be more responsible and/or establishing a mechanism to review students’ grading performances.
Figure 3. Difference between scores assigned by student graders and the instructor
C.
Research Question Three Discussion
Table 5 shows that the MGR students’ general perception towards the peer grading activity in the course is positive. The majority of MOOC students (70%) wanted to keep the peer grading assignment in future course offerings, compared to only 11% who wanted it removed. Although in the news media there are many MOOC instructors and students expressing their concerns about the fairness of peer grading and the quality of peer feedback (McEwen, 2013; Morrison, 2013; Neidlinger, 2013; Watters, 2012), the survey results in this study told a different story: the percentage of students who complained about the fairness and usefulness of the peer grading assignment was below 10%, and over 60% of students indicated they had received fair grades and useful feedback from their peers. It is possible that students who had negative experiences with peer grading are more vocal in expressing their complaints, but such complaints might not be representative of the overall MOOC student population. The survey responses also supported the additional benefits of peer grading activities—the most recognized benefit being the opportunity for students to review and/or reflect course content. This finding can be justified using Bloom's Taxonomy of Learning Domains (Bloom, 1956), as peer grading is a form of evaluation, which is considered a higher level cognitive activity in the taxonomical hierarchy that promotes meaningful learning.
VII.
CONCLUSIONS
Our work here has shown a variety of ways to evaluate the reliability (i.e., inter-rater reliability), validity (i.e., convergent validity), and perceived effects of peer assessment in the context of map design projects in a MOOC. These results suggest that in general, the joint efforts of multiple student graders can produce fairly consistent grading results using Coursera’ peer review system. There were also high levels of agreement between student-assigned scores and instructor-assigned scores measured by the correlation coefficients, which support the validity of peer grading in the MOOC context. The post-course survey responses reveal students in general consider the peer grading activity to be a positive learning experience and would recommend keeping this component of the course in future offerings. MOOC students especially appreciate the review and reflection learning experiences associated with the peer grading activity. Based on the empirical findings in this study, we proposed a set of principles for designing and implementing peer grading activities in MOOCs. While the design principles are context-specific and should not be over-generalized, we expect them to offer insights to MOOC instructors and designers and inform future MOOC design practices. The proposed principles are listed below:
1. Peer grading should not be replaced by self-grading, as peer grading results tend to be more valid than self-grading results.
2. It is advisable to use Coursera’s default peer review system, as it can provide valid peer grading results and reduce the influence of outlier scores. However, when outlier scores are rare, mean-based peer grading scores might be a better alternative.
3. The instructor/designer should try to assign a sufficient number of student graders to each submission to increase the reliability of peer grading scores. A good rule of thumb is 3 to 5 student graders.
4. In order to increase the reliability of peer grading scores, proper training on assignment evaluation should be provided to MOOC students prior to the grading activity, since student graders are the main source of error for peer grading.
VIII.
REFERENCES
Billington, H. L. (1997). Poster presentations and peer assessment: novel forms of evaluation and assessment. Journal of Biological Education, 31(3), 218-220.
Bloom, B. S. (1956). Taxonomy of educational objectives: Vol. 1. Cognitive domain. New York: McKay. Bostock, S. (2000). Student peer assessment. Keele, Staffordshire: Centre for Learning Technology, Keele
University. Retrieved from http://www.reading.ac.uk/web/FILES/engageinassessment/Student_peer_assessment_-_Stephen_
Bostock.pdf
Bouzidi, L., & Jaillet, A. (2009). Can Online Peer Assessment be Trusted? Educational Technology & Society, 12 (4), 257–268.
Brown, S., Race, P., & Rust, C. (1995). Using and experiencing assessment, in P. Knight (Ed.) Assessment for Learning in Higher Education (pp.75-85). London: Kogan Page/SEDA.
Brown, S., Rust, C., & Gibbs, G. (1994). Strategies for diversifying assessment in higher education. Oxford: Oxford Centre for Staff Development.
Butcher, A. C., Stefani, L. A. J., & Tariq, V. N. (1995). Analysis of peer-, self- and staff-assessment in group project work. Assessment in Education, 2(2), 165-185.
Cheng, W., & Warren, M. (1999). Peer and teacher assessment of the oral and written tasks of a group project. Assessment & Evaluation in Higher Education, 24, 301–314.
Cho, K., Schunn, C., & Wilson, R. (2006). Validity and Reliability of Scaffolded Peer Assessment of Writing from Instructor and Student Perspectives. Journal of Educational Psychology, 98(4), 891-901.
Coursera. (n.d.). Pedagogical Foundations. Retrieved from https://www.coursera.org/about/pedagogy Coursera. (2014, March 12) How will my grade be determined? Retrieved from.
http://help.coursera.org/customer/portal/articles/1163304-how-will-my-grade-be-determined- Dancey, C. P., & Reidy, J. (2002). Statistics without maths for psychology (2nd ed). London: Prentice Hall. Falchikov, N. (1994). Learning from peer feedback marking: student and teacher perspectives. In H. C. Foot, C. J. Howe, A. Anderson, A. K. Tolmie, & D. A. Warden (Eds.), Group and interactive learning (pp. 411-416). Southampton and Boston: Computational Mechanics Publications.
Falchikov, N., & Goldfinch, J. (2000). Student Peer Assessment in Higher Education: A Meta-Analysis Comparing Peer and Teacher Marks. Review of Educational Research, 70(3), 287-322.
Freeman, M. (1995). Peer assessment by groups of group work, Assessment and Evaluation in Higher Education, 20(3), 289-300.
Fry, S. A. (1990). Implementation and evaluation of peer marking in higher education. Assessment and Evaluation in Higher Education, 15(3), 177-189.
Gay, L. R., & Airasian, P. (2003). Educational research: Competencies for analysis and application (7th ed.). Columbus, OH: Merrill, Prentice Hall.
Haaga, D. A. F. (1993). Peer review of term papers in graduate psychology courses. Teaching of Psychology, 20(1), 28–32.
Hammond, K. R., & Kern, F. (1959). Teaching comprehensive medical care: a psychological study of a change in medical education. Cambridge, MA: Harvard University Press.
Kaimann, R. A. (1974). The coincidence of student evaluation by professor and peer group using rank correlation. The Journal of Educational Research, 68(4), 152-153.
Korman, M., & Stubblefield, R. L. (1971). Medical school evaluation and internship performance. Journal of Medical Education, 46, 670-673.
Lu, R., & Bol, L. (2007). A comparison of anonymous versus identifiable e-peer review on college student writing performance and the extent of critical feedback. Journal of Interactive Online Learning, 6(2), 100-115.
Lu, J., & Law, N. (2012). Online peer assessment: effects of cognitive and affective feedback. Instructional Science, 40(2), 257-275.
Magin, D. (1993). Should student peer ratings be used as part of summative assessment? Higher Education Research and Development, 16, 537-542.
Magin, D. (2001). Reciprocity as a source of bias in multiple peer assessment of group work. Studies in Higher Education, 26(1), 53–63.
Marcoulides, G. A., & Simkin, M. G. (1995). The consistency of peer review in student writing projects. Journal of Education for Business, 70, 220–223.
McEwen, K. (2013, January 7). Getting to Know Coursera: Peer Assessments. Retrieved from http://cft.vanderbilt.edu/2013/01/getting-to-know-coursera-peer-assessments/
McGarr, O., & Clifford, A. M. (2013). ‘Just enough to make you take it seriously’: exploring students’ attitudes towards peer assessment. Higher education, 65(6), 677-693.
Miller, P. J. (2003). The effect of scoring criteria specificity on peer and self-assessment. Assessment & Evaluation in Higher Education, 28(4), 383-394.
Mok, J. (2011). A case study of students' perceptions of peer assessment in Hong Kong. ELT journal, 65(3), 230-239.
Morrison, D. (2013, March 9). Why and When Peer Grading is Effective for Open and Online Learning.
Retrieved from http://onlinelearninginsights.wordpress.com/2013/03/09/why-and-when-peer-grading-is-effective
-for-open-and-online-learning/
Mowl, G., & Pain, R. (1995). Using self and peer assessment to improve students’ essay writing—A case study from geography. Innovations in Education and Training International, 32, 324–335. Neidlinger, J. (2013, May 13). Does peer grading of essays really work in a Coursera online class?
Retrieved from http://loneprairie.net/peer-grading-coursera/
Oldfield, K. A., & Macalpine, M. K. (1995). Peer and self-assessment at tertiary level - an experimental report. Assessment and Evaluation in Higher Education, 20(1), 125-131.
Orpen, C. (1982). Student versus lecturer assessment of learning: a research note. Higher Education, 11, 567-572.
Pappano, L. (2012, November 2). The Year of the MOOC. The New York Times. Retrieved from http://www.nytimes.com/2012/11/04/education/edlife/massive-open-oline-courses-are-multiplyin g-at-a-rapid-pace.html?pagewanted=all&_r=0
Piech, C., Huang, J., Chen, Z., Do, C., Ng, A., & Koller, D. (2013). Tuned Models of Peer Assessment in MOOCs. Retrieved from http://www.stanford.edu/~jhuang11/research/pubs/edm13/edm13.pdf Race, P. (1998). Practical pointers on peer-assessment. In S. Brown (Ed.) Peer Assessment in Practice
(SEDA Paper 102) (pp.113-122). Birmingham: SEDA. 13
Rees, J. (2013, March 5). Peer Grading Can't Work. Retrieved from http://www.insidehighered.com/views/2013/03/05/essays-flaws-peer-grading-moocs#ixzz2MiKx NP7b
Sadler, P., & Good, E. (2006). The impact of self- and peer-grading on student learning. Educational Assessment, 11 (1), 1-31.
Shrout, P. E., & Fleiss, J. L. (1979). Intraclass correlations: uses in assessing rater reliability. Psychological Bulletin, 86(2), 420-428.
Stefani, L. A. J. (1994). Peer, self and tutor assessment: Relative reliabilities. Studies in Higher Education, 19(1), 69–75.
Strijbos, J. W., Narciss, S., & Dünnebier, K. (2010). Peer feedback content and sender's competence level in academic writing revision tasks: are they critical for feedback perceptions and efficiency? Learning and instruction, 20(4), 291-303.
Strijbos, J. W., & Sluijsmans, D. (2010). Unravelling peer assessment: Methodological, functional, and conceptual developments. Learning and Instruction, 20(4), 265-269.
Topping, K. J. (2009). Peer assessment. Theory into Practice, 48(1), 20−27.
Topping, K. J., Smith, E. F., Swanson, I., & Elliot, A. (2000). Formative peer assessment of academic writing between postgraduate students. Assessment & Evaluation in Higher Education, 25(2), 149-169.
Topping, K. (1998). Peer assessment between students in colleges and universities. Review of Educational Research, 68(3), 249-276.
Vu, T. T., & Dall’Alba, G. (2007). Students’ experience of peer assessment in a professional course. Assessment & Evaluation in Higher Education, 32(5), 541-556.
Watters, A. (2012, August 27). The Problems with Peer Grading in Coursera. Retrieved from http://www.insidehighered.com/blogs/hack-higher-education/problems-peer-grading-coursera Wen, M. L., Tsai, C. C., & Chang, C. Y. (2006). Attitudes towards peer assessment: A comparison of the
perspectives of pre-service and in-service teachers. Innovations in Education and Teaching International, 43(1), 83–92.
Zhang, B., Johnston, L., & Kilic, G. B. (2008). Assessing the reliability of self‐and peer rating in student group work. Assessment & Evaluation in Higher Education, 33(3), 329-340.