ISSN: 2252-8938, DOI: 10.11591/ijai.v9.i3.pp553-560 553
Parallel processing using big data and machine learning
techniques for intrusion detection
Alaeddine Boukhalfa1, Nabil Hmina2, Habiba Chaoui3
1,3System Engineering Laboratory, ADSI Team, National School of Applied Sciences, Ibn Tofail University, Morocco 2Sultan Moulay Slimane University, Beni Mellal, Morocco
Article Info ABSTRACT
Article history: Received May 1, 2020 Revised Jun 22, 2020 Accepted Jul 9, 2020
Currently, information technology is used in all the life domains. Many devices and equipment produce data and transfer them across the network. These transfers are not always secured and can contain new menaces and attacks invisible by the current security tools. Moreover, the large amount and variety of the exchanged data make the identification of the intrusions more difficult in terms of detection time. To solve these issues, we suggest in this paper, a new approach based on storing the large amount and variety of network traffic data employing big data techniques, and analyzing these data with machine learning algorithms, in a distributed and parallel way, in order to detect new hidden intrusions with less processing time. According to the results of the experiments, the detection accuracy of the machine learning methods reaches up to 99.9%, and their processing time has been reduced considerably by applying them in a parallel and distributed way, which proves that our proposed model is very effective for the detection of new hidden intrusions.
Keywords: Big data
Intrusion detection Machine learning Parallel processing
This is an open access article under the CC BY-SA license.
Corresponding Author: Alaeddine Boukhalfa,
System Engineering Laboratory, ADSI Team, National School of Applied Sciences,
Ibn Tofail University, Kenitra, Morocco. Email: [email protected]
1. INTRODUCTION
Nowadays, information technology is employed in all areas of life (finance, education, weather, etc...), various equipment, namely, computers, servers, tablets and others devices, are producing continuously data and exchanging it through the network. However, these exchanges between these equipments are not always secured, and they can contain new hidden attacks. While the existing tools and strategies of security are established on predefined methods and algorithms to identify intrusions, they don't have the ability to detect new threats. This pushes us to think about new methods and techniques that can evolve to disclose new menaces.
In addition, the data passing through the network is so large and can be of several types, which provoke difficulties related to threats detection time for the current devices of security. With the fast growth of the generated data like videos, sounds, emails, etc..., in all sectors, the old data management tools have become obsolete, they are not able to store or manage this large amount of data, as a consequence, a new concept was conceived called Big Data to define new rules for the management and storage of this large mass of data. Also, a collection of classification methods of the Machine Learning domain have appeared recently, and was associated with this newborn Big Data, in order to extract invisible information from it.
Therefore, to deal with issues cited above, we suggest in this paper a new idea to analyze and evaluate network traffic, based on collecting and storing its huge data employing big data techniques, and applying parallel processing of classification algorithms on these data, in order to detect new hidden attacks with less time consumption.
The study has the following structure, we give a summary of related work in Section 2, Section 3 is reserved for the proposed approach, experimental environment is described in Section 4, Section 5 is dedicated for results and analysis, section 6 announces the conclusion and future work.
2. RELATED WORKS
The idea of intrusion detection in a big data environment was debated in paper [1], the authors have shown that current research is not very interested in methods that can extract information about the anomalies found, and they affirmed that this information is very useful for reducing the time between the identification of the anomaly and the reaction. Using machine learning methods, they proposed a new method called multivariate big data analysis (MBDA) for intrusion detection, based on five stages, the first step is to transform the source data into quantitative characteristics, the second step is to create a single data flow from characteristics of multiple sources of data, the third step is to find the anomalies at the right moment, the fourth step is to identify the features of the anomaly, the fifth and last step is to detect and present the data causing the anomaly. The proposed idea is remarkable, except that the authors did not present how and why they used the machine learning methods.
Another concept for analyzing the big traffic of the network was discussed in paper [2], the authors confirmed that the network traffic is very large, which pushes to find new means able to detect threats with precision. They suggested a set of methods of analysis using R language to remedy problems related to the volume, veracity, and variety of large amounts of data. To test the proposed methods, they applied them on the KDD Cup 99 dataset [3], which is an earlier version of NSL KDD [4]. The proposed methods are interesting, except that they are oriented towards improving the quality of the large quantity of data and not an action against threats.
One more approach to detect anomalies in a telecommunication domain was debated by the authors in the manuscript [5], they admit that currently there is a large amount of the produced data by multiple devices, they proposed a new system based on four steps, firstly it collects data, secondly it prepares data before treatment, thirdly it applies an unsupervised clustering algorithm, finally it shows the found anomalies. The suggested system constitutes a new approach to visualize anomalies but it is not dedicated to detect new attacks.
In paper [6] , the authors discuss a new idea of reducing the time of detection of intrusions in Big Data environment, they claim that attacks increase as the quantity of produced data increases, also the large amount of data causes difficulties related to the duration of the analysis for intrusions detection, they proposed a new architecture based on a distributed streaming platform called Apache Kafka [7], and a component of Spark [8] used for data stream processing called Spark Streaming [9]. The model groups loading network traffic from CSV file, ingesting data using Kafka, processing data using Apache Spark Streaming. The experiment was realized and showed good results. The proposed idea represents a promising approach to reduce processing time in a big data environment, but the authors did not specify the used methods for intrusions detection.
In the same big data environment, another system to identify intrusion based on a method of statistics called finite Dirichlet mixture model was proposed in paper [10], the authors announced that a system that detects no threats per day is obsolete, they have set up a new framework composed of three components, the first component capture and log network data, the second component performs analysis and filtration operations to prepare the data for the next component, the third and last component is dedicated to apply Dirichlet mixture model method in order to detect intrusions. The system has been tested on two datasets NSL KDD [4] and UNSW-NB15 [11], the intrusion detection rates were high. The proposal constitutes a remarkable new approach for the detection of intrusions, although its performances have not been compared to that of the other methods. The system is not dedicated to evolve to detect new threats.
The authors expose, in the study [12], a new approach to analyze the big traffic of the network, they declare that the existing tools of security must analyze the collected data in order to evolve to catch threats, they suggested a distributed architecture in cloud computing area, for the purpose of exploiting the great capacity of storage and processing, the architecture is established on collecting traffic of the network, storing it, and analyzing it employing the famous parallel processing program MapReduce. The authors have not carried out experiments to validate the approach. Also, the idea is not scalable to detect new threats.
Our approach is totally different compared to the cited works. It focuses on detecting new hidden intrusions with less processing time, in an environment where the data is very large and varied.
3. PROPOSED APPROACH
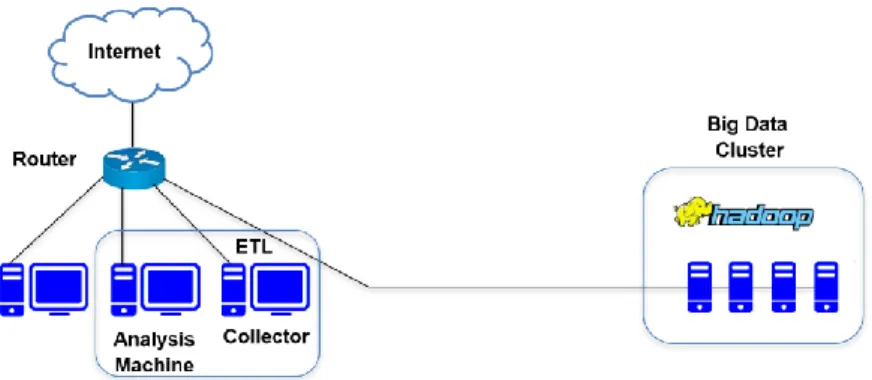
Our suggested approach is illustrated in Figure 1, it is an architecture of a local business network that is composed of four main components, namely, a collector, an extract-transform load (ETL), a big data cluster, and an analysis machine.
Figure 1. Big data and machine learning architecture for intrusion detection
3.1. Collector
The collector is a traffic listener, it is a software that collect the traffic passing through the network, it is installed on a network machine, it listens, captures, and saves network traffic on the same machine in order to load it to the big data cluster via the ETL.
3.2. Extract transform load (ETL)
An ETL is a software that aims to extract data from a source, transform it, then load it to a destination [13], so, it is installed on the same machine of the collector, it is responsible for loading the caught traffic from the network by the collector, to the big data cluster.
3.3. Big data cluster
Because of the large amount and variety of traffic data exchanged all the time between the local network and the Internet, we have set up a Big Data cluster. The two most used big data management frameworks are Hadoop [14] and Spark [8], they are composed of two components, the first called Hadoop distributed file system (HDFS) is reserved for storing data, the second is reserved for distributed processing of data via the MapReduce program [15]. We used Hadoop because it is more powerful than Spark in terms of data security [16].
3.4. Analysis machine
Due to the large amount and variety of data that can be collected across the network, it has become difficult to process them with the old analysis methods and tools of security [17], contrariwise, Machine Learning methods have the capacity to extract information hidden in this large volume and variety of data [18], that's why we will use them to process network traffic. So, the analysis machine is also a machine on the local network, on which we have installed software that will launch Machine Learning algorithms, in order to process the data already stored in the Big Data cluster.
4. EXPERIMENTAL ENVIRONMENT
In this part, we present the used methods for the analysis, the chosen data for the experimentation, the validation method, the evaluation metrics, and the work environment.
4.1. Analysis methods
There are several machine learning methods, so it's not easy to test them all, we tried to test only the most known and used of them, which are support vector machine (SVM) [19], K-nearest neighbors (KNN) [20], and decision tree [21].
Support vector machine (SVM): it is a machine learning method, which is intended to solve binary and multiple classification problems, it is based on margins, it takes few samples and it achieves good results [22].
K-nearest neighbors (KNN): it is an effective method of machine learning that is applied to classification and regression problems. To estimate the output associated with a new input X, (KNN) consists in taking into account the K training samples whose input is closest to the new input X [23].
Decision tree: it is a method of decision making and classification, the different decisions possible are located at the terminal nodes (which represent the leaves of the tree) and are obtained according to the decisions reached at each stage [24].
4.2. Dataset
To evaluate our approach, we chose the famous NSL KDD dataset [4], which is an advanced version of KDD Cup 99 [3]. NSL KDD gathers without redundancy network traffic data from a military environment, it is composed of normal and attack records, namely:
DoS (Denial-of-Service): This makes the service unavailable.
Probe: which tries to disclose information about a network and find system vulnerabilities. U2R (User to Root): which profit from vulnerabilities in the system to get super user privileges.
R2L (Remote to Local): which tries to attack a machine and causes vulnerabilities to obtain secure information.
Tables 1-3 represent the number of records for each type. Table 1 shows the distribution of the dataset in two classes. Table 2 shows the distribution of the dataset in five classes, and Table 3 shows the distribution of the dataset in twenty-three classes.
Table 1. Distribution of dataset in two classes Traffic Number of samples
Normal 67343 Attack 58630 Total 125973
Table 2. Distribution of dataset in five classes Traffic Number of samples Normal 67343 Attack
DoS 45927
Probe 11656
R2L 995
U2R 52
Total 125973
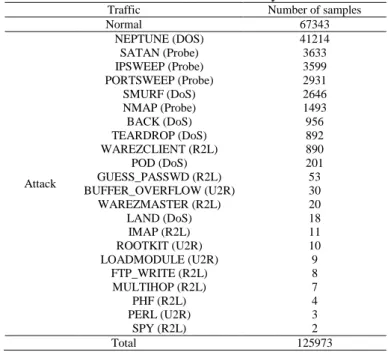
Table 3. Distribution of dataset in twenty-three classes Traffic Number of samples
Normal 67343
Attack
NEPTUNE (DOS) 41214 SATAN (Probe) 3633 IPSWEEP (Probe) 3599 PORTSWEEP (Probe) 2931
SMURF (DoS) 2646
NMAP (Probe) 1493
BACK (DoS) 956
TEARDROP (DoS) 892 WAREZCLIENT (R2L) 890
POD (DoS) 201
GUESS_PASSWD (R2L) 53 BUFFER_OVERFLOW (U2R) 30 WAREZMASTER (R2L) 20
LAND (DoS) 18
IMAP (R2L) 11
ROOTKIT (U2R) 10
LOADMODULE (U2R) 9
FTP_WRITE (R2L) 8
MULTIHOP (R2L) 7
PHF (R2L) 4
PERL (U2R) 3
SPY (R2L) 2
Total 125973
4.3. Validation method
To assess our model, we chose the cross-validation method, it is a technique that assesses the detection capacity of a classifier by dividing the data set into two subsets, the training subset and the test subset. Firstly, the classifier is trained on the training dataset, secondly, it is applied on the test dataset in order to measure its degree of success. The process is repeated N times independently,
the average of the N performances is returned. The strong point of this technique is that all data is used for training and testing, which makes the assessment more precise. We employed 5-fold cross validation to assess our approach, if we increase the N, the number of attacks for some types like R2L and U2R will decrease for each subset, and they may be neglected during processing [25].
4.4. Evaluation metrics
To assess the detection efficiency of our proposed algorithms, we choose the metrics accuracy, sensitivity, specificity, false positive rate (FPR) and area under curve (AUC), the definitions of these metrics are:
Accuracy = TP+TN/(TP+TN+FP+FN) (1)
It represents the fraction of true identification overall data instances.
Sensitivity = TP/(TP+FN) (2)
It is also called true positive rate (TPR), it measures the ratio of positive instances that are correctly classified.
Specificity = TN/(TN+FP) (3)
It measures the ratio of negative instances that are correctly classified.
False Positive Rate = FP/(FP+TN) (4)
It represents the probability of falsely rejecting the null hypothesis.
AUC is the probability that a randomly selected positive instance is ranked higher than a randomly selected negative instance. It is the measurement of the surface area under the receiver operating characteristic (ROC) curve which plots the true positive rate (TPR) against the false positive rate (FPR). TP, TN, FP and FN are extracted from the confusion matrix after the classification operation, they mean respectively, True Positive, True Negative, False Positive and False Negative.
True Positive (TP) indicates the number of instances correctly classified. False Positive (FP) indicates the number of instances incorrectly classified. True Negative (TN) indicates the number of instances correctly rejected. False Negative (FN) indicates the number of instances incorrectly rejected.
To assess the processing time, we use the training and validation time according to the number of nodes in the Big Data cluster.
4.5. Work environment
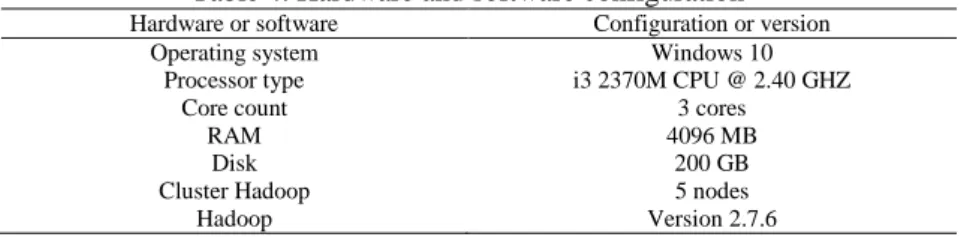
Table 4 summarizes our work environment, it presents the hardware and the software with the configuration or version.
Table 4. Hardware and software configuration Hardware or software Configuration or version
Operating system Windows 10
Processor type i3 2370M CPU @ 2.40 GHZ
Core count 3 cores
RAM 4096 MB
Disk 200 GB
Cluster Hadoop 5 nodes
Hadoop Version 2.7.6
5. RESULTS AND ANALYSIS
This part is reserved to present and discuss the different results obtained. We have assessed the approach according to the three distributions of the dataset NSL KDD as described above, so we carried out three types of classification, namely, classification of two classes, classification of five classes and classification of twenty-three classes. For 2-classes classification, the dataset is divided into two subsets, a subset of normal data and a subset of attack data. For 5-classes classification, the dataset is divided into five
subsets, one subset of normal data and four subsets of attack data, namely, U2R, R2L, Probe and DoS. For 23-classes classification, the dataset is divided into twenty-three subsets, one subset of normal data and twenty-two subsets of attack data derived also from U2R, R2L, Probe and DoS attacks.
Our experiments were carried out in several steps, at each step we increase the number of nodes constituting the big data cluster and we store our data there, we apply the machine learning classifiers in a distributed and parallel way on the big data cluster, then we calculate the indicators accuracy, specificity, sensitivity, false positive rate (FPR), area under curve (AUC), and the processing time, in order to evaluate the performances.
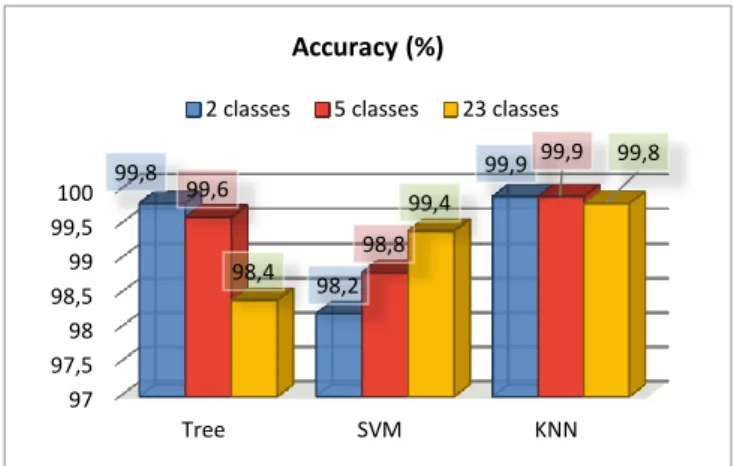
Figure 2 shows classification Accuracy for two classes, five classes and twenty-three classes. Table 5 shows classification metrics: sensitivity, specificity, AUC and FPR for two classes, five classes and twenty-three classes. While Figures 3 describes the evolution of the training and validation time of machine learning classifiers according to the number of nodes of the big data cluster.
Figure 2. Classification Accuracy of two classes, five classes and twenty-three classes
Table 5. Sensitivity, specificity, AUC and FPR of the classification of two classes, five classes and twenty-three classes
Classifier Distribution Sensitivity (%) Specificity (%) AUC (%) FPR (%) KNN
2 classes 100 100 100 0
5 classes 92,4 100 96,2 0
23 classes 77,7 100 88,78 0
SVM
2 classes 98,5 98,5 100 1,5
5 classes 88,6 99,8 99,8 0,2
23 classes 66,3 100 96,87 0
TREE
2 classes 0 0 0 100
5 classes 85 100 99,2 0
23 classes 47,22 99,96 97,39 0,04
As illustrated by Figure 2, the different values reached of accuracy for all machine learning classifiers are generally very high, the KNN algorithm is very efficient with accuracy values that reaches up to 99.9% for the classification of two classes, 99.9% for the classification of five classes, and 99.8% for the classification of the twenty three classes, which means that KNN is very powerful than SVM and decision tree for identifying each type of data whatever the data distribution. For the distribution in two classes and five classes, the data is not distributed in several classes; the decision tree is more accurate than SVM with accuracy percentages of 99.8% and 99.6% for the detection of respectively two and five classes, which means that decision tree is very efficient with less distributed data. For the distribution in twenty-three classes, the dataset is more distributed; the reached accuracy by SVM method is 99.4%, which explains that SVM is more precise for data with a high distribution.
Also, as shown by Table 5, the highest Sensitivity values are those of the KNN algorithm, 100% for the detection of two classes, 92.4% for the detection of five classes and 77.7% for the detection of twenty three classes, which means that KNN can correctly identify the nature of the data more than the both methods SVM and decision tree. The values of Sensitivity which are in second position are those of SVM with percentages of 98.5% for the identification of two classes, 88.6% for the identification of five classes,
97 97,5 98 98,5 99 99,5 100
Tree SVM KNN
99,8
98,2
99,9 99,6
98,8
99,9
98,4
99,4
99,8 Accuracy (%)
and 66.3% for the identification of twenty three classes, which proves that SVM can perfectly detect the type of data, more than the decision tree method. Effectively, the percentage of the false positive rate (FPR) noted by KNN is null for any type of classification, this explains that KNN can detect without error compared to the other classifiers. And also, the values achieved of the false positive rate (FPR) by SVM are only 1.5% for the detection of two classes, 0.2% for the detection of five classes and null for the detection of twenty-three classes, which means that SVM detects with less error than decision tree. We also notice that specificity values of KNN reach up to 100% for recognition of two classes, five classes and twenty-three classes, which means that KNN can perfectly detect negative instances more than the other methods.
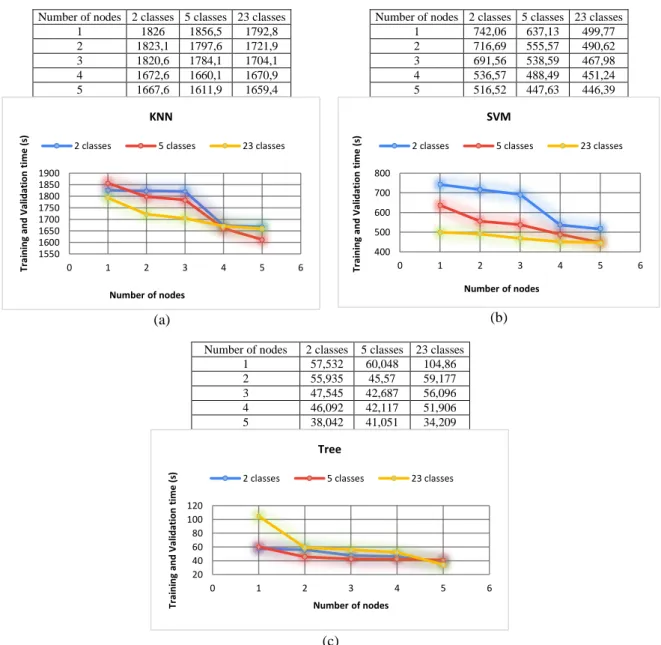
As represented by the Figure 3(a-c), the time processing of the algorithms decreases as the number of nodes in the cluster increases. In the case of a cluster with a single node, the training and validation time taken by KNN is 1826 s for the classification of two classes, 1856.5 s for the classification of five classes, and 1792.8 s for the classification of twenty three classes, these values decrease as long as the number of nodes of the cluster increases, until reaching only in the case of a cluster with a five node, 1667.6 s for the classification of two classes, 1611.9 s for the classification of five classes, and 1659.4 s for the classification of twenty three classes. We clearly notice the same evolution for the other two methods SVM and decision tree. Which justifies that parallel and distributed processing reduces effectively time consumption.
Number of nodes 2 classes 5 classes 23 classes 1 1826 1856,5 1792,8 2 1823,1 1797,6 1721,9 3 1820,6 1784,1 1704,1 4 1672,6 1660,1 1670,9 5 1667,6 1611,9 1659,4
(a)
Number of nodes 2 classes 5 classes 23 classes 1 742,06 637,13 499,77 2 716,69 555,57 490,62 3 691,56 538,59 467,98 4 536,57 488,49 451,24 5 516,52 447,63 446,39
(b) Number of nodes 2 classes 5 classes 23 classes
1 57,532 60,048 104,86 2 55,935 45,57 59,177 3 47,545 42,687 56,096 4 46,092 42,117 51,906 5 38,042 41,051 34,209
(c)
Figure 3. The evolution of training and validation time according to the number of nodes in the cluster (a) KNN, (b) SVM, (c) Tree
1550 1600 1650 1700 1750 1800 1850 1900
0 1 2 3 4 5 6
Tr ai ni ng a nd V al ida ti o n ti me (s )
Number of nodes
KNN
2 classes 5 classes 23 classes
400 500 600 700 800
0 1 2 3 4 5 6
Tr ai ni ng a nd V al ida ti o n ti me (s )
Number of nodes
SVM
2 classes 5 classes 23 classes
20 40 60 80 100 120
0 1 2 3 4 5 6
Tr ai ni ng a nd V al ida ti o n ti me (s )
Number of nodes
Tree
The experiments have proven that machine learning algorithms are very effective at detecting new hidden attacks and intrusions, and applying them in a parallel way in a distributed environment improves significantly time consumption.
6. CONCLUSION AND FUTURE WORK
In this study, we suggested a new approach established on the storage of the large volume and variety of network traffic data using big data techniques, and the analysis of these data using machine learning algorithms in a distributed and parallel way, in order to detect new hidden intrusions with less time consumption. To prove the validity of our approach, a big data cluster has been set up, the popular NSL KDD was chosen as dataset for the evaluation. The assessment was carried out following several steps, at each step, the number of nodes in the big data cluster is increased, the NSL KDD is stored in the big data cluster, the machine learning algorithms are applied for the analysis, and then the evaluation metrics are calculated. To support the validity of our proposal, the experiments results shown that the machine learning methods are very effective to sensing intrusion and their application in a parallel and distributed way reduces considerably time consumption. In the future, we will try to implement really a new intrusion detection system (IDS) using our new distributed approach.
REFERENCES
[1] J. Camacho, et al., “Multivariate Big Data Analysis for intrusion detection: 5 steps from the haystack to the needle”, Comput. Secur., vol. 87, p. 101603, nov. 2019.
[2] L. Wang, et al., “Big Data Analytics in Cyber Security: Network Traffic and Attacks”, J.C.I.S., p.1‑8, 2020. [3] “KDD Cup 1999 Data”. http://kdd.ics.uci.edu/databases/kddcup99/kddcup99.html
[4] “NSL-KDD Dataset”. https://github.com/defcom17/NSL_KDD
[5] V. K. Vasantham, et al., “User-Anomaly Detection in Telecommunication Using Big Data Analytics”, vol. 7, no 5, p. 4, 2019.
[6] M. T. Tun, et al., “Performance Evaluation of Intrusion Detection Streaming Transactions Using Apache Kafka and Spark Streaming”, in ICAIT 2019, Yangon, Myanmar, Nov. 2019, p. 25‑30.
[7] “Apache Kafka”, Apache Kafka. http://kafka.apache.org/. [8] “Apache Spark”. https://spark.apache.org/.
[9] “Spark Streaming”. https://spark.apache.org/docs/latest/streaming-programming-guide.html
[10] N. Moustafa, et al., “Big Data Analytics for Intrusion Detection System: Statistical Decision-Making Using Finite Dirichlet Mixture Models”, in DADSC, Springer International Publishing, 2017, p. 127‑156.
[11] “UNSW-NB15”.www.unsw.adfa.edu.au/unsw-canberra-cyber/cybersecurity/ADFA-NB15-Datasets/
[12] L. U. Laboshin, et al., “The Big Data Approach to Collecting and Analyzing Traffic Data in Large Scale Networks”, Procedia Comput. Sci., vol. 103, p. 536‑542, 2017.
[13] S. K. Bansal, et al., “Integrating Big Data: A Semantic Extract-Transform-Load Framework”, Computer, vol. 48, no 3, p. 42‑50, mars 2015.
[14] “Apache Hadoop”. https://hadoop.apache.org/.
[15] A. Boukhalfa, et al., “A Honey Net, Big Data and RNN Architecture for Automatic Security Monitoring of Information System”, in (AI2SD’2018), vol. 915, Springer International Publishing, 2019, p. 800‑808.
[16] I. Mavridis, et al., “Performance evaluation of cloud-based log file analysis with Apache Hadoop and Apache Spark”, J. Syst. Softw., vol. 125, p. 133‑151, mars 2017.
[17] A. Boukhalfa, et al, “Network Traffic Analysis using Big Data and Deep Learning Techniques”, in (ICOA 2020), 2020, p. 1‑4.
[18] L. Zhou, et al., “Machine learning on big data: Opportunities and challenges”, Neurocomputing, vol. 237, p. 350‑361, mai 2017.
[19] B. M. Aslahi-Shahri et al., “A hybrid method consisting of GA and SVM for intrusion detection system”, Neural Comput. Appl., vol. 27, no 6, p. 1669‑1676, août 2016.
[20] N. Sameera, et al., “Encoding Approach for Intrusion Detection Using PCA and KNN Classifier”, in ICCII 2020, Singapore, 2020, p. 187‑199.
[21] J. Esmaily, et al., “Intrusion detection system based on Multi-Layer Perceptron Neural Networks and Decision Tree”, in 2015 7th Conference on (IKT), Iran, mai 2015, p. 1‑5.
[22] “SVM”.https://www.sciencedirect.com/topics/computer-science/support-vector-machine
[23] W. Li, et al., “A New Intrusion Detection System Based on KNN Classification Algorithm in Wireless Sensor Network”, J. Electr. Comput. Eng., vol. 2014, p. 1‑8, 2014.
[24] S. Sahu et B. M. Mehtre, “Network intrusion detection system using J48 Decision Tree”, in 2015 (ICACCI), Kochi, India, août 2015, p. 2023‑2026.
[25] A. Boukhalfa, et al., “LSTM deep learning method for network intrusion detection system”, International Journal of Electrical and Computer Engineering (IJECE), vol. 10, no 3, p. 3315, 2020.