CONTRIBUTIONS FROM THE SCHOOL THAT INFLUENCE STUDENT ACHIEVEMENT: DIFFERENCES IN TEACHERS’ PERCEPTIONS
Erica Nicole Pollock
A dissertation submitted to the faculty at the University of North Carolina at Chapel Hill in partial fulfillment of the requirements for the degree of Doctor of Philosophy in the School of
Education (School Psychology).
Chapel Hill 2019
Approved by: Steven E. Knotek
Candace H. Boan-Lenzo Eric A. Houck
ABSTRACT
Erica Nicole Pollock: Contributions from the School that Influence Student Achievement: Differences in Teachers’ Perceptions
(Under the direction of Steven E. Knotek)
A substantial body of research has examined student achievement over the years. Though this research is vast, there is no indication that the findings are being used in schools and
classrooms. Hence, there is concern regarding the research to practice gap in schools. Due to the unique opportunity teachers have to impact student achievement, their knowledge of and
perceptions related to the factors that influence student achievement are important. When teachers’ perceptions align with the research findings, students may be educated in the most effective manner possible. The primary purpose of this study was to determine whether teachers’ perceptions, of the effects of school factors on student achievement, are significantly discrepant from the research, differ as a function of demographic characteristics, and which demographic characteristics predict perception alignment with current research findings. Understanding differences in teachers’ perceptions is crucial to designing and implementing evidence-based interventions, acquiring teacher support, and addressing their concerns as key stakeholders.
Participants were solicited from teacher organizations willing to participate in a web-based survey to measure teachers’ perceptions of factors that influence student academic
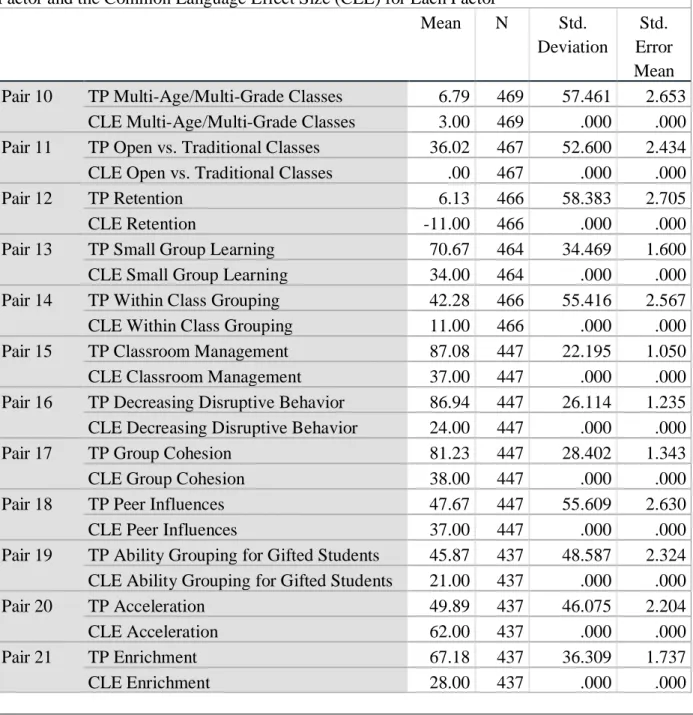
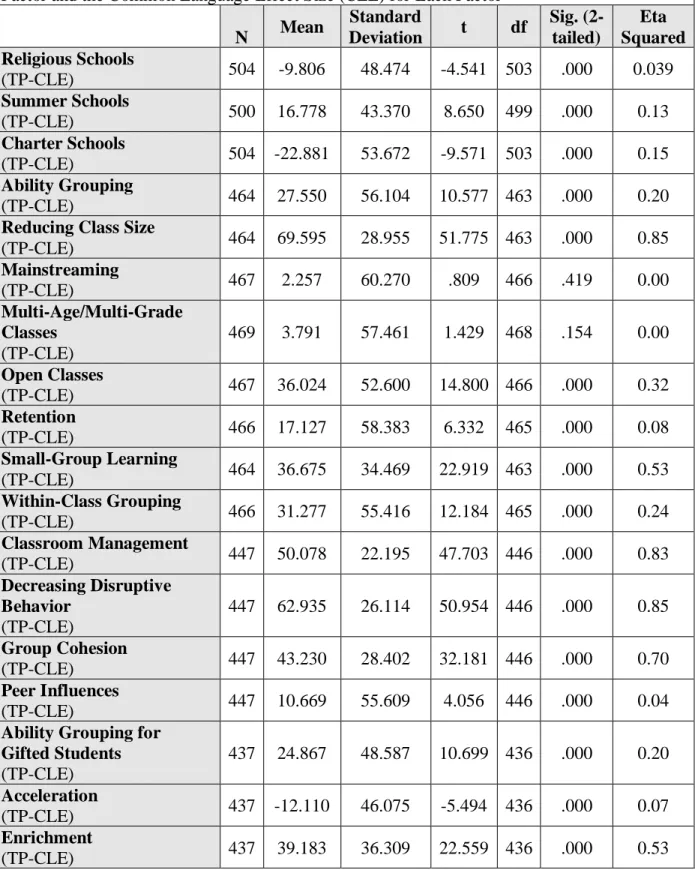
Paired-samples t-tests indicated a statistically significant difference between teachers’ perceptions and current research findings for all of the school factors examined (p=0.000) except for mainstreaming (p=0.419) and multi-age/multi-grade classes (p=0.154). Teacher perception alignment with current research was greatest for the mainstreaming factor (M=2.26) and least for the reducing class size factor (M=69.60). Hierarchical multiple regression demonstrated a
TABLE OF CONTENTS
LIST OF TABLES ... viii
LIST OF FIGURES ... x
LIST OF ABBREVIATIONS AND SYMBOLS ... xi
CHAPTER 1: INTRODUCTION ... 1
CHAPTER 2: LITERATURE REVIEW... 8
Demographic Characteristics ... 8
Characteristics of the teachers... 8
Characteristics of the schools where teachers work... 12
Contributions from the School ... 14
School compositional effects. ... 17
Leadership. ... 20
Classroom compositional effects. ... 21
School curriculum effects. ... 26
Classroom influences. ... 28
Summary of school contributions. ... 30
CHAPTER 3: STATEMENT OF PURPOSE ... 32
CHAPTER 4: METHODS ... 34
Materials... 36
Demographic information. ... 36
Perceptions of influence. ... 37
Procedure ... 37
CHAPTER 5: DATA ANALYSIS ... 39
Analysis for Research Question 1: ... 42
Analysis for Research Question 2 ... 43
Analysis for Research Question 3 ... 44
CHAPTER 6: RESULTS ... 46
Research Question 1 ... 50
Research Question 2 ... 64
Research Question 3 ... 70
CHAPTER 7: DISCUSSION ... 71
Research Question 1 ... 72
Research Question 2 ... 74
Research Question 3 ... 74
Practical Implications ... 75
CHAPTER 8: LIMITATIONS ... 77
CHAPTER 9: DIRECTIONS FOR FUTURE RESEARCH ... 78
APPENDIX 1: COMMON LANGUAGE EFFECT SIZES ... 80
APPENDIX 2: LIST OF VARIABLES... 81
LIST OF TABLES
Table 1: Regions of the United States as defined by U.S. Census Bureau ... 39
Table 2: Hierarchical Multiple Regression Block Order ... 43
Table 3: Distribution of Sex of Participants ... 46
Table 4: Distribution of Race of Participants ... 46
Table 5: Distribution of Highest Degree Earned for Participants ... 47
Table 6: Distribution of the Region Where Highest Degree was Earned for Participants ... 47
Table 7: Distribution of Education Services Provided for Participants ... 47
Table 8: Distribution of Nationally Certified for Participants ... 48
Table 9: Distribution of Region Where Currently Teach for Participants ... 48
Table 10: Distribution of Community Type for Participants ... 48
Table 11: Distribution of Title 1 School Status for Participants ... 49
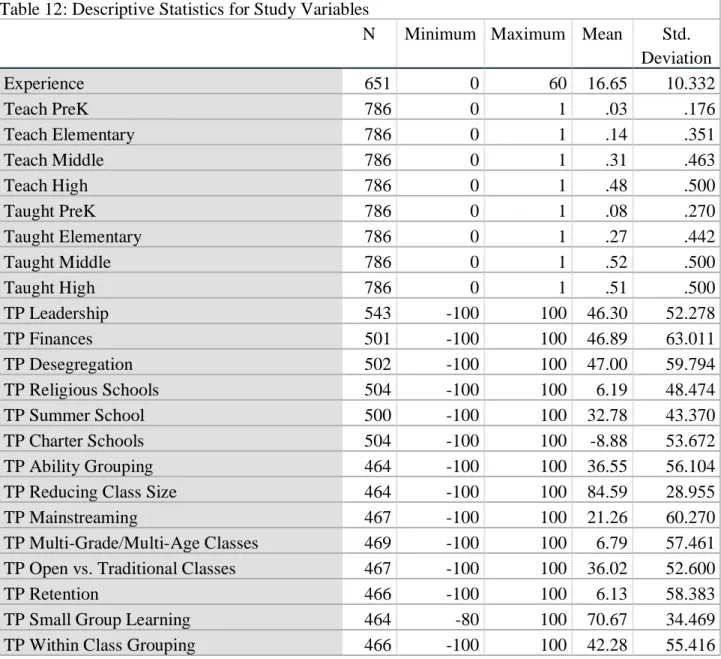
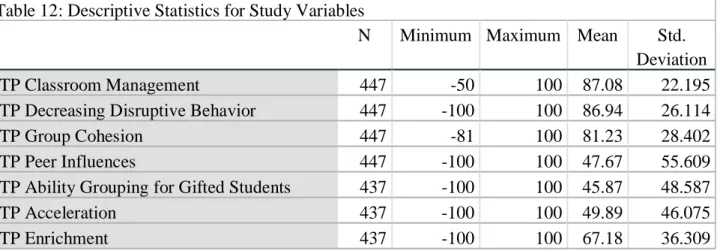
Table 12: Descriptive Statistics for Study Variables ... 49
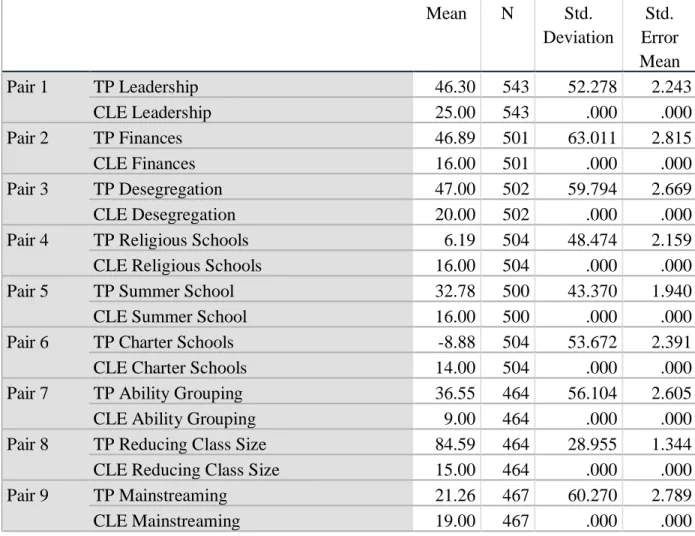
Table 13: Paired Samples Statistics for Teachers’ Perceptions (TP) of the Influence of Each Factor and the Common Language Effect Size (CLE) for Each Factor ... 51
Table 14: Paired-Samples T-Test for Teachers’ Perceptions (TP) of the Influence of Each Factor and the Common Language Effect Size (CLE) for Each Factor ... 52
Table 15: Descriptive Statistics for Regression Variables for the Religious Schools Factor ... 56
Table 16: Model Summary for Prediction of Teacher Perception Alignment for the Religious Schools Factor ... 57
Table 18: Regression Coefficients for Teacher Perception Alignment
for the Religious Schools Factor ... 58
Table 19: Descriptive Statistics for Regression Variables for the Charter Schools Factor ... 61
Table 20: Model Summary for Prediction of Teacher Perception Alignment for the Charter Schools Factor ... 62
Table 21: ANOVA Model for Prediction of Teacher Perception Alignment for the Charter Schools Factor ... 62
Table 22: Regression Coefficients for Teacher Perception Alignment for the Charter Schools Factor ... 63
Table 23: Descriptive Statistics for Regression Variables for Average Overall Teacher Perception Alignment ... 65
Table 24: Model Summary for Prediction of Overall Teacher Perception Alignment ... 67
Table 25: ANOVA Model for Prediction of Overall Teacher Perception Alignment ... 68
LIST OF FIGURES
LIST OF ABBREVIATIONS AND SYMBOLS
Avg. Average
Beta Coefficient
c2 Chi-Square Value
CLE Common Language Effect
d Cohen’s d
M Mean
N Number of cases
p P-Value
r Correlation Coefficient
SPSS Statistical Package for the Social Sciences
Std. Standard
CHAPTER 1: INTRODUCTION
In his UNICEF appeal given on July 25, 1963, John F. Kennedy stated “Children are the world's most valuable resource and its best hope for the future.” This quote will forever remain true. Therefore, it is incumbent upon the world to ensure our children receive the best
preparation possible. Educating our children and adolescents is vital to this goal. As researchers have thoroughly demonstrated, the academic achievement of students is positively correlated with superior decision-making, civic participation, income, tax revenue, health, life expectancy, and quality-of-life of offspring (Baum & Ma, 2007; Cutler & Lleras-Muney, 2007; Smith & Holcombe, 2011; The NHHEAF Network Organizations, 2013). Conversely, student
achievement has been negatively correlated with smoking, obesity, unemployment rates, poverty, and incarceration rates (Baum & Ma, 2007; Rosengren, 2013; Smith & Holcombe, 2011; The NHHEAF Network Organizations, 2013).
Previous researchers around the globe have recognized the importance of educating our young people. They have worked diligently to identify what factors influence academic
leaders and active, dedicated citizens. Throughout this educational research, student achievement has been primarily defined as the degree to which a student achieves established educational goals. Academic achievement is usually measured by standardized tests, curriculum based assessments, and grade point averages with regard to the academic skill areas of reading, writing, and math.
One researcher provided a unique synthesis of the current research on the factors that influence student achievement. John Hattie (2009) reviewed over 800 meta-analyses associated with student academic achievement and synthesized the information in a practical and intelligible manner. He organized the relevant research findings into six categories: (1) Contributions from the Teacher, (2) Contributions from the Curriculum, (3) Contributions from Teaching
Approaches, (4) Contributions from the Child, (5) Contributions from the Home, and (6) Contributions from the School.
For each factor identified as influencing student achievement, Hattie (2009) determined an overall effect size, using both the standard Cohen’s d and the common language effect (CLE) size indicator created by McGraw and Wong (1992). As described by Hattie, the common language effect (CLE) is “the probability that a score sampled from one distribution will be
greater than a score sampled from some other distribution” (p. 9). Hattie (2009) further explained:
Consider as an example the difference in height of the average woman
two classes, the one using homework will be more effective 21 out of 100 times. (p. 9)
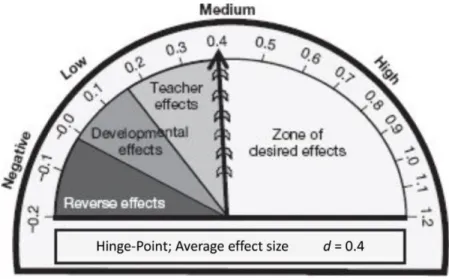
Hattie used both Cohen’s d and the common language effect (CLE) size indicator to promote understanding for both educational researchers and school personnel alike. One of Hattie’s goals was to decrease the research to practice gap in schools. Moreover, because the effect sizes in education research studies tend to be positive and give the appearance that everything that we do in classrooms works, Hattie developed a hinge-point or benchmark for comparing each effect size or CLE. This hinge-point functions an indicator of real-world difference. John Hattie developed this hinge-point based on his exhaustive review of the current literature.
Prior educational research established that effect sizes of d = 0.0 to 0.15 can be ascribed to simple maturation of the students (Cahan & Davis, 1987 as cited in Hattie, 2009). Therefore, Hattie identified effect sizes of d = 0.15 and lower to be educationally harmful because they suggest no academic achievement beyond that of intellectual maturation, without any schooling. Additionally, teachers typically achieve small to medium effect sizes (d=0.20 to 0.40) in an academic year. Finally, Hattie identified a medium to large effect size (d=0.40 or greater) as the hinge-point or benchmark for a variable to have an above average impact on academic
Figure 1: Illustration of John Hattie’s Hinge-Point
As a result of Hattie’s (2009) comprehensive approach to evaluating the existing
literature, we have a better understanding of what actually impacts student learning. In spite of this, we do not have a clear picture of whether teachers recognize the level of influence each of these factors has on student achievement. Pollock’s (2015) research indicated a discrepancy between teacher perceptions and research findings, though the homogeneity of the participants greatly limited the generalizability of the findings. The descriptive study showed that teachers did not accurately discern which factors actually “influence student achievement in a
demonstrated difficulty accurately determining which factors had greater influence on student achievement than others within each category when answering rank order questions.
Teachers have a significant opportunity to influence student achievement, as their contributions were shown to have the greatest impact on student achievement (d = 0.49; CLE = 35%) of the 6 categories (Hattie 2009). As key stakeholders in education, it is important for teachers to recognize and differentiate between effective and ineffective initiatives. Part of this recognition and differentiation ability involves understanding what factors influence student achievement and what level of effect each factor has on academic achievement. Based on implementation science, initiatives and innovations target these factors because they act as malleable mediators to student achievement. Therefore, when teachers’ perceptions regarding the influence of these factors on student achievement align with research, they are able to distinguish which initiative and innovations will most effectively enhance student performance and
academic achievement.
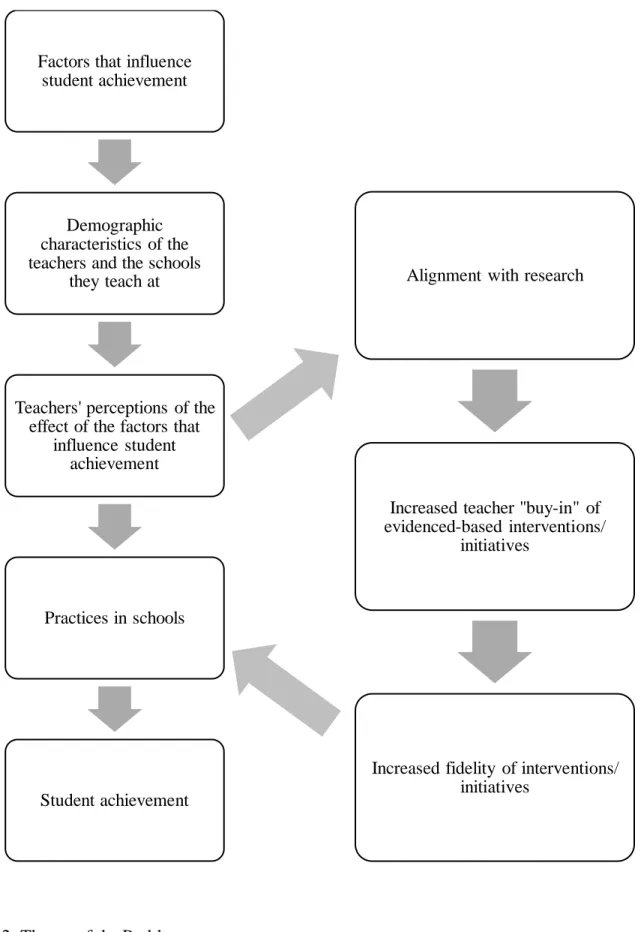
In addition to the limited knowledge regarding teachers’ perceptions about the degree of influence each factor has on student achievement, researchers have not examined how teachers’ perspectives of these factors differ as a function of the teachers’ sex, race, educational degree, where degree was earned, national certification status, years of experience, type of school employed by, grade(s) taught, services provided, school location, and school Title 1 status. This information is needed in order to design interventions to help align teachers’ perceptions with current research findings, improve support for evidenced-based practice, enhance teachers’ abilities to identify effective and ineffective initiatives, and address teacher concerns (See Figure 2). As such, the purpose of this study is to examine whether differences exist, as a function of demographic characteristics, in teachers’ perceptions of what effect each factor (identified by Hattie within the Contribution of the School) has on student achievement outcomes. The study also aims to determine which teacher and school demographic characteristics predict perception alignment with the research. It is hypothesized that the demographic characteristics of the teachers and the schools they work in are the malleable mediators of teacher perceptions (of the factors that influence student achievement) and perception alignment with current research findings. The subsequent review of the literature will examine demographic characteristics related to the teachers and the schools they teach at, review Hattie’s results with regard to
Figure 2: Theory of the Problem Factors that influence
student achievement
Demographic characteristics of the teachers and the schools
they teach at
Teachers' perceptions of the effect of the factors that
influence student achievement
Practices in schools
Student achievement
Alignment with research
Increased teacher "buy-in" of evidenced-based interventions/
initiatives
CHAPTER 2: LITERATURE REVIEW
Demographic Characteristics
Characteristics of the teachers. Previous research has shown teacher perception regarding a variety of educational topics differ as a function of various characteristics of the teachers. Differences in teachers’ perceptions as a function of the sex of the teacher include but are not limited to the following topics: school environment, technological pedagogical content knowledge, and students’ temperament, educational competence, and teachability. Huang and Fraser (2009) discovered differences between male teachers and female Taiwan science teachers in their perceptions of school environment. Female science teachers in this study perceived greater collegiality among teachers, higher gender equity among students, and stronger professional interests. Conversely, male science teachers in the study perceived lower work pressure and better student-teacher relationships (Huang & Fraser, 2009). Mullola (2012) and colleagues found that teachers’ perceptions of students’ temperament, educational competence, and teachability varied as a function of teachers’ gender and age, in addition to the gender of students. Other researchers found relationships between science teachers’ perceptions of technological pedagogical content knowledge and the teacher demographic characteristics of teaching experience, gender, and age (Lin, Tsai, Chai, & Lee, 2013).
white achievement gap and social promotion (Uhlenberg & Brown, 2002). Additionally, racial differences have been uncovered for teachers’ perceptions of students based on the race or ethnicity of the students (McGrady & Reynolds, 2013; Morris, 2005).
Teaching experience has been shown to influence teachers’ perceptions regarding the following topics: challenging student behavior, ways to teach reading, technological pedagogical content knowledge, ability grouping, and retention. Alter, Walker, and Landers (2013)
discovered that teachers’ perceptions of challenging behaviors differed based on teacher gender, grade level taught, and years teaching. Other researchers found differences in teacher preferences related to ways to teach reading based on years of teaching experience (Giles & Tunks, 2015). As previous discussed, the work of Lin, Tsai, Chai, and Lee (2013) revealed relationships between science teachers’ perceptions of technological pedagogical content knowledge and the teacher demographic characteristics of teaching experience, gender, and age. Ireson and Hallam (2001; 2003) found teacher views regarding ability grouping varied based on teacher experience and subject area taught.
challenging behaviors differed as a function of teacher gender, grade level taught, and years of teaching experience.
Research has also demonstrated teachers’ perceptions related to the following topics vary based the type of education services provided by teachers: views of their own efficacy, ability, understanding, and resources. Buell, Hallam, Gamel-Mccormick, and Scheer (1999) found that general education and special education teachers differ in their views of their own efficacy, ability, understanding, and resources. Special education teachers rated themselves higher across the areas assessed than the general education teachers. Additionally, Troia and Maddox (2004) discovered that both special and general educators were strongly influenced by their teaching context.
National certification status was found to be related to teacher perceptions and actions regarding the incorporation of developmental appropriate practices, retention, and mobility. McKenzie (2013) discovered that national board certified teachers perceived they used
developmentally appropriate practices more frequently than did teachers who were not national board certified. Another researcher’s work revealed that teacher perceptions of retention varied as a function of experience and certification (Okpala, 2007). Moreover, Goldhaber and Hansen’s (2009) work with North Carolina teachers showed that national board certified teachers are more likely to leave the North Carolina School System and high-minority schools than non-national board certified teachers.
As demonstrated in the paragraphs above, teachers’ perceptions have been shown to differ as a function of their individual characteristics. Therefore, it is reasonable to hypothesize these perception differences based on individual characteristics will also exist when examining their views related to the factors influencing student achievement.
Characteristics of the schools where teachers work. Researchers have discovered teachers’ perceptions regarding a variety of topics and their actions vary based on characteristics of the schools they work in. Additionally, the types of teachers who work in a school have also been shown to vary based on school characteristics. Teachers’ perceptions were found to vary on the following topics based on the type of school in which they teach: autonomy, satisfaction, and collective faculty trust. Oberfield (2016) observed that charter school teachers perceived greater autonomy than public school teachers. Researchers Renzulli, Parrott, and Beattie (2011)
discovered that charter school teachers had greater satisfaction than traditional public school teachers due to greater autonomy. Though, charter school teachers were also more likely to leave the teaching profession than public school teachers. The work of McDaniel (2014) revealed that, of teachers with experience in both traditional public and charter schools, teachers perceived higher levels of collective faculty trust in charter schools compared to traditional public schools. Furthermore, charter schools were shown to typically hire more teachers from competitive undergraduate colleges than traditional public schools (Baker & Dickerson, 2006).
study, Stitchter and colleagues discovered differences between Title 1 teachers and non-Title 1 teachers in their use of opportunities to respond components for classroom management (Stichter, Lewis, Whittaker, Richter, Johnson, & Trussell, 2009). Title 1 teachers gave more negative verbal prompting and feedback. The Title 1 teachers also had smaller positive-to-negative-feedback ratios. Furthermore, researchers in a separate study found differences in the use of antecedent instructional practices between teachers in Title 1 and non-Title 1 schools (Stichter, Stormont, Lewis, & Schultz, 2009).
and Garcia (2012) also found regional differences in Texas elementary school teachers’ attitude towards their students use code-switching in communication.
As demonstrated in the paragraphs above, teachers’ perceptions have been shown to differ based on the characteristics of the schools they teach in. Therefore, it is reasonable to hypothesize these perception differences based on school characteristics will also exist when examining teachers’ views related to the factors influencing student achievement.
Contributions from the School
Characteristics of the school that have been examined by educational researchers in relation to student academic achievement were organized by Hattie (2009) into the Contributions from the School category. These factors include attributes of the schools, school compositional effects, leadership, classroom compositional effects, school curriculum effects, and classroom influences. (See Appendix 1 for d and CLE values.)
Attributes of the schools. Attributes of the schools are comprised of school finances (d = 0.23; CLE = 16%) and types of schools (Hattie, 2009). School finances refer to the monetary resources available to a school and its students. Research has suggested that there is a significant positive correlation between school finances and student achievement (Cullen, Polnick, Robles-piña, & Slate, 2015; Drummond, 2010; Jackson, Johnson, & Persico, 2016; Jensen, 1984; Loubert, 2008; Miller-Whitehead, 2000; Tin-Chun 2010). However, Hanusek (2016) found that the amount of money spent is not significant in relation to student achievement, but rather how the money is spent significantly impacts student achievement. Hanusek (2013) stated that “the most promising school finance policies and institutions are ones that promote higher
finance structure. Hanusek also stressed the importance of the three interrelated institutional policies: promoting competition, autonomy in local decision making, and an accountability system.
One previous research study showed that only 25-26 percent of teachers believed that monetary rewards for teachers based on either individual performance or school-wide
performance would have a strong impact on academic achievement (Scholastic & The Bill & Melinda Gates Foundation, 2012). However, the teachers expressed a need for tangible resources for students with behavioral issues, gifted students, students living in poverty, special education students, and English Language Learner (ELL) students in order to improve academic
achievement (Scholastic & The Bill & Melinda Gates Foundation, 2012). Overall, through his synthesis of the literature, Hattie (2009) determined that school finances had a small positive effect on student academic achievement.
Desegregation (d = 0.28; CLE = 20%), religious schools (d = 0.23; CLE = 16%), summer schools (d = 0.23; CLE = 16%), and charter schools (d = 0.20; CLE = 14%) make up the
increases parent involvement in schools. Caldas, Bankston, and Cain (2007) found that 60 percent teachers in Lafayette, Louisiana believed that African American students would benefit from desegregation, while 11 percent believed that Caucasians students would be negatively impacted by desegregation. Additionally, 40 percent of teachers felt that desegregation had increased discipline problems in their schools (Caldas, Bankston, and Cain, 2007). Hattie (2009) determined that desegregation had a small positive effect on student achievement. The effect of desegregation on student achievement may be due to the increased opportunities provided (Hattie, 2009).
Religious schools are private schools run by a religious body. Studies have demonstrated that attending a religious school has a significant positive influence on student achievement (Jeynes, 2002). When compared to charter schools and public schools, students of private schools had greater academic achievement (Jeynes, 2012). Furthermore, African American children, Hispanic children, and children of low socioeconomic status achieved higher academic performance in religious schools than in public schools (Jeynes, 2002). Researchers have not examined teachers’ perceptions of the influence of religious schools on student achievement. Hattie’s (2009) synthesis demonstrated that religious schools had a small positive effect on student achievement. The central argument for the effectiveness of religious schools is that “these schools provide a safe and structured environment and academic rigor that leads to high levels of academic achievement for children placed at risk” (Fenzel, 2013, pp. 128).
Additionally, the extended day and year of these schools provides needed support to assist students in advancing their academic skills (Fenzel, 2013).
positive influence on student achievement and help to prevent academic losses during the summer (Garland, & Garland, 2006; Koop, 2010; Zvoch, & Stevens, 2015). Research analyzing teachers’ perspectives of the influence of summer school on student achievement has not been published. Overall, John Hattie (2009) found that summer school had a small positive effect on student achievement. Summer school is thought to improve student achievement “by providing more educational time for enrichment activities or for remedial education for children falling behind” (Matsudaira, 2013, pp. 164).
Charter schools are publically funded independent schools established under a charter with a local or national authority. Some educational researchers have shown that there is no difference in student achievement between charter schools and public schools (Bettinger, 2005; Hanushek Kain, Rivkin, & Branch, 2007). Other educational studies have shown that charter school students score higher on mathematics standardized achievement tests and some students show more rapids growth than public school students (Xiang & Tarasawa, 2015). However, researchers have yet to analyze teachers’ views regarding the impact of charter schools on student achievement. Hattie (2009) concluded that charter schools had a small positive effect on student achievement. Due to less bureaucracy than traditional public schools, charter schools are thought to have more freedom to respond to the needs of students and provide greater
opportunities for parent and student engagement with the school. Additionally, charter schools are seen as a potential venue to try innovative educational practices that could be later used in traditional public schools (Allen, 2013).
-24%). For the purpose of this research, school size is defined as the number of students attending a school. Research findings have been inconsistent when examining the effect of school size on student achievement (Luyten, Hendriks, & Scheerens, 2014). Crispin (2016) have found that students benefit from small and large schools, with their findings regarding this relationship being U-shaped. Other researchers have found that reading and math achievement decrease as school size increases (Egalite & Kisida, 2016). However, educational researchers have not examined teachers’ perceptions of the influence of school size on student achievement. Overall, Hattie determined that school size had a medium positive effect on student achievement. This effect may be due to increased teacher collaboration, team teaching, and teacher input in decisions impacting their work, for schools with between 600 to 900 students. Additionally, schools with 600 to 900 students offered strong core curriculum to all students, with less use of electives to dilute the curriculum (Hattie, 2009).
Kiyici, 2015). Based on his compilation of the literature, Hattie (2009) concluded that out-of-school experiences have a very small positive effect on student achievement. Out-of-out-of-school experiences are thought to supplement and increase students’ knowledge and skills learned in the classroom (Dillon, 2013).
Summer vacation refers to the time in which students do not attend school in the summer months. Studies have indicated that students may gain some reasoning skills but lose some academic skills during summer vacation (Nelson, 1929; Parsley & Powell, 1962). Other researchers have discovered decreases in mathematics problem solving ability and spelling accompanied by gains in reading ability as a result of summer vacation (Paechter et al., 2015). Helf, Konrad, and Algozzine (2008) also found student gains in reading over the summer
vacation. Furthermore, only 31 percent of teachers surveyed thought that having a longer school year would have a positive impact on improving academic achievement (Scholastic & The Bill & Melinda Gates Foundation, 2012). Overall, Hattie (2009) determined that summer vacation had a very small negative effect on student achievement. Proponents of shortening summer vacation argue that “children learn best when learning is continuous, and the break means significant time needs to be spent reviewing previous material in order for learning to commence again” (Hattie, 2009, pp. 81).
often seen as an inconvenience to the teachers (Costley, 2012). John Hattie’s (2009) compilation showed that student mobility had a small negative effect on student achievement. It is thought that the instability related to student mobility negatively impacts students and teachers, as both parties need to adjust to new expectations with limited, if any, prior notice (Rose & Bradshaw, 2013).
Leadership. Leadership (d = 0.36; CLE = 25%) refers to the instructional and transformational leadership of the principals and other leaders of a school. Instructional
Classroom compositional effects. The classroom compositional effect category is comprised of small-group learning (d = 0.49; CLE = 34%), mainstreaming (d = 0.28; CLE = 19%), class size (d = 0.21; CLE = 15%), within-class grouping (d = 0.16; CLE = 11%), ability grouping (d = 0.12; CLE = 9%), multi-grade/multi-age classes (d = 0.04; CLE = 3%), open vs. traditional (d = 0.01; CLE = 0%), retention (d = -0.16; CLE = -11%), and single-sex classes. Small-group learning occurs when students are assigned to work in a small group to complete a task. This small-group learning is thought to promote cooperative learning, persistence, and self-esteem (Hattie, 2009). Participation in small-group learning has been shown to have a positive impact on student achievement (Barakat, 2005; Kamp, Dolmans, van Berkel, Henk & Schmidt, 2012). This positive effect on achievement extends into upper-level college courses (Gaudet, Ramer, Nakonechny, Cragg, & Ramer, 2010). However, no published research has examined teachers’ perceptions of the influence of small group learning on student achievement. Hattie’s (2009) synthesis found that small group learning had a medium positive effect on student achievement.
Mainstreaming refers to the practice of placing students with learning disabilities in regular education classrooms to provide the least restrictive environment for the students. The argument for mainstreaming has focused primarily on equity and social justice, rather than optimal academic achievement (Lindsay, 2013; Hattie, 2009). Due to the broad scope of
demonstrated that mainstreaming students with learning disabilities has a positive influence on student achievement (Madden & Slavin, 1982; Mitchell, 2010). Not only did mainstreaming have a positive impact on achievement, mainstreamed students also benefitted from improved social skills (Oh-Young & Filler, 2015). Furthermore, the achievement of non-disabled peers was not significantly impacted by the mainstreaming of their disabled peers (Sermier
Dessemontet & Bless, 2013).
In regard to teachers’ perceptions of mainstreaming, one study found that 47.5 percent, of the 138 Greek teacher participants, opposed the inclusion of students with complex learning disabilities in the general education classroom (Coutsocostas & Alborz, 2010). However, Monsen and Frederickson (2004) found that students of teachers with highly positive attitudes toward mainstreaming reported significantly higher classroom satisfaction and marginally lower classroom friction. As a result of his extensive review of the scientific literature, Hattie (2009) determined that mainstreaming had a small positive effect on student achievement.
Class size refers to the number of students in a given class. Studies have suggested that class size has an impact on student achievement, although the studies are inconsistent as to whether smaller or larger classes are preferable for students (De Paola, Ponzo, & Scoppa, 2013; Maples, 2009). Lower performing students benefitted the most from class size reduction
their classrooms would academic achievement be negatively impacted (Scholastic & The Bill & Melinda Gates Foundation, 2012). Overall, Hattie (2009) concluded that class size had a small positive effect on student achievement. The primary argument related to the effect of class size on student achievement states that: “reducing class size leads to more individualized instruction, higher quality instruction, greater scope for innovation and student-centered teaching, increased teacher morale, fewer disruptions, less student misbehavior, and greater ease in engaging students in academic activities” (Hattie, 2013, pp. 131).
Within-class grouping involves teachers placing students into groups within the class based on their abilities. Some researchers have concluded that within-class grouping has a positive influence on student achievement (Lou, Abrami, & Spence, 2000; Steenbergen-Hu, Makel, & Olszewski-Kubilius, 2016). Furthermore, teachers in one study stated that they use within-class grouping to meet the instructional needs of their students (Chorzempa & Graham, 2006). However, more research is needed to examine teachers’ perceptions of the influence of within-class grouping on student achievement. Based on his research, John Hattie (2009) determined that within-class grouping had a very small effect on student achievement. The central argument for the use of within-class group is that grouping students by their ability level allows for greater flexibility in learning objectives and learning pace in order to meet the
individual needs of the students (Lou, 2013).
Samhällsvetenskapliga fakulteten, 2016). Moreover, researchers in several studies found that teachers positively viewed ability grouping (Ireson & Hallam, 2001; Hallam & Ireson, 2003). However, teacher views varied based on teacher experience and subject area taught (Ireson & Hallam, 2001; Hallam & Ireson, 2003). Additionally, Korean teachers in a separate study expressed concerns related to students’ emotional well-being and reported mixed attitudes toward ability grouping (Kim, 2012). Overall, Hattie (2009) concluded that ability grouping had a very small positive effect on student achievement. The use of ability grouping is based on the belief that the achievement of all students will increase when “instruction, learning support, the curriculum, resources, teacher expertise, and so on, are targeted at students according to a similar ability level” (Baines, 2013, pp. 117). However, qualitative researchers have indicated that differences in teacher expectations for students based on ability grouping may be the casual mechanism for the effects demonstrated by ability grouping (Baines, 2013).
Multi-grade and multi-age classes are comprised of students of multiple different grades and ages in the same class. While some educational researchers have found that
interactions between older and younger students, flexibility in grouping and learning styles, and individualized learning based on students’ needs are thought to produce educational benefits for these students (Cornish, 2013; Hattie, 2009).
Open versus traditional refers to an individualized and flexible form of instruction using manipulative materials rather than the traditionally structured form of instruction. Open school programs using diagnostic evaluation, manipulatives, individualized instruction and emphasis on the role of the child in learning produced greater self-self-concept, creativity, and positive
attitude toward school in their students. These schools are based on philosophical assumptions regarding the nature, development, and learning of students (Hattie, 2009). Wood (1978) found that open educational programs had a positive influence on student achievement. However, another educational researcher discovered that open educational programs had a negative impact on student achievement, but had a positive impact on creativity, self-concept, and attitude (Peterson, 1980). Educational researchers have not examined the perceptions of teachers related to the influence of open versus traditional instruction on student achievement. Overall, Hattie (2009) identified open educational programs as having a very small positive effect on student achievement.
2013). Conversely, other researchers have found that retention has negative influences on
achievement (Diris, 2016; Garcia-Perez, Hidalgo-Hidalgo, & Robles-Zurita, 2014). Additionally, one German study found retention had no impact on student achievement, but improved self-concept in mathematics (Ehmke, Drechsel, & Carstensen, 2010). Researchers discovered that teachers viewed retention positively and believed that retention prevents future failure (Okpala, 2007; Range, Pijanowski, Holt, & Young, 2012) In one study, teacher perceptions varied as a function of experience and certification (Okpala, 2007). As a result of his extensive review of the literature, Hattie (2009) determined that retention had a very small negative effect on student achievement.
Upon his review of the meta-analyses related to single-sex classes, Hattie (2009) was unable to determine the effect of single-sex classes on achievement. Unfortunately, any effects related to achievement were attributed to either the gender of the teacher or teacher expectations. Furthermore, there is a lack of research regarding teachers’ perspectives of the influence of single-sex classes on student achievement.
School curriculum effects. School curriculum effects include acceleration (d = 0.88; CLE = 62%), enrichment (d = 0.39; CLE = 28%), and ability grouping for gifted students (d =
only had a positive impact on student math achievement, but also improved student motivation and self-regulation. German teachers in another study demonstrated moderate support for
skipping grades and gave great consideration to possible implications on the students’ academic, motivational, and social development (Westphal, Vock, & Stubbe, 2017). Other research studies have not explicitly examined teachers’ perceptions regarding the influence of acceleration programs on student achievement. John Hattie (2009) concluded that acceleration had a large positive effect on student achievement.
For his synthesis, Hattie (2009) defined enrichment as involving “activities meant to broaden the educational lives of some group of students” (p. 101). Enrichment is thought to promote academic achievement by increasing critical thinking skills (Hattie, 2009). Research has established that enrichment has a significant positive effect on student achievement (Fakolade & Adeniyi, 2010; Martin & Others; 1981). Additionally, several studies have discovered that in addition to improving academic achievement, enrichment also had a positive effect on socioemotional development (Kim, 2016; Kaul, Johnsen, Witte, & Saxon, 2015; Gubbels,
Segers, & Verhoeven, 2014). Researchers have not analyzed teachers’ perspectives related to the influence of enrichment on student achievement. Overall, Hattie (2009) determined that
enrichment had a small positive effect on student achievement.
2016). Furthermore, ability grouping for gifted students improved their social self-concept of acceptance, increased their interest in school, and improved their student-teacher relationships (Vogl & Preckel, 2014). Though there is limited research examining teacher perceptions, Jung (2014) found that teachers with a low power distance orientation, who had contact with gifted individuals, and were older, had more positive views of gifted programs. Based on his synthesis, Hattie (2009) identified ability grouping for gifted students as having a medium positive effect on student achievement.
Classroom influences. Classroom influences that have been researched in relation to student achievement include: group cohesion (d = 0.53; CLE = 38%), peer influences (d = 0.53; CLE = 37%), classroom management (d = 0.52; CLE = 37%), and decreasing disruptive behavior
(d = 0.34; CLE = 24%). Group cohesion is “the sense that all (teachers and students) are working towards positive learning gains” (Hattie, 2009, p. 103). Group cohesion promotes “co-peer learning, tolerance and welcoming of error and thus increased feedback, and more discussion of goals, success criteria, and positive teacher-student and student-student relationships” (Hattie, 2009, pp. 103). Researchers have demonstrated that group cohesion has a positive impact on student performance (Beal, Cohen, Burke, & McLendon, 2003; Evans & Dion, 2012; Greer, 2012). Hattie cited Mullen and Copper (1994), who found that the relationship between group cohesion and performance was stronger in smaller classroom groups than larger classroom groups. While many studies have explored the relationship between group cohesion and
Peer influences refer to how a student’s peers may influence the student’s academic performance. Peer interactions are thought to expose students to specific processes such as support, instruction, exclusion, and conflict (Ladd, 2013). Experiences with each of these processes influences a student’s academic achievement. Some research has indicated that peer influences have a significant impact on student achievement (Darensbourg & Blake, 2014; Hanushek, Kain, Markman, & Rivkin, 2003; Stewart, 2008; Wang & Neihart, 2015). However, other studies have demonstrated that whether the impact is positive or negative may be
determined by the gender and other demographic characteristics of the students (Gottfried, 2014; Ullah & Mardell, 2007). Educational researchers have not specifically investigated the
perspectives of teachers related to the effect of peer influences on student achievement. Overall, Hattie (2009) found that peer influences have a medium positive effect on student achievement.
Classroom management refers to the strategies a teacher uses to maintain a classroom environment conducive to learning. Teachers with effective classroom management develop caring and supportive relationships with and among students, organize and implement instruction to optimize students’ access to learning, use group management methods that encourage
had no significant effect on girls with emotional and behavioral disorders (Garwood, Vernon-Feagans, & Family Life Project Key Investigators, 2017). While there is a lack of available research specifically analyzing teachers’ views related to the influence of classroom management on student achievement, research has shown that teachers’ beliefs regarding classroom
management vary significantly (Evertson & Weinstein, 2006). Hattie’s synthesis (2009) revealed that classroom management strategies had a medium positive overall effect on student
achievement.
From a theoretical framework, decreasing disruptive student behavior in the classroom should positively impact student achievement, as this would provide more time for focused-engagement on educational tasks. This is evident as classroom behavioral interventions that have decreased disruptive behavior also increased academic engagement (McHugh, Tingstrom,
Radley, Barry, & Walker, 2016; Radley, Dart, & O'Handley, 2016). Furthermore, studies such as Thompson (2013) have indicated that disruptive behavior has a significant negative impact on student achievement for all students in the classroom. While research has not explicitly analyzed teachers’ perspectives related to the influence of decreasing disruptive behavior on student academic achievement, other studies have examined teachers’ views regarding disruptive behavior. Some research studies have found consistency in teachers’ perceptions of disruptive student behaviors (Crawshaw, 2015), while other have found variation (ThankGod, 2016). Overall, John Hattie determined that decreasing disruptive behavior had a small positive effect on student achievement.
Summary of school contributions. Hattie (2009) identified the following school
grouping, ability grouping, multi-grade/multi-age classes, and open vs. traditional school contributions. Small positive effects on student achievement were found for finances,
desegregation, religious schools, summer schools, charter schools, leadership, mainstreaming, class size, and decreasing disruptive behavior. The following school contributions were determined to have medium positive effects on student achievement: school size, small-group learning, group cohesion, peer influences, and classroom management. Only one contribution from the school, acceleration, was concluded to have a large positive effect on student
CHAPTER 3: STATEMENT OF PURPOSE
A substantial body of research has examined student achievement over the years. John Hattie synthesized over 800 meta-analyses related to student achievement in a practical and intelligible manner, in order to make this information readily available to educational
researchers, school personnel, and other education stakeholders. Though this research is vast, there is no indication that the findings are being used in schools and classrooms. Hattie (2009) expressed concern regarding the research to practice gap in schools.
Due to the unique opportunity teachers have to impact student achievement, their knowledge of and perceptions related to the factors that influence student achievement are important. When teachers’ perceptions align with the research findings, students may be educated in the most effective manner possible. Therefore, the primary purpose of conducting this research was to gather information regarding whether teachers’ perceptions of the effect of each factor on student achievement are significantly discrepant from the research, differ as a function of demographic characteristics, and which demographic characteristics predict
perception alignment with research findings. Understanding differences in teachers’ perceptions is crucial to designing and implementing evidence-based interventions, acquiring teacher
support, and addressing their concerns as key stakeholders. The following research questions will be explored in this study:
2. Do differences exist among teachers’ perceptions based on the demographic characteristics of the teachers and schools they teach in?
CHAPTER 4: METHODS
Participants
For this study, participants were solicited from teacher organizations willing to participate in a web-based survey to measure perceptions of factors that influence student
academic achievement. Participants in this study include teachers working with pre-kindergarten through high school students in the United States. Three hundred seventy national, state, and local teacher organizations were contacted regarding their willingness to distribute the survey information and link to their members. Twenty-one teacher organizations distributed the survey information to their members via email/listserv, website posts, and/or based on the organizations’ preferences.
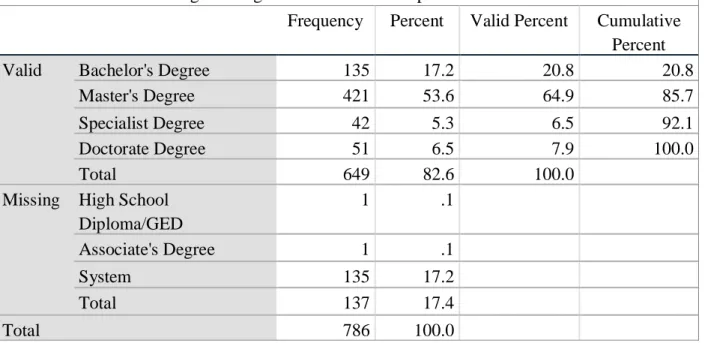
experience, 9% (N=56) had 26-30 years of experience, and 9% (N=60) had more than 30 years of experience. Related to their educational backgrounds, the majority of the participants (79%, N=514) held advanced degrees. Specifically, 0.2% (N=1) held a High School Diploma or General Equivalence Degree, 0.2% (N=1) held an Associate’s Degree, 21% (N=135) held a Bachelor’s Degree, 65% (N=421) held a Master’s Degree, 7% (N=42) held a Specialist Degree, and 8% (N=51) held a Doctorate Degree. Twenty-two percent (N=144) of the participants earned their highest degree in the Northeast region of the United States, 34% (N=221) in the South, 30% (N=192) in the Midwest, and 14% (N=94) in the West. Regions are based off the Census regions used by other educational research such as the National Assessment of Educational Progress, which can be found on the National Center for Education Statistics website. Of the participants, 12% (N=80) were Nationally Certified Teachers, while the majority (88%, N=571) were not Nationally Certified Teachers. Four percent (N=25) of the participants currently teach Pre-Kindergarten, 17% (N=113) currently teach elementary school grades (i.e., Kindergarten through 4th Grade), 38% (N=224) currently teach middle school grades (i.e., 5th Grade through 8th Grade), and 58% (N=375) currently teach high school grades (i.e., 9th Grade through 12th Grade). Additionally, 10% (N=62) of the participants have previously taught Pre-Kindergarten, 32% (N=209) have previously taught elementary school grades, 63% (N=410) have previously taught middle school grades, and 62% (N=402) have previously taught high school grades.
Forty-one percent (N=265) of participants teach in suburban areas, 29% (N=187) teach in urban areas, 30% (N=194) teach in rural areas, and 0.8% (N=5) were unsure how to classify the area in which they teach. Nineteen percent (N=122) of the participants teach in the Northeast region of the United States, 39% (N=256) in the South, 27% (N=176) in the Midwest, and 15% (N=97) in the West.
Materials
The online survey provider, Qualtrics, was be used to create a survey for this research. The Teachers’ Perceptions of School Factors that Influence Student Achievement Survey is a survey that was designed to gauge teachers’ perspectives regarding the school factors that influence student academic achievement (See Appendix 3). The survey first provided
participants with an overview of the survey questions, information about informed consent, and who to contact if they had any questions about the survey results. The survey gathered
information on participant demographics and their perceptions of the influence of each factor on student academic achievement. The following subheadings will describe each of these in more detail.
Demographic information. Demographic information was gathered to help describe the sample in the study and identify differences in perceptions. Participants were asked to identify their sex, race, how many years of experience they had in teaching, what grades they teach, what type of educational services they provide (e.g., Regular Education, Special Education,
These demographic questions were used as demographic variables for the participants and the schools they teach in.
Perceptions of influence. Participants were asked to rate the influence each of the school factors, discussed by Hattie (2009), has on student achievement. The factors were grouped within the subcategories examined (Attributes of the School, School Composition Effects, Classroom Composition Effects, School Curriculum Effects, and Classroom Influences) and included a brief definition to increase the likelihood that participants are conceptualizing the factor in the way that it was discussed in the literature review. A three-point Likert-style rating system (1= Negative Effect, 2 = No Effect, 3 = Positive Effect) was used for each item, with participants responding to “what effect does each factor have on student academic
achievement?”. Additionally, for the factors endorsed as having a positive effect or negative effect, participants were asked, on average, what percent of students they perceive to be positively or negatively affected by each factor. This percentile was compared to the common language effect size (CLE) generated by Hattie (2009) for each school factor to determine teacher perception alignment with current research. The reliability of the instrument was tested using Cronbach’s alpha coefficient and found to have a Cronbach’s alpha coefficient of 0.701.
Procedure
providing suggestions for improving definitions for certain items. Based on information gathered from this pilot test, the survey was slightly adapted to add greater detail to the definitions of certain factors and to add an instructions reminder prompt prior to the questions involving teachers’ perceptions.
Teacher organizations were contacted with regard to their willingness to distribute survey information to their members. The survey was then sent out electronically to all teachers within participating organizations via email/listserv, websites posts and/or social media based on the preferences of the organizations. Informed consent was obtained as part of the survey, before participants viewed any survey questions. Due to initial difficulty obtaining responses from organizations, the survey remained open for 7 months. As an incentive for teachers to complete the survey, participants that completed the survey had the opportunity to enter into a gift card drawing by following the link at the end of the survey. The link brought participants to a separate survey where they could submit their email address to be entered into the gift card drawing for one of twelve $25 gift cards.
CHAPTER 5: DATA ANALYSIS
Descriptive, t-test, and multiple regression analyses were used to examine the alignment of teachers’ perceptions with current research regarding the influence each school factor has on student achievement. Descriptive summary statistics were tabulated for all responses. The following variables were regrouped due to the number of participants in each group, to meet specification requirements for analyses tools utilized, and to ensure generalizability: race or ethnicity, state where participant currently teaches, state where participant earned highest degree, grade(s) currently teach, and grade(s) previously taught. For race or ethnicity, the following groups were collapsed into 1 group label “Other”: American Indian or Native American, Native Hawaiian or Pacific Islander, Two or More Races, and Other. The states were regrouped into regions based on those used by the U.S. Census Bureau and other educational research such as the National Assessment of Educational Progress (National Center for Educational Statistics, 2007) (See Table 1). Grades were regrouped into pre-kindergarten, elementary school grades (kindergarten through 4th grade), middle school grades (5th though 8th grade), and high school grades (9th through 12th grade). Additionally, High School Diploma or General Equivalence Degree and Associate’s Degree were not included as groups for the Highest Degree earned in the remaining analyses due to only 1 participant being represented by each group. Further analyses used to address each research question are discussed in the subsequent sections.
Table 1: Regions of the United States as defined by U.S. Census Bureau
Table 1: Regions of the United States as defined by U.S. Census Bureau South
Alabama, Arkansas, Delaware, District of Columbia, Florida, Georgia, Kentucky, Louisiana, Maryland, Mississippi, North Carolina, Oklahoma, South Carolina, Tennessee, Texas, Virginia, and West Virginia
Midwest Illinois, Indiana, Iowa, Kansas, Michigan, Minnesota, Missouri, Nebraska, North Dakota, Ohio, South Dakota, and Wisconsin
West Alaska, Arizona, California, Colorado, Hawaii, Idaho, Montana, Nevada, New Mexico, Oregon, Utah, Washington, and Wyoming
Since the attrition rate for the survey was relatively high, (786 opened the survey link, 651 began the survey, but only 437 completed the final item), preliminary analysis examined demographic differences between starters and finishers to determine if there were significant differences between the groups. There was not a statistically significant difference between starters and finishers with regard to sex (c2=2.51, p=0.11), race or ethnicity (c2=12.65, p=0.08), highest degree completed (c2=3.837, p=0.28), region in which highest degree was completed (c2=1.55, p=0.67), educational service provided (c2=3.01, p=0.22), national certification (c2=0.34, p=0.56), school type (c2=3.64, p=0.46), region in which currently teach (c2=1.32, p=0.72), community in which school is located (c2=0.13, p=0.94), and Title 1 status (c2=0.62, p=0.43). However, there was a very small correlation (r=0.09, p=0.012) between years of experience and full completion of the survey.
students are affected by each factor. Therefore, these variables could not be included in overall teacher alignment analyses.
Primary data related to the effect of each School Compositional Effects factor show that the majority of participants (90%, N=401) correctly identified student mobility as having a negative impact on student achievement, with 6% (N=25) identifying mobility as having no effect and 4% (N=4) as having a positive effect. Of the sample, 81% (N=361) accurately categorized out-of-school curriculum experiences as having a positive effect on student
achievement, though 13% (N=56) labeled these experiences as having no effect and 6% (N=27) as having a negative effect. For school size, only 35% (N=156) accurately categorized school size as having a positive effect, 48% (N=48) determined no effect and 17% (N=75) classified school size as having a negative effect. Summer vacation was accurately rated by 39% (N=173) of participants as having a negative effect on student achievement, while 31% (N=136) rated summer vacation as having no effect and 30% (N=135) rated summer vacation as having a positive effect.
Teachers perceptions related to single-sex class also could not be included in overall teacher alignment analyses. While Hattie (2009) did not provide a common language effect size for single-sex classes, he stated that “there is very little compelling evidence of a compositional effect related to whether a class is single- or mixed-sex” (p.97). Based on their mean ratings, teachers’ perceptions are relatively align with this conclusion. Collectively, teachers rated single-sex classes as having a positive effect on 1.5% of students on average.
combined to determine teachers’ perception of the influence each factor has on student
achievement. Teachers’ ratings of factors having a negative effect, no effect, or positive effect provided information regarding the direction of the effect. The percent of students effected provided information regarding the level of influence of the effect. For example, a rating of a negative effect and a rating of 50% of students effected is combined to show 50% of students are negatively affected by the factor. A rating of a positive effect and a rating of 50% of students effected is combined to show 50% of students are positively effected by the factor. For factors rated as having no effect, the item is automatically coded as affecting 0% of students. This procedure generated a variable for each teacher’s perception of the effect of each factor.
Analysis for Research Question 1:
Do teachers’ perceptions align with current research regarding the effect factors contributed by the school have on student achievement?
A paired-samples t-test was completed to examine whether differences exist between teachers’ perceptions and the current research finding regarding the influence of each factor related to student achievement. For this analysis, the average for teachers’ perceptions of the percent of students affected by each contribution of the school was compared to the
(common language effect sizes determined by Hattie’s research) for each factor. The factors were examined to determine the factors for which teacher alignment was least and greatest.
Analysis for Research Question 2
Do differences exist among teachers’ perceptions based on the demographic characteristics of the teachers and schools they teach in?
A hierarchical multiple regression was used to determine whether differences in perception exists between groups based on demographic characteristics of teachers and the schools they teach in. Dummy variables were generated for all categorical variables. Average perception alignment variables were generated for each participant. For this analysis, the demographic characteristics of teachers and the schools they work in were the independent variables and the average teacher perception alignment variable was the dependent variable. It was hypothesized that teacher demographic variables and school demographic variables would each demonstrate statistically significant influence in predicting teacher perception alignment.
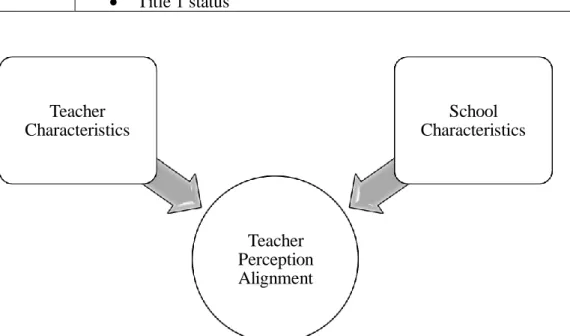
Due to the number of variables and the tendency for different school characteristics to attract teachers with specific demographic characteristics, hierarchical multiple regression was conducted by using the predictor variables in the block order demonstrated in Table 2. This block order allows for teacher characteristics to be controlled for when examining the impact school characteristics have on teacher perception alignment with current research. Refer to Figure 3 for the regression model. The regression equation is as follows, where k represents the number of independent variables and represents the parameters or regression weights for each variable: Yi’ = 0 + 1 X1i + 2 X2i + …+ k Xki .
Table 2: Hierarchical Multiple Regression Block Order Block 1 Teacher Characteristics:
Table 2: Hierarchical Multiple Regression Block Order
• Race or Ethnicity (White, Black or African American, Asian, Other) • Years of teaching experience
• Highest degree earned (Bachelor's Degree, Master's Degree, Specialist Degree, Doctorate Degree)
• Region where highest degree was earned (Northeast, South, Midwest, West) • Grade(s) taught (Pre-Kindergarten, Elementary School Grades, Middle
School Grades, High School Grades)
• Grade(s) currently teach (Pre-Kindergarten, Elementary School Grades, Middle School Grades, High School Grades)
• Educational services provided (Regular Education, Special Education, Specialized Instruction, National certification status)
Block 2 School Characteristics:
• School type (Traditional Public, Charter, Magnet, Non-Religious Private, Religious Private
• Community type (Urban, Suburban, Rural)
• Region currently teach in (Northeast, South, Midwest, West) • Title 1 status
Figure 3: Model for Hierarchical Multiple Regression
Analysis for Research Question 3
What demographic characteristics predict perception alignment with current research regarding the effect factors contributed by the school have on student achievement?
Teacher Perception Alignment Teacher
Characteristics
CHAPTER 6: RESULTS
The distribution of participants by demographic category are presented below in Tables 3 – 11. The descriptive statistics of study variables are presented below in Table 12.
Table 3: Distribution of Sex of Participants
Frequency Percent Valid Percent Cumulative Percent
Valid Male 125 15.9 19.4 19.4
Female 518 65.9 80.6 100.0
Total 643 81.8 100.0
Missing Prefer not to answer 8 1.0
System 135 17.2
Total 143 18.2
Total 786 100.0
Table 4: Distribution of Race of Participants
Frequency Percent Valid Percent Cumulative Percent
Valid White 548 69.7 87.3 87.3
Black or African American
24 3.1 3.8 91.1
Asian 23 2.9 3.7 94.7
Other 33 4.2 5.3 100.0
Total 628 79.9 100.0
Missing System 158 20.1
Table 5: Distribution of Highest Degree Earned for Participants
Frequency Percent Valid Percent Cumulative Percent
Valid Bachelor's Degree 135 17.2 20.8 20.8
Master's Degree 421 53.6 64.9 85.7
Specialist Degree 42 5.3 6.5 92.1
Doctorate Degree 51 6.5 7.9 100.0
Total 649 82.6 100.0
Missing High School Diploma/GED
1 .1
Associate's Degree 1 .1
System 135 17.2
Total 137 17.4
Total 786 100.0
Table 6: Distribution of the Region Where Highest Degree was Earned for Participants Frequency Percent Valid Percent Cumulative
Percent
Valid Northeast 144 18.3 22.1 22.1
South 221 28.1 33.9 56.1
Midwest 192 24.4 29.5 85.6
West 94 12.0 14.4 100.0
Total 651 82.8 100.0
Missing System 135 17.2
Total 786 100.0
Table 7: Distribution of Education Services Provided for Participants
Frequency Percent Valid Percent Cumulative Percent
Valid Regular Education 574 73.0 88.2 88.2
Special Education 28 3.6 4.3 92.5
Specialized Instruction 49 6.2 7.5 100.0
Total 651 82.8 100.0
Missing System 135 17.2
Table 9: Distribution of Region Where Currently Teach for Participants Frequency Percent Valid Percent
Cumulative Percent
Valid Northeast 122 15.5 18.7 18.7
South 256 32.6 39.3 58.1
Midwest 176 22.4 27.0 85.1
West 97 12.3 14.9 100.0
Total 651 82.8 100.0
Missing System 135 17.2
Total 786 100.0
Table 10: Distribution of Community Type for Participants
Frequency Percent Valid Percent Cumulative Percent
Valid Urban 187 23.8 28.9 28.9
Suburban 265 33.7 41.0 70.0
Rural 194 24.7 30.0 100.0
Total 646 82.2 100.0
Missing Do Not Know 5 .6
System 135 17.2
Total 140 17.8
Total 786 100.0
Table 8: Distribution of Nationally Certified for Participants
Frequency Percent Valid Percent Cumulative Percent
Valid No 571 72.6 87.7 87.7
Yes 80 10.2 12.3 100.0
Total 651 82.8 100.0
Missing System 135 17.2
Table 11: Distribution of Title 1 School Status for Participants
Frequency Percent Valid Percent Cumulative Percent
Valid No 287 36.5 47.2 47.2
Yes 321 40.8 52.8 100.0
Total 608 77.4 100.0
Missing Do Not Know 43 5.5
System 135 17.2
Total 178 22.6
Total 786 100.0
Table 12: Descriptive Statistics for Study Variables
N Minimum Maximum Mean Std. Deviation
Experience 651 0 60 16.65 10.332
Teach PreK 786 0 1 .03 .176
Teach Elementary 786 0 1 .14 .351
Teach Middle 786 0 1 .31 .463
Teach High 786 0 1 .48 .500
Taught PreK 786 0 1 .08 .270
Taught Elementary 786 0 1 .27 .442
Taught Middle 786 0 1 .52 .500
Taught High 786 0 1 .51 .500
TP Leadership 543 -100 100 46.30 52.278
TP Finances 501 -100 100 46.89 63.011
TP Desegregation 502 -100 100 47.00 59.794
TP Religious Schools 504 -100 100 6.19 48.474
TP Summer School 500 -100 100 32.78 43.370
TP Charter Schools 504 -100 100 -8.88 53.672
TP Ability Grouping 464 -100 100 36.55 56.104
TP Reducing Class Size 464 -100 100 84.59 28.955
TP Mainstreaming 467 -100 100 21.26 60.270
TP Multi-Grade/Multi-Age Classes 469 -100 100 6.79 57.461
TP Open vs. Traditional Classes 467 -100 100 36.02 52.600
TP Retention 466 -100 100 6.13 58.383
TP Small Group Learning 464 -80 100 70.67 34.469
Table 12: Descriptive Statistics for Study Variables
N Minimum Maximum Mean Std. Deviation
TP Classroom Management 447 -50 100 87.08 22.195
TP Decreasing Disruptive Behavior 447 -100 100 86.94 26.114
TP Group Cohesion 447 -81 100 81.23 28.402
TP Peer Influences 447 -100 100 47.67 55.609
TP Ability Grouping for Gifted Students 437 -100 100 45.87 48.587
TP Acceleration 437 -100 100 49.89 46.075
TP Enrichment 437 -100 100 67.18 36.309
Research Question 1
Do teachers’ perceptions align with current research regarding the effect factors contributed by the school have on student achievement?
A paired-samples t-test was completed to examine whether differences exist between teachers’ perceptions and the current research finding regarding the influence of each factor related to student achievement. For this analysis, teachers’ perceptions for the average percent of students affected by each contribution of the school was compared to the corresponding common language effect size for each contribution of the school from Hattie’s (2009) research. Results from the paired-samples t-test indicate a statistically significant difference between teachers’ perceptions and current research findings for all of the factors (p < 0.001) except for