EXPLORING THE ASSOCIATION BETWEEN ANTIDEPRESSANTS AND COLORECTAL CANCER IN ADMINISTRATIVE DATA: NEGATIVE CONTROLS, ACTIVE COMPARATORS
AND ALGORITHMS
Monica E. D’Arcy
A dissertation submitted to the faculty at the University of North Carolina at Chapel Hill in partial fulfillment of the requirements for the degree of Doctor of Philosophy in the Department of
Epidemiology in the Gillings School of Global Public Health.
Chapel Hill 2016
Approved by: Jennifer L. Lund
Til
Stürmeriii
ABSTRACT
Monica E. D’Arcy: Exploring The Association Between Antidepressants and Colorectal Cancer in Administrative Data: Negative Controls, Active Comparators and Algorithms
(Under the direction of Jennifer Lund)
Some antidepressants, especially Selective Serotonin Reuptake Inhibitors (SSRIs), may prevent colorectal cancer (CRC), but these effects may be drug rather than class specific. Previous epidemiological studies have only examined class-level effects, and all studies used non-user comparisons, which are susceptible to several biases.
Examining specific SSRI-CRC associations requires a large sample size and precise prescription records, which are features of administrative data; however, these data do not generally contain pathology confirmed cases and algorithms are required to identify probable cases.
iv
To examine the first two goals, we performed a new-user, cohort study using a 20% random sample of Medicare beneficiaries (2007-2013), aged ≥66. We estimated hazard ratios (HRs) and 95% confidence intervals (CI), and controlled measured confounding using a
propensity score weighting approach. SSRI initiators had lower CRC rates compared with AHT initiators (aHR=0.85, 95% CI: 0.70-1.02). Paroxetine and fluoxetine initiators had lower CRC rates compared with citalopram users (aHR: 0.78, 95% CI: 0.56-1.06; aHR: 0.74, 95% CI: 0.52-1.05, respectively). Estimates were consistent across sensitivity analyses.
We re-evaluated CRC-identification algorithm performance in a ≥65, 2006-2009 North
Carolina Medicare population, a proportion of which were cancer registry identified CRC cases. We employed a novel cohort creation strategy, whereby cases contribute information from both their pre-diagnostic non-case and case states to accurately capture CRC incidence. Specificity was lower (98.3-99.4% versus 98.5-99.6%) and Positive Predictive Value (PPV) substantially lower (18-37% versus 45-71%) in this population compared to the original population.
Results from the first two goals warrant further investigation into the SSRI-CRC
association, including incorporating additional part D data as it becomes available. Algorithms are a necessity when performing a drug-cancer study in administrative data, but should be used cautiously, because they are population and time specific. These CRC-identification algorithms need to be updated to reflect a more contemporary and economically diverse population. Future validation studies should employ strategies to accurately ascertain incidence to avoid
v
vi
ACKNOWLEDGEMENTS
A lot of people and factors helped me get this ambitious dissertation to this point.
1. My Committee: Thank you for your loyalty, your engagement and for encouraging me to do things the right way even when it takes a little longer.
2. The pharmacoepidemiology group at UNC: I came in as a cancer epidemiology student and you embraced me as your own.
3. My team of special ladies: You helped me walk the line.
4. My funding sources over the years: the graduate school, cancer epidemiology training grant, Melissa Troester, cancer control and education training grant, center for
pharmacopepidemiology.
vii
TABLE OF CONTENTS
LIST OF TABLES ... xi
LIST OF FIGURES ... xii
LIST OF ABBREVIATIONS ... xiii
CHAPTER 1: SPECIFIC AIMS ... 1
CHAPTER 2: BACKGROUND ... 5
2.1 Significance ... 5
2.2 Antidepressants, serotonin and cytotoxicity ... 6
2.2.1 Antidepressants ... 6
2.2.2 Serotonin in the body ... 7
2.2.3 Serotonin and cancer cell cytotoxicity ... 8
2.2.4 Antidepressants and cancer cytotoxicity ... 9
2.2.5 Antidepressants: Mechanisms implicated ...11
2.2.6 Mechanisms implicated ...12
2.2.7 Total evidence ...13
2.3 Epidemiological evidence ...13
2.3.1 Reasons for study variability ...14
2.4 Claims databases and identification of incident cancers ...19
2.5 Epidemiology of CRC ...20
2.5.1 Broad molecular classifications of colorectal cancer ...21
2.5.2 CRC Risk and protective factors ...25
2.5.3 Heterogeneity of risk factors and CRC subtypes ...30
viii
3.1 Study design and population ...34
3.1.1 Aim 1, Aim 2 ...34
3.1.2 Aim 3 ...35
3.2 Exposure ascertainment and Inclusion criteria (Aim 1, Aim 2) ...39
3.3 Outcome ascertainment (Aim 1, Aim 2) ...40
3.4 Covariate assessment (Aim 1, Aim 2) ...41
3.5 Confounding control (Aim 1, Aim 2) ...42
3.5.1 Aim 1 confounding control ...42
3.5.2 Aim 2 confounding control ...43
3.6 Person-time at risk Aim 1, Aim 2 ...43
3.7 Statistical analyses ...45
3.7.1 Aim 1 ...45
3.7.2 Aim 2 ...46
3.7.3 Aim 3 ...46
3.8 Sensitivity analyses ...46
3.8.1 Aim 1, Aim 2 ...46
3.8.2 Aim 3 sensitivity cohorts ...47
CHAPTER 4: SYNCHRONIZING FOLLOW-UP IN PHARMACOEPIDEMIOLOGIC STUDIES USING NEGATIVE CONTROL EXPOSURES: ANTIDEPRESSANTS AND CRC RISK ...49
4.1 Background ...49
4.2 Methods ...51
4.2.1 IRB approval (#14-1991) and CMS approval ...51
4.2.2 Selection of a negative control exposure ...51
4.2.3 Data source and study population ...51
4.2.4 Outcome assessment ...52
4.2.5 Covariate assessment ...53
ix
4.3 Results ...56
4.3.1 Primary analyses ...56
4.3.2 Medicalization and high short-term CRC rate ...57
4.4 Discussion ...57
4.5 Future directions ...59
4.6 Tables ...61
4.7 Figures ...65
CHAPTER 5: SELECTIVE SEROTONIN REUPTAKE INHIBITORS AND THE RISK OF COLORECTAL CANCER IN A COHORT OF MEDICARE BENEFICIARIES (2007-2013) ...71
5.1 Background ...71
5.2 Methods ...72
5.2.1 IRB approval (#14-1991) and CMS approval ...72
5.2.2 Data source and study population ...72
5.2.3 Outcome assessment ...73
5.2.4 Covariate assessment ...74
5.2.5 Statistical analysis ...76
5.3 Results ...77
5.3.1 Primary analyses ...77
5.3.2 Sensitivity Analyses ...77
5.4 Discussion ...78
5.5 Conclusion ...80
5.6 Tables ...81
5.7 Figures ...85
CHAPTER 6: RE-EVALUATION OF COMMONLY USED DEFINITIONS TO IDENTIFY COLORECTAL CANCER IN A NORTH CAROLINA POPULATION (2006-2009) ...90
6.1 Background ...90
x
6.1.2 Objectives ...91
6.2 Methods ...92
6.2.1 Data source ...92
6.2.2 Main validation cohort ...93
6.2.3 Sensitivity analyses ...95
6.2.4 Statistical analyses ...96
6.3 Results ...96
6.3.1 Creation of primary (dynamic) cohorts. ...97
6.3.2 Sensitivity analyses ...97
6.3.3 Evaluation of modification of algorithms ...98
6.4 Discussion ...98
6.4.1 Features driving poor PPV and high false positive (FP) rate ...99
6.4.2 Conclusions and future directions ... 100
6.5 Tables ... 102
6.6 Figures ... 109
CHAPTER 7: CONCLUSIONS ... 112
7.1 Main findings ... 112
7.2 Significance ... 114
7.3 Future directions ... 115
APPENDIX A – DRUG TABLES ... 118
APPENDIX B – SETOGUCHI CODES ... 122
APPENDIX C – CURRENT COLONOSCOPY/SCREENING AND TREATMENT CODES ... 123
xi
LIST OF TABLES
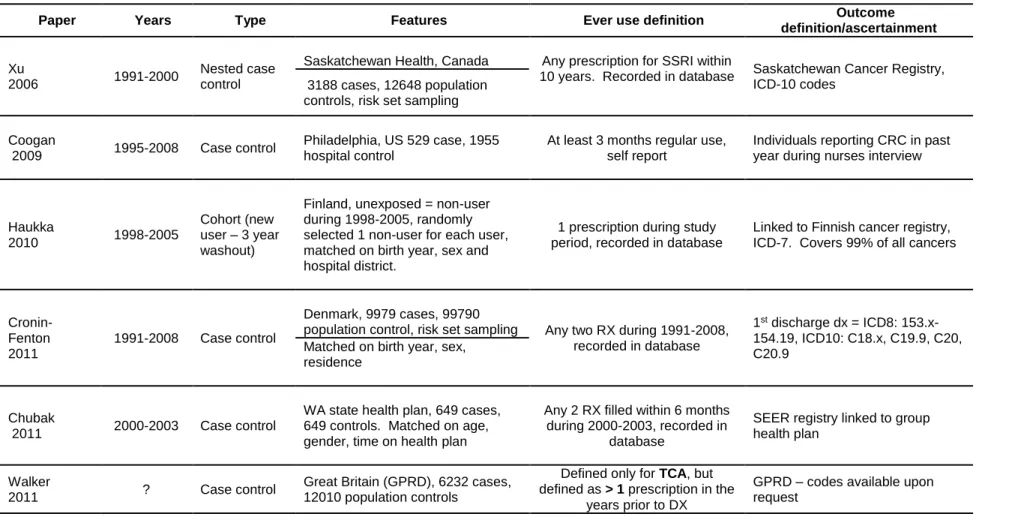
Table 1: Epidemiological evidence ...16
Table 2: Exposure assessment characteristics and variability in epidemiological studies ...17
Table 3: Summary of CRC risk factors ...26
Table 4: Summary of protective factors ...28
Table 5: Heterogeneity of CRC risk factors ...31
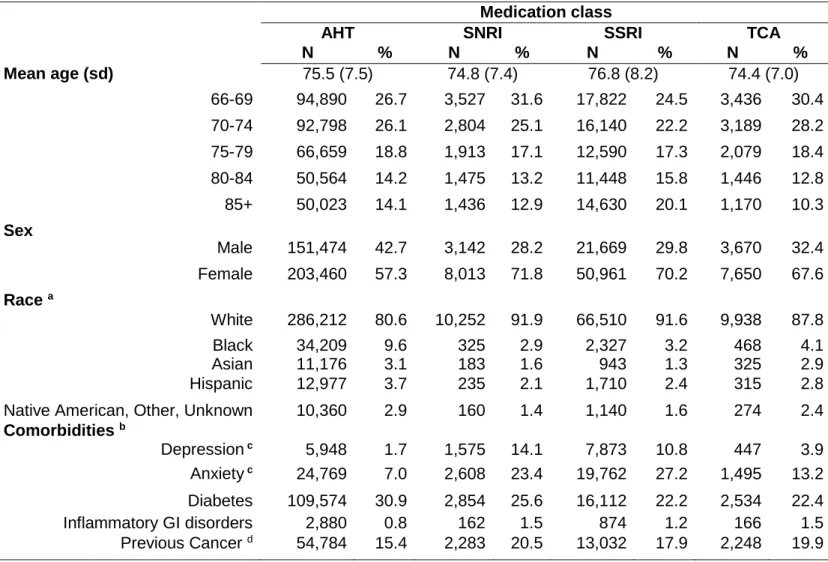
Table 6: Demographic characteristics of 492,213people initiating a single class ...61
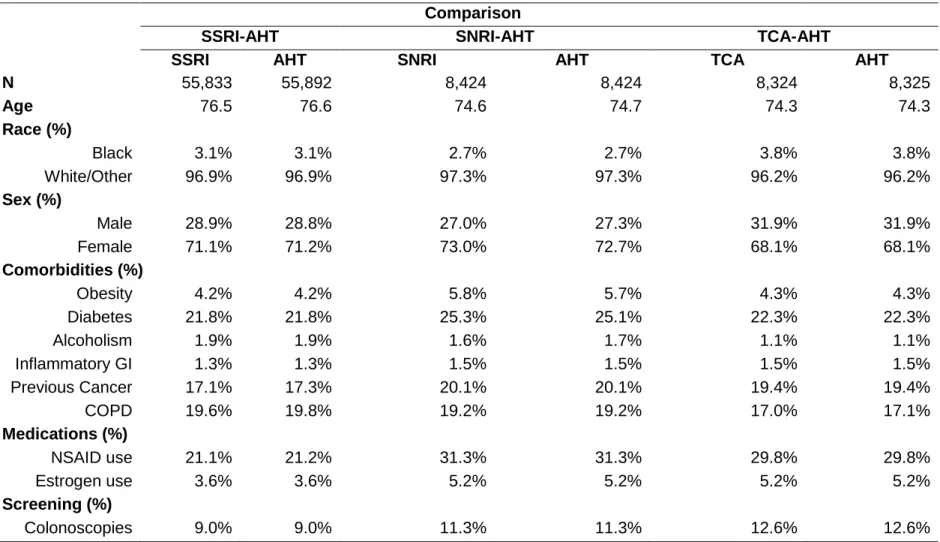
Table 7: Balance of select covariates of application of weights. ...63
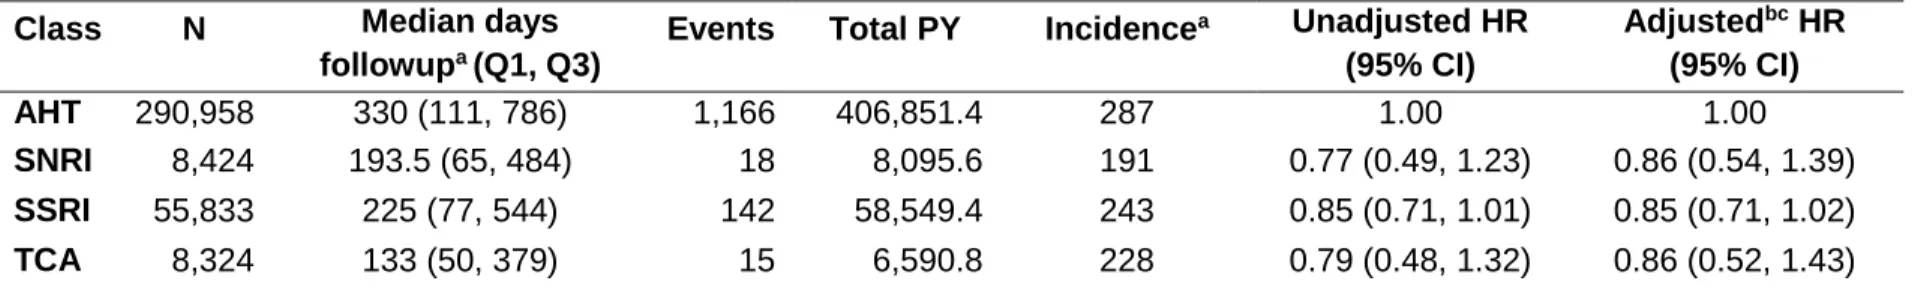
Table 8: The association between AD use and algorithm-identified CRC ...64
Table 9: Like Table 7 except excludes anxiety and depression in PS model. ...64
Table 10: Demographic characteristics for 375,610 SSRI initiators. ...81
Table 11: Balance of select covariates after PS weighting. ...83
Table 12: The association between SSRIs and incident CRC ...84
Table 13: Characteristics of cases and non-cases. ... 102
Table 14: Window characteristics stratified by case status (Group) ... 103
Table 15: Identified case characteristics by window ... 104
Table 16: Algorithm performance stratified by window ... 105
Table 17: Aggregated algorithm performance ... 106
Table 18: Sensitivity analyses ... 107
xii
LIST OF FIGURES
Figure 1: Incident cancer identification algorithms. ...20
Figure 2: Hypothetical example, series of observation windows. ...38
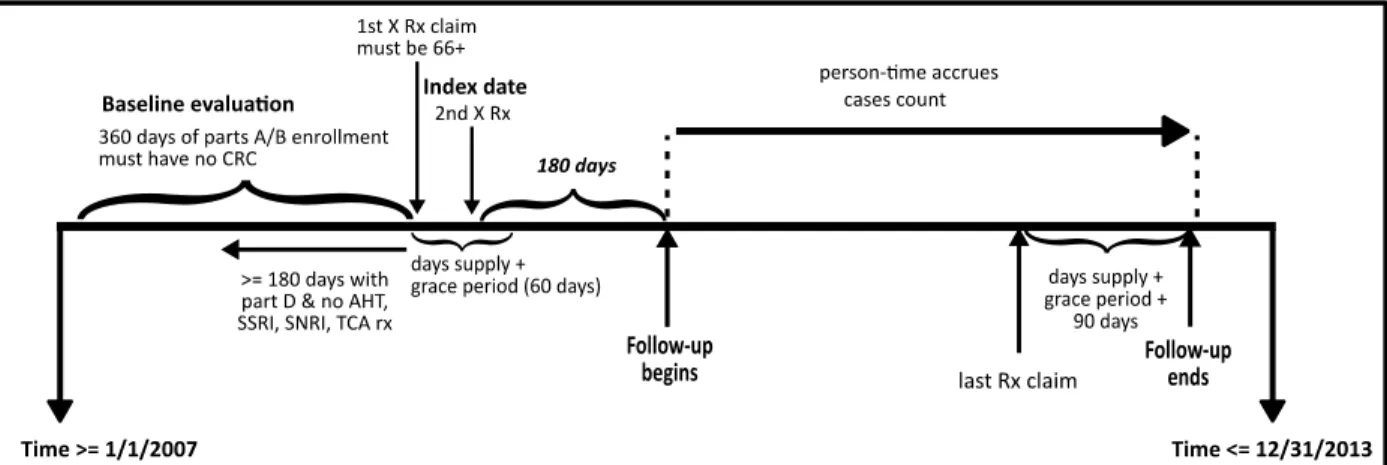
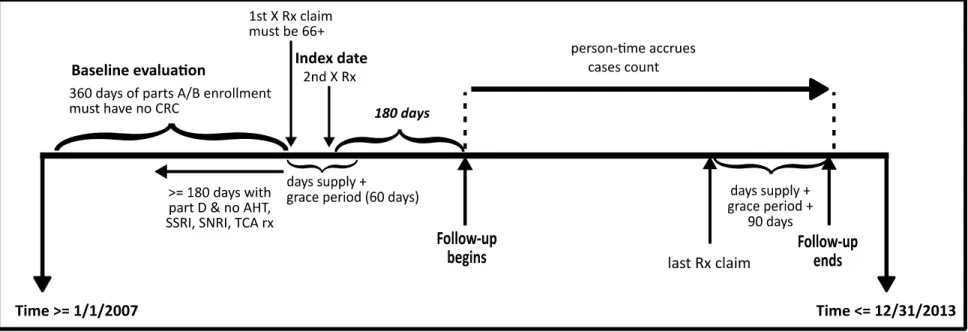
Figure 3: Cohort entry and exit for Aim 1 ...44
Figure 4: Cohort entry and exit for Aim 2 ...45
Figure 5: Conceptualization of entry/exit into AD class ...65
Figure 6: CRC incidence stratified by time and drug class. ...66
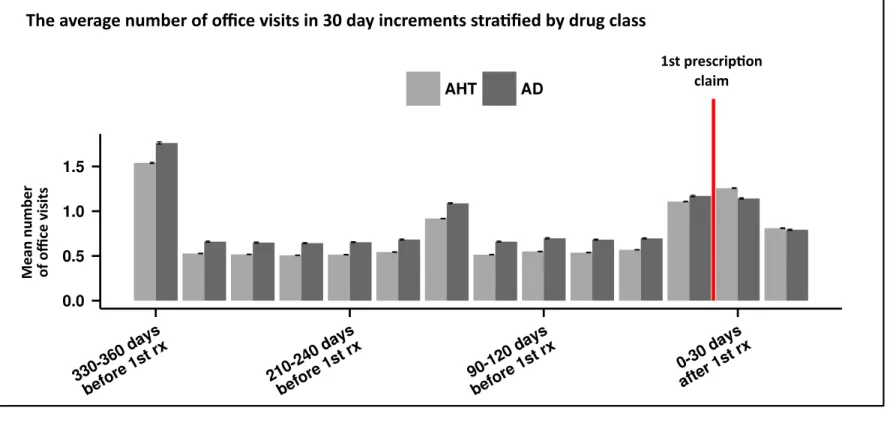
Figure 7: Average number of office visits stratified by medication class. ...67
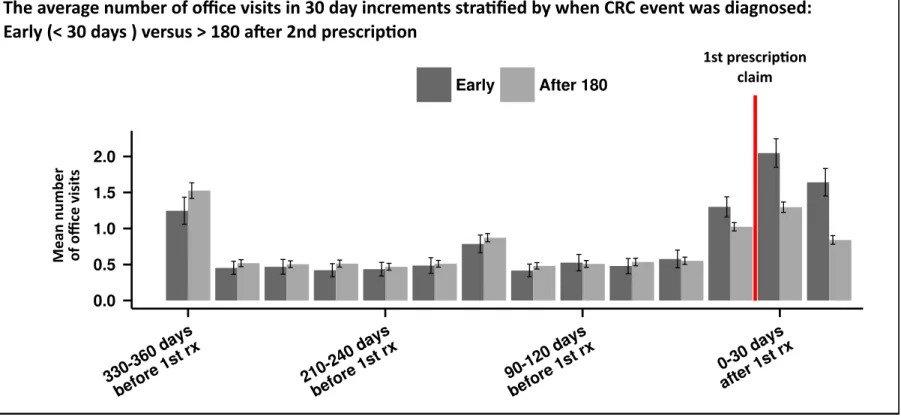
Figure 8: Average number of office visits among algorithm identified CRC cases. ...68
Figure 9: Sensitivity analyses with varying induction and latency assumptions. ...69
Figure 10: Adjusted hazard ratios stratified by time on AD class. ...70
Figure 11: Conceptualization of entry/exit into specific SSRI cohort ...85
Figure 12: Incidence over time for each SSRI. ...86
Figure 13: Flowchart of SSRI initiator loss ...87
Figure 14: Sensitivity analyses with varying induction and latency assumptions. ...88
Figure 15: Adjusted hazard ratios stratified by time on SSRI. ...89
Figure 16: Algorithm performance in original and current population ... 109
Figure 17: Visualization of various sensitivity analyses of algorithm performance ... 110
xiii
LIST OF ABBREVIATIONS
5-FU 5-flourouracil
5-HT 5-hytroxytryptophan, serotonin ACF Aberrant Crypt Foci
AOM Azoxymethane
AD Antidepressant
BMI Body Mass Index
BOL 2-bromolyseric acid diethylamide DMH 1,2 dimethylhydrazine
CI Confidence Interval
CIN Chromosomal Instability Phenotype CIMP CpG Island Methylator Phenotype COPD Chronic Obstructive Pulmonary Disorder COX-2 Cyclooxygenase-2
CRC Colorectal Cancer EC Enterochromaffin Cells
FAP Familial Adenomatous Polyposis GEE Generalized Estimating Equations GI Gastrointestinal
HR Hazard Ratio
HRT Hormone Replacement Therapy IBS Irritable Bowel Syndrome IBD Inflammatory Bowel Disease
ICD-9 International Classification of Diseases, Clinical Modification, Ninth Revision ICISS Integrated Cancer Information Surveillance System
MDR Multidrug Resistance MSI Microsatellite Instable
xiv
NE Norepinephrine
NET Norepinephrine Transporter NPV Negative Predictive Value
NSAID Non-Steroidal Anti-Inflammatory Drug
OR Odds Ratio
PA Pennsylvania
PACE Pharmaceutical Contract for the Elderly PPV Positive Predictive Value
NC North Carolina
RCT Randomized Clinical Trial
RR Risk Ratio
SE Sensitivity
SERT Serotonin Reuptake Transporter SMR Standardized Morbidity Ratio
SSRI Selective Serotonin Reuptake Inhibitor SNRI Serotonin Norepinephrine Reuptake Inhibitor
SP Specificity
TCA Tricyclic Antidepressant TNBS Trinitrobenzene Sulfonic Acid UC Ulcerative Colitis
1
CHAPTER 1: SPECIFIC AIMS
Despite declines in incidence and mortality over the past 30 years, colorectal cancer (CRC) remains the secondleading cause of cancer mortality in the United States [1] with almost 50,000 deaths expected in 2015 [2]. CRC treatment is expensive, with the average cost per colon cancer Medicare beneficiary in the first year after diagnosis estimated at $30,000 in 2010 [3]. High costs of cancer treatment have therefore generated interest in identifying existing drugs and supplements with the potential to prevent cancer [4].
Antidepressants are commonly prescribed drugs, with an estimated 17% of Americans aged ≥65 reporting antidepressant use in a 2012 nationally representative survey [5].
Experimental evidence, both in-vivo [6-12] and in-vitro [8, 9, 13-20], suggests that some antidepressants may have anti-neoplastic effects, and that these effects could be drug and not class specific.
The few epidemiological studies [21-26] examining the association between both Selective Serotonin Reuptake Inhibitors (SSRIs) and Tricyclic Antidepressants (TCAs), and CRC have produced conflicting results, and all studies compared antidepressant users to non-users. Failure to adequately synchronize the start of follow-up can lead to improper attribution of events to new user and non-user groups. The frequency and intensity of interaction with the healthcare system (i.e., healthcare utilization) may also differ between initiators of a drug—new users [27]—and non-users, and thus non-user comparisons are also susceptible to outcome detection bias.
2
claims is reliable, claims data do not generally contain pathology confirmed cases, because they are used for reimbursement, and not research purposes. Therefore, algorithms are necessary to identify incident cancer cases in administrative data. Claims data are critical to answering questions that could not be feasibly ascertained within the context of a randomized clinical trial (RCT) or an observational study, because certain questions require a very large sample size, precise exposure ascertainment, and do not have enough evidence to warrant an RCT, for example the association between specific SSRIs and CRC. Studies performed in these data can also be substantially cheaper than traditional cohort studies because these data already exist.
The overarching goals of this dissertation are to rigorously examine the association between antidepressants and CRC, including plausible reasons for conflicting results, while exploring some methodological considerations specific to adequately addressing this sort of question in administrative data. The specific aims are as follows:
Specific Aim 1: Compare the incidence of CRC across cohorts of new users of SSRIs,
new users of TCAs, new users of Serotonin Norepinephrine Reuptake Inhibitors (SNRIs),
and new users of a negative exposure control, antihypertensives (AHT) exclusive of
beta-blockers. Explore potential reasons for high cancer incidence shortly after initiation.
Aim 1 will be accomplished by generating cohorts of incident users to the classes of drugs of interest in the Medicare claims databases (parts A/B/D) for the years 2007-2013 in individuals aged ≥66 years. Our comparison of antidepressant users with the control group (non-users) will incorporate current pharmacoepidemiology techniques to improve exchangeability. We
3
Rationale: To date, no study has examined the association between antidepressant classes and CRC using a negative exposure control, and no study has ever evaluated the association between SNRIs and incident CRC. There are biologically feasible reasons why SNRIs may increase CRC risk through increased vascularization.
Specific Aim 2: Evaluate variation in the association between specific SSRIs (i.e.
sertraline, fluoxetine, paroxetine) and CRC.
Aim 2 will be accomplished by generating cohorts of incident users to the classes of drugs of interest in the Medicare claims databases (parts A/B/D) for the years 2007-2013 in individuals aged ≥66 years. We hypothesize that differences in previously reported studies could be partially explained by inherent differences between specific drugs in the SSRI class with respect CRC risk. Rationale: Experimental evidence suggests some SSRIs may have anti-neoplastic effects. Epidemiologic studies examining the association between SSRIs and colorectal cancer (CRC) have produced inconsistent findings. Potential heterogeneity of specific SSRI effects, paired with differences in SSRI use across populations, may explain variation in previously reported results.
Specific Aim 3: Re-evaluate the validity of the algorithms defined by Setoguchi [28] for colorectal, colon and rectal cancer cases in the Medicare claims database for the years
2006-2009 in more economically diverse and recent population without stringent
enrollment criteria
4
these algorithms to identify probable CRC cases in Aims 1-2; however, their performance in a more contemporary and economically diverse population is unknown. These algorithms were developed in a Pennsylvania (PA) population that was continuously co-enrolled in both
5
CHAPTER 2: BACKGROUND
2.1 Significance
Stress and depression are hypothesized to contribute to the progression of cancer via pathways involved in immune function, apoptosis, and inflammatory response. These
hypotheses are supported by experimental studies [29-33], although they are difficult to test in humans [33-39]. Depressive symptoms—often treated with antidepressants—are reported by approximately 10% of Americans. Antidepressants are commonly prescribed drugs, with an estimated 17% of Americans aged ≥65 years reporting antidepressant use in a 2012 nationally representative survey [5]. It is estimated that 25% of cancer patients suffer from depression [40], and depression is associated with increased mortality [41]. As the 3rd most common cancer among men and women, and the 2rd leading cause of cancer mortality in the United States [42], CRC is a major public health burden.
There is increasing in-vivo [6-12] and in-vitro [8, 9, 13-18, 20, 43] evidence that antidepressants are cytotoxic to cancer cells, and that some antidepressants may act as chemosensitizers [44-46]. There is limited [21, 22, 25] epidemiological evidence supporting these associations, but these studies failed to use current pharmacoepidemiologic techniques to ensure comparability between exposed and non-exposed populations. They were also not powered to evaluate potential heterogeneity within the SSRI class.
6
without decades of data. With seven years of a 20% random sample of the Medicare
population, we have the opportunity to rigorously evaluate the associations between individual drugs and incident CRC.
Antidepressants are drugs used to treat depression, and depression is common among cancer patients [40]. Because these drugs are so commonly used, it is important to understand the potential harms and benefits. If they reduce the incidence of CRC by acting late in the carcinogenic process—on a late adenoma or early carcinoma—then they may have adjuvant benefits to individuals getting treated for CRC who also have depression. For example, some CRC tumors are highly resistant to Cetuximab [47], but there is evidence that some
antidepressants (sertraline) may be cytotoxic to similar cell lines (HT-29), and reduce tumor size in HT-29 xenografted mice [48].
2.2 Antidepressants, serotonin and cytotoxicity
2.2.1 Antidepressants
Three of the most commonly used antidepressant classes include: SSRIs, TCAs and SNRIs. These drug classes increase the intercellular availability of neurotransmitters—most commonly serotonin, norepinephrine or dopamine—by preventing their uptake. TCAs are named for their physical structure, having three rings, but are quite variable in their function and affinity for various neurotransmitters. They increase neurotransmitter availability by preventing reuptake via binding to specific receptors or reuptake transporters, but they do this
non-selectively. In contrast, drugs within the SNRI or SSRI class behave similarly to one another in that they strongly prevent only specific neurotransmitters, norepinephrine + serotonin, or
7
and are more often prescribed to treatment resistant or more severe forms of depression. They additionally have a wider indication of use including neuropathic pain (desipramine). SNRIs are also indicated for neuropathic pain and fibromyalgia. In contrast, SSRIs and not indicated for pain conditions.
2.2.2 Serotonin in the body
The majority of serotonin (5-hytroxytryptophan (5-HT)) in the body is synthesized from tryptophan by the enterochromaffin cells (EC), which are distributed throughout the
gastrointestinaI (GI) Tract [49]. Serotonin then enters the lumen and interacts with the various serotonin receptors, and finally is taken up by enterocytes expressing the serotonin reuptake transporter (SERT) [50] . Serotonin has many functions including motility control of the GI tract. SSRIs bind to SERT, thereby inhibiting the reuptake of serotonin into the cell. TCAs are non-selective and may bind to SERT, the dopamine transporter (DET) and the norepinephrine transporter (NET). SNRIs preferentially bind to SERT and NET. All three classes additionally have marginal affinity for some of the several known serotonin receptors classes[51].
The distribution and types of serotonin receptors and SERT in the GI tract, specifically the colon, is not completely known[50], but serotonin receptors and SERT are present in the colon. Although SERT is present in the colon, there is evidence that it is expressed at much lower levels compared with the small intestine [52]. SSRIs modify SERT and serotonin
expression in experimental animal models [53, 54], enhancing the biological rationale that these drugs could alter CRC risk in humans.
Serotonin, serotonin receptor, and SERT dysregulation is implicated in several
8
dramatically reduced in severe UC compared with non-severe UC cases [58]. The association between 5-HT, 5-HT receptor, SERT and these disorders is complex and not completely
understood. IBD, UC in particular, is a strong risk factor for CRC. Therefore, drugs that modify 5-HT, 5HT receptors and SERT expression may be associated with an increased or decreased risk of CRC.
2.2.3 Serotonin and cancer cell cytotoxicity
There was conflicting evidence early on concerning the association between serotonin and/or serotonin antagonists and both cell proliferation and tumor growth. In two separate experiments, Tutton and Barkla [59, 60] found that serotonin intraperitoneally injected into rats with chemically induced (dimethylhydrazine (DMH)) descending colon adenocarcinomas
increased the mitotic rate of the tumors, but not in the normal colonic crypt epithelium. Injecting higher levels of serotonin into the animals resulted in a reduction of cell proliferation. The same studies also found that either depleting serotonin with DL-6-fluorotryptophan, or blocking
serotonin receptors with a serotonin antagonist (2-bromolyseric acid diethylamide (BOL)) decreased tumor mitotic rate without a change in colonic crypt proliferation rate. A later study found [16] that fluoxetine greatly reduced human COLO320 DM viability, and increased serotonin and its main metabolite, but that serotonin-only treatment did not reduce viability. Tutton and Barkla also [61] observed that BOL was not cytotoxic to tumors induced by DMH in male rats, although it decreased the tumor mitotic rate. In 1981[6] they observed that a
9
tumor and the normal tissue compared with controls. They found that the drugs reduced tumor size relative to the control in two of the cell lines; the drug had no effect on one cell line relative to the control. In one cell line, fluoxetine reduced tumor growth whereas citalopram just slowed the tumor growth relative to the control. They also found that the drugs increased cell
proliferation in the jejunal crypts, but decreased cell proliferation in the colonic tumors relative to controls.
2.2.4 Antidepressants and cancer cytotoxicity
2.2.4.1 In-vitro evidence
Since the first SSRI entered the American market in 1987, there has been increasing evidence that some antidepressants can induce cancer cell death or reduce their viability. More recent studies have provided biological evidence documenting mechanisms underlying the reduction of cell or tumor viability. Many of the studies support pro-apoptotic pathways [8, 13-15, 17, 43, 48, 62-64], although there is some evidence that the antidepressants may also act by modifying intracellular Ca2+ concentration [65-68], increasing immune function [69], reducing cell proliferation via p27 [11], and decreasing VEGF and Cyclooxygenase-2 (COX-2) expression [10].
Antidepressants have been shown to reduce cancer cell viability in-vitro in lung cancer cells [43], prostate cancer cells [8, 67, 68], melanoma cancer cells [20], osteosarcoma cells [70], neuroblastoma cells [15], burkitt’s lymphoma cells [14, 71], leukemia cancer cells [13] and in CRC cells [17, 48, 62, 72]. One controlled study (comparison to untreated cells) [48] ,
compared the cytotoxic ability of antidepressants (sertraline, paroxetine, fluoxetine, reboxetine) to chemotherapies (doxorubicin, 5-FU) on CRC LS1034 cells, and found that sertraline and paroxetine were superior to both doxorubicin and 5-FU with respect to cell cytotoxicity.
10
similar cytotoxic abilities on the HT29 cells to doxorubicin; however, the antidepressants induced apoptosis and minimal necrosis, whereas doxorubicin induced cell death by necrosis [48]. Necrosis is an undesirable side effect, and can result in an inflammatory response that has the potential to reverse chemotherapeutic effects. Although no single study systematically evaluated all antidepressants in all possible cell lines, there is consistent evidence of differential effects by drug, class, dose and cell line.
2.2.4.2 In-vivo evidence of antidepressant cytotoxicity
A few studies have reported that some antidepressants reduce tumor volume [12, 48, 73, 74] or the number of circulating cancer cells in a metastatic CRC animal model [12]. In an experiment comparing the cytotoxic ability of various SSRIs to 5-flourouracil (5-FU,
chemotherapy), one study[48] found that mice treated with sertraline (SSRI), and not paroxetine (SSRI) or 5-FU or control (saline solution), reduced the size of HT29 xenografted tumors in mice after 3 weeks of treatment.
2.2.4.3 Antidepressants to prevent neoplastic precursors
11
2.2.4.4 Antidepressants as chemosensitizers
Chemotherapy frequently fails due to multidrug resistance (MDR), an influx-efflux imbalance in which certain transporters remove the drug from the cancer cell thus reducing tumor cell toxicity. There is evidence that some antidepressants may increase the potency of standard chemotherapies by inhibiting the removal of the chemotherapeutic drug. For instance, fluoxetine (SSRI)-doxorubicin co-treatment significantly slowed the progression of tumors in HCT-15 xenografted mice, comparable to bevacizumab treatment [76]; the concentration of doxorubicin was higher in tumor cells of animals co-treated with fluoxetine. Another study[46] reported that desipramine (TCA) increased the cytotoxicity of all platinum based
chemotherapies against HT-116 cell lines; p53 and caspase expression increased in desipramine-cisplatin treated cells, suggesting the combination triggers apoptosis.
2.2.5 Antidepressants: Mechanisms implicated
The in-vivo and in-vitro evidence of antidepressant induced cancer cell death, the dysregulated apoptotic genes associated with their death [8, 13, 15, 17, 19, 48, 62-64, 77], the association between the dysregulated apoptotic genes and cancer etiology[78], and the role that serotonin plays in the colon, all provide strong biological rationale that some antidepressants could prevent incident CRC. Fluoxetine has been used to increase serotonin availability in mice with trinitrobenzene sulfonic acid (TNBS) induced colitis to block SERT [54]. These drugs may therefore also modify circulating serotonin and SERT in humans, thus providing a biological basis for potentially plausible mechanisms.
12
reduce tumor growth [8, 12, 48, 69, 73, 75, 81]. The apoptotic genes dysregulated in many of the studies are genes that are altered in the final stages of the carcinogenic process in the normal-carcinoma CRC sequence [82]. The evidence presented herein is very similar to the evidence that had been presented about various COX-2 inhibitors [83-86] and CRC. COX-2 is an inflammatory response that is produced in the carcinogenic process of the majority of colonic tumors, and COX-2 inhibitors reduce COX-2 expression and inflammation, a tumor-promoting feature. Predictably, aspirin only appears to reduce the risk of tumors expressing COX-2 [87]. Carcinogenesis is a multistep process and it is possible for a carcinogen or protective agent to affect multiple steps. Day and Brown[88] empirically demonstrated that smoking likely has both an early and late carcinogenic effect with respect to lung cancer.
2.2.6 Mechanisms implicated
A hallmark of cancer is its ability for unchecked cell proliferation [78, 89]; this commonly corresponds to a mutation in a tumor suppressor gene. An example of a tumor suppressor gene is p53, and mutations in this gene are very common in colorectal tumors [90, 91]. As the guardian of the genome, p53 controls both apoptosis and cell proliferation, lying upstream of p21 and the caspases. In several of the laboratory studies [8, 9, 13, 14, 19, 70], caspase-3 was frequently upregulated after exposure to certain antidepressants. One of the last genomic alterations in the progression to carcinoma in the majority of CRC tumors [90] is a p53 mutation, and it is found primarily in the well-characterized APC-KRAS-P53 adenoma – carcinoma
13
found to be dysregulated in CRC tumors are caspase-8 and caspase-9, both of which are in the apoptotic pathway. Overcoming apoptosis [78, 95, 96], and any pharmacological agent that increases apoptosis may prevent cancer progression, incidence, or decrease the likelihood of metastasis.
2.2.7 Total evidence
The laboratory evidence suggests biologically plausible mechanisms by which some antidepressants may reduce CRC development, and thus reduce CRC incidence at the
population level. These drugs could be acting at various points in the multistep process: 1) late, by acting on tumors or late adenomas 2) middle, by increasing microenvironment apoptosis which is inversely associated with adenomas [97], and 3) early, by preventing ACF. Although some of these drugs may act on multiple points in the carcinogenic process, we can only test late acting effects in this study given only seven years of data. This is akin to showing that smoking cessation immediately begins reducing the relative risk of lung cancer compared to continuing smokers[88].
2.3 Epidemiological evidence
Antidepressants are commonly prescribed drugs, with an estimated 17% of Americans aged 65+ reporting antidepressant use in a 2012 nationally representative survey [5]. The few epidemiological studies [21-26] examining the association between both SSRIs and TCAs, and CRC have produced conflicting results, and all studies compared antidepressant users to non-users.
14
increase the likelihood of tumor development in rats treated with the carcinogen, azoxymethane (AOM) [98] . Antidepressants more reliant on norepinephrine reuptake inhibition may also be less effective at reducing tumor cell viability [43, 99]. This is consistent with the evidence that beta-blockers may reduce the incidence of cancer by reducing circulating norepinephrine[100]. It is important to understand if some antidepressants may have more carcinogenic potential compared with other antidepressants, because so many cancer patients suffer from depression, and may be treated with antidepressants.
Some previous studies [21, 24] have excluded CRC cases occurring in the year
immediately following initiation to prevent protopathic bias (reverse causality). Latent CRC can cause symptoms mimicking depression, for example lethargy, weight loss, or gastrointestinal distress[101]. Thus, CRC cases diagnosed shortly after initiation of an AD may not be attributable to the AD itself, but could have been latent CRC with the physical symptoms of depression. We additionally hypothesize that high cancer incidence, if observed shortly after drug initiation, could also result from new users who have not been actively engaged with the healthcare system prior to drug initiation. These new users may thus experience a catch-up period of medical encounters, including diagnostic and cancer screening services, which we term “medicalization”.
2.3.1 Reasons for study variability
15
Epidemiologic studies examining the association between SSRIs and CRC risk have produced inconsistent findings, with three studies reporting no association [23, 24, 26], and the remaining studies reporting moderate (15%-45% reduction) inverse associations [21, 22, 25]. All studies relied on the comparison between antidepressant users to non-users or past users, which could be prone to confounding by depression. Both stress and depression may
16
Table 1: Epidemiological evidence
Paper Years Type Features Ever use definition Outcome
definition/ascertainment
Xu
2006 1991-2000
Nested case control
Saskatchewan Health, Canada Any prescription for SSRI within
10 years. Recorded in database Saskatchewan Cancer Registry, ICD-10 codes
3188 cases, 12648 population controls, risk set sampling
Coogan
2009 1995-2008 Case control
Philadelphia, US 529 case, 1955 hospital control
At least 3 months regular use, self report
Individuals reporting CRC in past year during nurses interview
Haukka
2010 1998-2005
Cohort (new user – 3 year washout)
Finland, unexposed = non-user during 1998-2005, randomly selected 1 non-user for each user, matched on birth year, sex and hospital district.
1 prescription during study period, recorded in database
Linked to Finnish cancer registry, ICD-7. Covers 99% of all cancers
Cronin-Fenton 2011
1991-2008 Case control
Denmark, 9979 cases, 99790
population control, risk set sampling Any two RX during 1991-2008, recorded in database
1st discharge dx = ICD8: 153.x-154.19, ICD10: C18.x, C19.9, C20, C20.9
Matched on birth year, sex, residence
Chubak
2011 2000-2003 Case control
WA state health plan, 649 cases, 649 controls. Matched on age, gender, time on health plan
Any 2 RX filled within 6 months during 2000-2003, recorded in
database
SEER registry linked to group health plan
Walker
2011 ? Case control
Great Britain (GPRD), 6232 cases, 12010 population controls
Defined only for TCA, but defined as > 1 prescription in the
years prior to DX
17
Table 2: Exposure assessment characteristics and variability in epidemiological studies
Paper Included cases within 1 year
of use OR/RR (95% CI)* Exposure definition used in meta-analysis [104]
Xu
2006 Yes
0.84 (0.68, 1.03) CRC
Exposure definition = Ever use definition, adjusted.
Alternatives:
Cumulative dose low: adjusted OR =0.98 (0.75, 1.30) Cumulative dose high: adjusted OR = 0.75 (0.56,1.01)
Low dose 0-5 years prior to CRC: adjusted OR = 0.96 (0.72, 1.28) High dose 0-5 years prior to CRC: adjusted OR = 0.70 (0.50, 0.96) Low dose 6-10 years prior to CRC: adjusted OR = 1.20 (0.73, 1.98) High dose 6-10 years prior to CRC: adjusted OR = 0.93 (0.55, 1.58)
Coogan
2009 No
0.55 (0.35, 0.88) CRC
Exposure definition = Any self-reported 3 month use adjusted
Alternatives CRC:
Recently initiated: adjusted OR =0.41, (0.12, 1.43) Sporadic: adjusted OR = 0.80, (0.33, 1.90)
Regular use, < 3 year, adjusted OR = 0.50, (0.20,1.17) Regular use: >= 3 years, adjusted OR = 0.58, (0.34,0.99)
Alternatives colon cancer:
Regular use: adjusted OR = 0.47 (0.26, 0.85)
Alternatives rectal cancer:
Regular use: adjusted OR = 0.72 (0.37, 1.41)
Haukka
2010 Yes
1.11(0.56, 2.21) colon cancer
Exposure definition = 1460+ DDD cumulative exposure, adjusted.
Alternatives colon cancer:
1-91 DDD, adjusted IRR = 1.39 (0.95, 2.04) 92-181 DDD, adjusted IRR = 1.29 (0.83, 2.02) 182-365 DDD, adjusted IRR = 0.81 (0.49, 1.33) 366-730 DDD, adjusted IRR = 0.85 (0.52, 1.40) 731-1460 DDD, adjusted IRR = 1.18 (0.71, 1.94)
Alternatives rectal cancer:
18
92-181 DDD, adjusted IRR = 0.78 (0.43, 1.40)
182-365 DDD, adjusted IRR = 1.17 (0.68, 2.02)
366-730 DDD, adjusted IRR = 0.94 (0.53, 1.67)
731-1460 DDD, adjusted IRR = 0.89 (0.48,1.67)
1460+ DDD, adjusted IRR = 0.83 (0.35, 1.95)
Cronin-Fenton, 2011 No
0.97 (0.90, 1.05) CRC
Exposure definition = Ever use definition, adjusted
Alternatives:
Recent use (1 -< 2 years) adjusted OR = 0.97 (0.88, 1.07) Former use (2+ years) adjusted OR = 0.97 (0.86, 1.09) Short term, low dose adjusted OR = 1.04 (0.89, 1.21) Short term, medium dose (adjusted OR = 0.98 (0.85, 1.13) Short term, high dose adjusted OR = 0.90 (0.78 1.03) Long term, low dose adjusted OR = 0.94 (0.88, 1.07) Long term, medium dose (adjusted OR = 0.97 (0.74, 1.16) Long term, high dose adjusted OR = 1.13 (0.85, 1.51)
Chubak
2011 No
0.70 (0.5-0.9) CRC
Exposure definition = Ever use definition, adjusted
Alternatives:
Duration < 2 years: adjusted OR = 0.6 (0.3, 1.1) Duration > 2 years: adjusted OR = 1.0 (0.4, 2.8)
Walker 2011
No 0.95 (0.8 1.12)
CRC
19
2.4 Claims databases and identification of incident cancers
Administrative data are increasingly being used to identify both negative and positive effects of drug exposures on the risk of cancer. Although drug exposure information from claims is reliable, claims data do not contain the same information as a cancer registry, because they are used for reimbursement, and not research purposes. Therefore, algorithms are
necessary to identify incident cancer cases in administrative data, with a specific algorithm necessary to minimize bias when we are estimating a relative effect measure [105]. Claims data are critical to answering questions that could not be feasibly ascertained within the context of an RCT or even an observational study, because certain questions require a very large sample size or do not have enough evidence to warrant an RCT, for instance Aim 2.
One of the most commonly used claims-based algorithms to identify incident cancers is from Setoguchi and colleagues [28]. She provided four definitions (Figure 1) of varying
sensitivity and specificity that were developed in individuals who were continuously co-enrolled in both Medicare and the Pharmaceutical Contract for the Elderly (PACE) program between Jan 1,1997-Dec 31, 2000. PACE provided comprehensive drug coverage, but was limited to a very low-income group of individuals. Definitions 2 and 4 rely only upon International Classification of Diseases, Clinical Modification, Ninth Revision (ICD-9) diagnosis codes, whereas definitions 1 and 3 incorporate diagnosis, procedure and treatment events. Time, income and continuous enrollment criteria contribute to this source population inadequately representing a more economically diverse and contemporary Medicare population.
20
years] than for colon cancer [71 years] [1], suggestive of etiological heterogeneity. Thus, there may be instances where an investigator wants to distinguish between the association between a particular drug exposure and colon cancer or rectal cancer.
Figure 1: Incident cancer identification algorithms.
These algorithms were validated in the 1997-2000 PA/PACE population. See APPENDIX B for diagnoses and procedure codes used.
2.5 Epidemiology of CRC
21
2.5.1 Broad molecular classifications of colorectal cancer
Although there have been efforts to more precisely characterize genomic features of all CRC tumors [108-110], there are currently only two universally recognized molecular subtypes: The chromosomal instability phenotype (CIN) and the Microsatellite Instable (MSI). The CpG Island methylator phenotype (CIMP) is becoming more commonly recognized as a distinct group, but it is not mutually exclusive of the other groups such that CIMP tumors may be MSI or Microsatellite Stable (MSS) [47, 111-113]. It is estimated that 85% of all tumors are CIN and the remaining 15% are MSI [112, 114]. Additionally, MSI and CIMP tumors are not consistently categorized as yes or no, but are often classified according to the degree of MSI or methylation in tumors. These tumors may be further stratified into MSI-H, MSI-L, MSS and H, CIMP-L. Other features that are used to classify tumors and provide insight into etiology are: tumor genetic mutations, location of the tumor [115], response to therapy [47, 116, 117], and the mutation rate[91].
Corresponding to these molecular subtypes, mutations and physical characteristics, are at least two or more distinct pathways by which normal tissue develops into carcinoma: the adenoma pathway [92] and the serrated pathway [47, 109, 118-120].
2.5.1.1 Highly Penetrant Hereditary Disorders
22
2.5.1.2 Lynch Syndrome
Lynch Syndrome is the most common hereditary disorder that predisposes a person to develop CRC, accounting for approximately 2%-4% of all incident CRC cases. Individuals with this syndrome have a 50-80% probability of developing CRC in their lifetime [121]. These cases are defined by a germ-line mutation in one of the mismatch repair (MMR) genes, including: MLH1, MSH2, MSH6 and PMS2, with the majority of mutations occurring in the MLH1 and MSH2 genes. These genes are responsible for correcting single base-pair errors during replication. In the context of Lynch syndrome, this damage is manifested by microsatellite instability (MSI) in the tumor. Lynch Syndrome is diagnostically confirmed by evaluating MSI, MMR gene staining and BRAF V600 mutation. A BRAF V600 mutation is an exclusion criteria for Lynch Syndrome, and the case is considered sporadic CRC
(www.arupconsult.com/Algorithms/Lynch.pdf). These tumors may however have KRAS
mutations. Tumors with MSI may not be as responsive to chemotherapy [123]. Although these individuals do not have more polyps than the average sporadic case, the aberrant MMR system accelerates the carcinogenic process such that it may only take 2-3 years to move from a small lesion to carcinoma [111]
2.5.1.3 Familial adenomatous polyposis
Familial Adenomatous Polyposis (FAP) is a highly penetrant inherited disorder
23
evolving through the classic adenoma-carcinoma sequence [92, 93]. FAP cases are characterized by chromosomal instability (CIN), which manifests itself by aneuploidy and is detected with karyotyping.
2.5.1.4 Sporadic cases
24
2.5.2.5 MSI
Approximately 15% of tumors are MSI. Like Lynch syndrome, sporadic MSI cases are characterized by microsatellite instability, but they differ from Lynch syndrome in that they do not have a germ line mutation in a MMR gene. Gene function of MMR genes is generally inactivated by methylation at the promoter region of MLH1. These tumors are more likely to occur in women, are generally found on the right/proximal colon, are poorly differentiated, larger, and less likely to have lymph node involvement or metastasize. Survival is generally longer despite larger, poorly differentiated tumors. P53 mutations are less common in these tumors than in CIN tumors.
Categorization of MSI is still evolving and some groups propose the use of more MSI categories including MSI-H (high), MSI-L (low) and MSS instead of MSI (yes/no) [108, 124] . Cut points for H includes 40% of markers demonstrating MSI, 20%-40% is considered MSI-L and 0% is considered Microsatellite stable (MSS).
2.5.1.6 CIMP
CIMP tumors are sporadic cases without clear classification guidelines, but are broadly defined as tumors with substantial methylation at the promoter regions of particular genes. Some of the genes that are frequently used to classify as CIMP are CACNA1G, CRABP1, NEUROG1, CDKN2A, and MLH1[125]. CIMP tumors can be MSI high, MSI low or MSS[108, 126]. They commonly have a BRAF location[113], and are thus less likely to have a KRAS mutation since these mutations are generally mutually exclusive.
25
2.5.2 CRC Risk and protective factors
2.5.2.1 Demographic risk factors
Except for individuals genetically predisposed to CRC (Lynch syndrome, FAP), CRC is rare in younger persons, and 90% of incident cases occur in persons older than 50 years of age[1], with the majority of cases being sporadic [121]. The median age of diagnosis is 68 overall, although this varies by race and gender, with males having a younger median age of diagnosis than females, and blacks having a younger median age of diagnosis than other races. Median age of diagnosis also varies between colon [71 years] and rectal cancer [64 years]. The overall incidence in individuals over the age of 65 is 225 per 100,000 persons.
2.5.2.2 Behavioral/Lifestyle risk factors
26
Table 3: Summary of CRC risk factors
Risk Factor Magnitude of association/other
Alcohol [128]
Dose response
RR = 1.07, 95% CI = (1.04, 1.10) comparing 10 grams/day to none RR = 1.82, 95% CI = (1.41, 2.35) comparing 100 grams/day to none
Effects stronger in men than women and in Asians compared to other groups.
Smoking [106]
Ever versus never smokers (26 studies; RR = 1.18, 95% CI = (1.11, 1.26)) North America; 13 studies; RR = 1.18, 95% CI = (1.10, 1.26)
Rectal cancer; 10 studies; RR = 1.25, 95% CI = (1.14, 1.38) in ever versus never Colon cancer; 10 studies; RR = 1.12, 95% CI = (1.04, 1.21) in ever versus never Rectal cancer; 25 studies, RR = 1.11, 95% CI = (1.00, 1.23) in current versus never Colon cancer; 25 studies, RR = 1.00, 95% CI = (0.91, 1.10) in current versus never Men; 10 studies; RR = 1.18, 95% CI = (1.07, 1.31)
Women; 11 studies; RR = 1.14, 95% CI = (1.03, 1.25)
Body Mass Index/Waist Circumference
Positive association (RR = 1.33, (95% CI = 1.25, 1.42) between BMI and CRC, comparing obese to normal weight individuals in meta analysis (N=41 studies) [129]
Strong association (RR = 1.46, 95% CI = 1.33, 1.60; N= 13 studies) between waist circumference—a measure of central adiposity—and incident cancer, comparing those in the highest versus lowest category of waist circumference [129]
Johnson 2013 reported a 1.10, 95% CI = (1.08, 1.12) for each 8-unit increase in BMI.
27
Diet – Red meat/processed
meat
Convincing evidence supporting the positive association between red meat and processed meat consumption [131], and both colon and rectal cancers [132].
21 studies [133] (14 on red and processed meat; 13 on red meat; 13 on processed meat)
RR = 1.22, 95% CI = (1.11,1.34) for CRC comparing those with the highest versus lowest intake of red or processed meat,
RR = 1.14, 95% CI = (1.04,1.24) for every 100 gram/day intake of red or processed meat. There was a linear positive association up until 140 g/day, and above 140 grams/day, the association plateaued.
Insulin Resistance/Diabetes
[134]
Moderate positive association in both European (N=10), RR = 1.47, 95% CI = (1.20, 1.80) and North American (N=14), RR = 1.21, 95% CI = (1.16, 1.26) studies between Diabetes Mellitus (DM) and CRC.
Inflammatory disorders
A Pooled standardized incidence ratio = 2.4, (95% CI = 2.1,2.7) for ulcerative colitis (UC) of population based cohort studies in the U.S. and Europe [135]. The association was slightly stronger in males and among individuals diagnosed with UC at a young age.
Johnson et al [136] : RR = 2.93, 95% CI = 1.79, 4.81
Family History and Genetics
~20-30% of sporadic cases have a hereditary component [121].
Dose response with the number of affected family members, and risk increasing from 3rd to 2nd to 1st degree
relatives [137].
Individuals with a 1st relative, RR = 1.90, 95% CI = (1.61, 2.02) [136]
Previous
Adenomas/CRC ~ > 70% of all carcinomas go through the adenoma pathway[119], and as such previous adenomas are a strong risk factor for carcinoma.
Other
28
Table 4: Summary of protective factors
Protective Factor Magnitude of association/other
Physical activity
Physical activity and CRC in men (RR = 0.76, 95% CI = 0.72, 0.81) and women (RR = 0.79, 95% CI = 0.71, 0.88) [139].
Inverse association between physical activity and adenomas [140]. Association was stronger for more advanced adenomas (RR = 0.70, 95% CI = 0.56, 0.88).
Potential mechanisms: improved immune function [141], by reducing BMI or insulin resistance, or by the inverse association between physical activity and certain behaviors: smoking/alcohol consumption.
Hormone replacement therapy
(HRT)
Cancer Prevention Study II [142]: stronger protective results among current estrogen only users (RR = 0.76, 95% CI = 0.59, 0.97) compared with estrogen + progesterone formulations (RR = 0.93, 95% CI = 0.70, 1.23),
Protective effects stronger for rectal cancer cases among current estrogen only users (RR = 0.59, 95% CI = 0.34, 1.01) compared with CRC cases among estrogen only users (RR = 0.81, 95% CI = 0.61,1.08).
Time dependent dose response reduction of CRC cases among estrogen only users
The Women’s Health Initiative (WHI) [143] 93,651 from an observational study, an RCT of 16,590 evaluating estrogen + progesterone, an RCT of 10,722 individuals evaluating an estrogen only formulation, and an additional 40,785 participants in a diet study.
Stronger protective effect for rectal cancer, HR = 0.57, p < 0.001 compared to colon cancer, HR = 0.70, 95% CI = (0.62, 0.80).
No statistical association at p < 0.10 for the type of HRT, or duration of use in the two RCTs.
European Prospective Investigation into Cancer and Nutrition (EPIC) [144].
29
Diet - Calcium
8% decreased risk associated with a 300 mg/day increase in calcium intake (N = 20 prospective studies (134))
15% reduction in relative risk for each 400 g/day of dairy product consumption N=19 studies (135).
1000-2000 mg/day of calcium supplementation is associated with a 20% reduction in the risk of colorectal adenomas among individuals with a history of colorectal polyps [145, 146].
Plausible mechanisms: 1) calcium may reduce cell proliferation by modulating cell signaling [147, 148] 2) calcium may modify the expression of the APC/BCatenin pathway in the normal mucosa of adenoma patients [149]. APC/B-catenin genetic mutations are early events (associated with early adenomas) in the multi-stage process of colorectal carcinogenesis[82]
Diet – Vitamin D Evidence described as limited and suggestive [131]. Vitamin D, like calcium, is found in milk and dairy products, although much of vitamin D is obtained through ultraviolet irradiation.
Diet - Fiber
Evidence as probable that fiber intake was associated with a decreased risk of CRC despite inconsistent findings [131].
10% relative risk reduction for CRC associated with 10g of total fiber intake/day in meta-analysis of 25 studies [150]. The risk reduction was variable over the source of fiber.
Diet - other Other potentially protective factors include: folic acid, selenium and others. Non selective
anti-inflammatories (NSAIDS)/aspirin
Aspirin and NSAID use is associated with a decreased risk of adenomas and CRC in both average risk and higher risk individuals.
NSAID use is associated with longer survival among CRC patients [151, 152]
30
2.5.3 Heterogeneity of risk factors and CRC subtypes
31
Table 5: Heterogeneity of CRC risk factors
Risk factor Heterogeneity associations
Smoking
Iowa Women’s Health Study [153]
Ever smoking was associated with a moderate increased risk of any incident CRC compared with never smoking, (RR = 1.18, 95% CI = 1.05, 1.35)
Stronger association comparing current smokers to never smokers for the risk of: MSI-high tumors (RR = 1.99, 95% CI = 1.26, 3.14), CIMP+ tumors (RR = 1.88, 95% CI = 1.22, 2.90) and BRAF mutated tumors (RR = 1.92, 95% CI = 1.22, 3.02).
No association between ever and never smokers and incident MSS/MSI-low tumors (RR = 1.00, 95% CI = 0.79, 1.25), CIMP-negative tumors (RR = 1.02, 95% CI = 0.81, 1.30), BRAF wild-type tumors (RR = 1.00, 95% CI = 0.65, 1.27).
Aspirin
Nurses’ Health Study and the Health Professionals Follow-Up Study [154]
Inverse association between aspirin and CRC only applied to BRAF wild-type tumors (HR = 0.73, 95% CI = 0.64, 0.83) and not to BRAF mutated tumors (HR = 1.03, 95% CI = 0.76, 1.38).
Association between aspirin and wild-type BRAF tumors became stronger as frequency of use increased, whereas the association remained null between aspirin and BRAF mutated tumors regardless of frequency the frequency of use.
Aspirin is also only associated with a reduced risk of CRC among tumors expressing COX-2 [87].
Aspirin and post-diagnosis survival [152]
HR = 0.39, 95% CI = 0.20, 0.76) for COX-2 expressing tumors versus HR = 1.22, 95% CI = 0.36, 4.18 for tumors not expressing COX-2
Aspirin and recurrence [154, 155]
Reduced recurrence among individuals with PIK3CA-mutant tumors (HR = 0.11, 95% CI = 0.001, 0.832), not PIK3CA wild-type tumors (HR = 0.92, 95% CI = 0.60, 1.42),
32
Other
Higher alcohol consumption, and red or processed meat consumption appear to be associated with mutations or methylation in the promoter region of the APC gene [156].
>= 5 years of Hormone therapy is inversely associated (RR = 0.50, 95% CI = 0.27, 0.95) with high P53 expression [156].
33
2.5.3.1 Why heterogeneity matters
The evidence between antidepressants and incident CRC appears to be drug/cell line dependent and there is evidence to suggest that the drug or drug class will not behave uniformly across all cancers. This fact should temper any conclusions we may be tempted to draw from potential results. For instance, maybe some of these drugs only act to prevent MSI tumors. These tumors only comprise 15% of all tumors and our results will reflect the distribution of tumor subtypes in our population. Additionally, tumor subtypes vary by population. If, for
34
CHAPTER 3: METHODS
3.1 Study design and population
3.1.1 Aim 1, Aim 2
For Aim 1 we will conduct a new user [27], cohort study of exclusive (class
monotherapy) initiators of SSRIs, TCAs, SNRIs or AHT excluding beta-blockers, using a 20% random sample of Medicare beneficiaries aged≥66 years from 2007-2013 with simultaneous fee-for-service (FFS) parts A, B, and D (drug) coverage for at least one month during a calendar year. We chose AHT, excluding beta-blockers, as our negative control exposure, because there is no compelling evidence that their use is associated with CRC risk, and we anticipated a substantial number of initiators. We excluded beta-blockers, because there is evidence that their use could reduce cancer risk [100].
For Aim 2 we will conduct an active comparator, new user [158], cohort study of initiators of specific SSRIs (citalopram, escitalopram, fluoxetine, paroxetine, sertraline) using a 20% random sample of Medicare beneficiaries aged≥66 years from 2007-2013 with simultaneous fee-for-service (FFS) parts A, B, and D (drug) coverage for at least one month during a calendar year. Active comparator studies have been shown to reduce confounding by indication,
because initiators of the drug of interest and initiators of an alternative drug initiated for the same indication, are generally more similar across measured and unmeasured characteristics than patients who do not initiated a similarly indicated medication [159, 160]. New user designs remove time-related biases to which observational drug-cancer studies are susceptible [161].
35
concurrent fee-for-service Medicare parts A, B, and D coverage in at least one month during the calendar year, regardless of gender, race or geographic location. This data source is ideal for our study because it contains a large, representative sample of Americans aged 66+ years, the population is generally followed from entry at age 65 until death, the incidence of CRC in this population is high (225 per 100,000 persons) [1], and exposure assessment—antidepressant use—is reliable.
Medicare Part A includes claims for inpatient services and hospitalizations. We will use this information for procedures associated with colon or rectal cancer treatment. These
procedures will be used to identify incident cases. Medicare Part B includes claims for
outpatient services and preventive procedures such as cancer screenings. Treatment for colon or rectal cancer is commonly performed in the outpatient setting. We are using treatment and screening procedures to identify incident cases. Medicare Part D includes claims for all filled (dispensed) prescriptions. This information will be used to define our cohorts.
3.1.2 Aim 3
36
3.1.2.1 Case selection and data linkage
We identified all colon or rectal cancer cases age 65+ at diagnosis in the NCCCR from July 1, 2006-December 31, 2009 that were linkable to NC Medicare enrollment and beneficiary files. We then further required that all cases had ≥13 months of continuous enrollment in Medicare parts A/B at any point between Jul 1, 2006 and Dec 31, 2009, having at least one claim to ensure benefit utilization. Finally we restricted to first and primary colon or rectal cancer cases using the sequence id variable that is part of the cancer registry. The NCCCR has a gold star rating from the association of cancer registries [163]. This rating is only given to those registries with timely and >= 95% case ascertainment [164].
3.1.2.2 Non-case selection criteria
We identified all NC Medicare beneficiaries, not appearing in the cancer registry, who were continuously enrolled for 13+ months in Medicare parts A/B at some point between Jul 1, 2006-Dec 31, 2009, were aged 65+, and had at least one in or outpatient claim in order to ensure benefit utilization. We then randomly selected 150,000 of these non-cases meeting cohort criteria.
3.1.2.3 Main validation cohort
We will not require continuous enrollment during the entire study period (Jul 1, 2006-Dec 31, 2009), but instead will create a series of continuous enrollment windows of a smaller size, thereby capturing a less select, and more representative, 65+ Medicare beneficiary.
Rationale for dynamic enrollment periods
37
especially those such as CRC that go through a series of events from screening, diagnosis to treatment, require a minimum period of time to fully “diagnose” an incident CRC case within claims data. This pattern of series of events should vary by cancer type, based on screening and treatment guidelines. Therefore, there is a minimum period of time that is necessary to follow an individual who becomes a true incident case. In order to loosen the continuous enrollment criteria previously imposed, and consider cases in their pre-diagnosis non-case status, pre and during diagnosis incident case status, and post-diagnosis prevalent case status, we will create a series of cohorts that move over time. Cases can move from pre-diagnosis non-case status to pre/during incident-case status, and thus in and out of the cohort, depending where in time they are relative to the registry diagnosis date.
A complete window
38
Figure 2: Hypothetical example, series of observation windows.
An individual that is diagnosed with colon cancer contributes information as a non-case in windows 1 and 2, and as a case in windows 4 and 5. There is not enough information to adequately ascertain case status of this individual in windows 3 and 6.
Calculation of pre-buffer size
We will calculate for each CRC case the mean amount of time in days between the registry diagnosis date and all dates of diagnostic-associated procedures (e.g. colonoscopy), (APPENDIX C) occurring within 365 days of the registry diagnosis date. We will then calculate the earliest 1% of the distribution of these mean days, corresponding to the largest 99th
39 Calculation of post-buffer size
We will calculate for each CRC case the mean amount of time in days between the registry diagnosis date and all dates on which a treatment code was observed (e.g.,
chemotherapy, APPENDIX C), occurring within 365 days of the registry diagnosis date. We will use the 99th percentile of the distribution of these mean days as the post-buffer size. This corresponds to the largest 99th percentile of the mean amount of time in days between registry diagnosis dates and treatment events. We will exclude all cases and associated claims whose registry diagnosis date fell within this post-buffer window, or between the end of the primary 365-day window plus the post-buffer time in days.
3.2 Exposure ascertainment and Inclusion criteria (Aim 1, Aim 2)
For Aim 1 all cohort members must be aged 66+ at the date of the first observable, dispensed prescription for an SSRI, SNRI, TCA, or AHT, and have ≥ 360 days of continuous enrollment in Medicare Parts A and B prior to the first (SSRI, SNRI, TCA, AHT) prescription to evaluate baseline covariates and clinical factors. Initiators will have ≥180 days of continuous part D enrollment, and no claims for an SSRI, SNRI, TCA, or AHT prior to the first prescription to restrict to “new” users of the medication class. They will have no diagnoses or treatments associated with CRC in claims during thebaseline assessment period to exclude prevalent cases, and a second claim for a medication within the same class as the initial claim occurring within the days’ supply of the first claim date plus a grace period of 60 days. We chose 60 days as a grace period because initiators of these medication classes frequently augment or switch between drugs within the class. We used National Drug Codes (NDC) associated with
formulations for the generic drugs of interest to classify cohort members. The date of cohort entry was the date the second prescription was dispensed.
40
B prior to the first SSRI prescription to evaluate baseline covariates. They must have at least 180 days of part D and no claims for an SSRI prior to the first prescription to restrict to “new” users of the medication, and no evidence of CRC (only CRC, not other cancer sites) in the baseline assessment period to exclude potentially prevalent events (identified with International Classification of Diseases, Clinical Modification, Ninth Revision (ICD-9) diagnosis codes or current procedural terminology codes (CPT)). We are only excluding potentially CRC cases, because other cancer sites do not commonly metastasize to the colon [165]. Finally, we require a second prescription claim within the day’s supply of the first claim plus a grace period of 30 days to allow for imperfect adherence. The second claim requirement increases the likelihood that the initiator was adherent for a meaningful exposure period. We used National Drug Codes (NDC) associated with formulations for the following generic drug names to generate the new user cohorts: citalopram, escitalopram, fluoxetine, fluvoxamine, paroxetine, sertraline. The date of cohort entry was the date the second prescription was dispensed.
3.3 Outcome ascertainment (Aim 1, Aim 2)
41
group, ‘b’ is the total number of persons or person-time in the exposed group, ‘d’ is the total number of events in the unexposed group. We also then assume that ‘b’ is some proportion ‘q’ of ‘d’ and ‘p’ is the proportion of individuals falsely classified as cases.
The unbiased risk ratio = (a/b)/(c/d) = (a/q*d)/(c/d) = [a/(q*c)]
At non-perfect specificity, the risk ratio becomes: [a+ p*b] /[q*(c+p*d)]
The above equation is only unbiased when p or the proportion of falsely misclassified non-cases is 0, perfect specificity, or when the unbiased ratio is 1.
3.4 Covariate assessment (Aim 1, Aim 2)
For both Aim 1 and Aim 2 we will covariates using claims for the 360 days preceding the date of the first prescription claim for an SSRI, SNRI, TCA, or AHT.
Demographic information available in the baseline assessment period included: race (White, Non-Hispanic, Black, Non-Hispanic, Hispanic, Asian, Native American/Pacific Islander or Other), sex, and age at the first prescription (coded as a continuous variable).
ICD-9 diagnosis and procedure codes, Current Procedural Terminology (CPT) codes, or Healthcare Common Procedure Coding System (HCPCS) codes present in any claim during the baseline assessment period were used to identify clinical factors and comorbidities at the time of SSRI, TCA, SNRI or AHT medication initiation. These covariates included: any potential non-CRC cancer diagnosis (e.g., breast cancer), obesity status, diabetes mellitus type 2, chronic obstructive pulmonary disease—a proxy for current or past smoking [166], inflammatory
42
anti-inflammatory drugs were identified as having ≥1 claim for a drug in the class in the baseline period.
3.5 Confounding control (Aim 1, Aim 2)
Although evidence suggests that more conventional multivariable methods produce similar results to propensity score methods, there are advantages to their use [167]. In an observational study, propensity scores (PS) can be used to balance measured and unmeasured covariates, thereby reducing the risk of unmeasured confounding [168-170]. We will use known and available risk factors for CRC to generate propensity scores[171]. A benefit of PS is that they enable a visual inspection of overlap between the treatment groups. This overlap for the propensity of treatment allows identification of individuals who would never be eligible for other treatments. This is important because confounding by indication (e.g. depression) may exist, and it is plausible that TCA users may be inherently different than SSRI or SNRI users.
3.5.1 Aim 1 confounding control
43
active comparator and we need to evaluate the extent to which AD and AHT initiators differ at cohort entry, and how well covariates were balanced after SMRW.
3.5.2 Aim 2 confounding control
We will control confounding using a propensity score (PS) weighting approach such that the distributions of measured covariates in the non-referent groups (escitalopram, fluoxetine, paroxetine, sertraline) are weighted to the covariate distribution of the referent group of citalopram initiators. Citalopram was chosen as the referent group because it has the largest number of initiators. The goal of PS weighting is to balance covariates across treatment groups and estimate the unconfounded associations between specific SSRIs (compared with
citalopram) and incident CRC. We will run four separate logistic regression models to estimate the PS of initiating each non-referent SSRI drugs versus citalopram based on measured
covariates. We will then weight the non-referent initiators to the baseline covariate distribution of the citalopram initiators with (1-PS)/PS, a variant of standardized morbidity ratio weighting (SMRW) when there are more than two non-referent groups [173]. Citalopram initiators will be given a weight of 1.
3.6 Person-time at risk Aim 1, Aim 2
For both aim 1 and aim 2, we implemented a variation of the “disease induction” and “latent” concepts defined by Rothman [174] to specify person-time at risk. The induction is the time from the start of a specific exposure from which malignant transformation begins until the detection of cancer, whereas the latent period is the time in which a cancer is present but not yet detected. It is impossible to precisely identify when cancer induction has ended and latent period begun. Therefore we commonly merge the two concepts into the term “empirical
44
CRC is thought to evolve through a series of genomic and physical changes over a period of years [93]. We hypothesized that SSRIs may have effects that are observable during the later stages of carcinogenesis by preventing the transition of an adenoma to a carcinoma. We also assumed that there would be some minimum time after drug initiation before
observable effects could reasonably be expected to occur (empirical induction, immune time). We set this interval to 180 days after the second prescription, and thus person-time and cases began to accrue 180 days after the second prescription.
We continued to follow individuals for up to 90 days after drug discontinuation or augmentation to account for cases that may be attributable to drug use, but whose tumor remained undetected at SSRI cessation. We censored individuals at the earliest of: the date of the last prescription plus the days’ supply plus a grace period to allow for imperfect adherence (Aim 1 or Aim 2) or drug switching (Aim 1) plus 90 days; date of death; date of Medicare parts A, B or D disenrollment, or the end of the study period (12/31/2013). Figures 3, 4 illustrate general conceptualization of cohort entry and exit.