https://openaccess.leidenuniv.nl
License: Article 25fa pilot End User Agreement
This publication is distributed under the terms of Article 25fa of the Dutch Copyright Act (Auteurswet) with explicit consent by the author. Dutch law entitles the maker of a short scientific work funded either wholly or partially by Dutch public funds to make that work publicly available for no consideration following a reasonable period of time after the work was first published, provided that clear reference is made to the source of the first publication of the work.
This publication is distributed under The Association of Universities in the Netherlands (VSNU) ‘Article 25fa implementation’ pilot project. In this pilot research outputs of researchers employed by Dutch Universities that comply with the legal requirements of Article 25fa of the Dutch Copyright Act are distributed online and free of cost or other barriers in institutional repositories. Research outputs are distributed six months after their first online publication in the original published version and with proper attribution to the source of the original publication.
You are permitted to download and use the publication for personal purposes. All rights remain with the author(s) and/or copyrights owner(s) of this work. Any use of the publication other than authorised under this licence or copyright law is prohibited.
If you believe that digital publication of certain material infringes any of your rights or (privacy) interests, please let the Library know, stating your reasons. In case of a legitimate complaint, the Library will make the material inaccessible and/or remove it from the website. Please contact the Library through email: [email protected]
Article details
Aalbers G., McNally R.J., Heeren A., De Wit S. & Fried E.I. (2018), Social Media and Depression Symptoms: A Network Perspective, Journal of Experimental Psychology : General : 1-9.
Social Media and Depression Symptoms: A Network Perspective
George Aalbers
University of Amsterdam
Richard J. McNally
Harvard UniversityAlexandre Heeren
Université Catholique de Louvain
Sanne de Wit and Eiko I. Fried
University of AmsterdamPassive social media use (PSMU)—for example, scrolling through social media news feeds— has been associated with depression symptoms. It is unclear, however, if PSMU causes depression symptoms or vice versa. In this study, 125 students reported PSMU, depression symptoms, and stress 7 times daily for 14 days. We used multilevel vector autoregressive time-series models to estimate (a) contemporaneous, (b) temporal, and (c) between-subjects associations among these variables. (a) More time spent on PSMU was associated with higher levels of interest loss, concentration problems, fatigue, and loneliness. (b) Fatigue and loneliness predicted PSMU across time, but PSMU predicted neither depression symptoms nor stress. (c) Mean PSMU levels were positively correlated with several depression symptoms (e.g., depressed mood and feeling inferior), but these associations disappeared when controlling for all other variables. Altogether, we identified complex relations between PSMU and specific depression symptoms that warrant further research into potentially causal relationships.
Keywords:social media, depression, loneliness, stress, network analysis
Supplemental materials:http://dx.doi.org/10.1037/xge0000528.supp
In the past decade, social media such as Facebook and Twitter have become central to everyday life. Despite their popularity, controversy abounds regarding their impact on mental health (Twenge, 2017). Although some studies have shown that social
media use is associated with beneficial effects (e.g., higher self-esteem; Gonzales & Hancock, 2011), others have identified po-tential negative effects on well-being via the promotion of stress (Meier, Reinecke, & Meltzer, 2016), loneliness (Liu & Baumeis-ter, 2016), and depression symptoms (Appel, Gerlach, & Crusius, 2016).
Social media’s adverse effects may come from passive social media use (PSMU)—that is, scrolling through news feeds or brows-ing photographs of friends. Experimental research has shown that PSMU decreases affective well-being (Verduyn et al., 2015), sense of belonging (Tobin, Vanman, Verreynne, & Saeri, 2015), and life satisfaction (Wenninger, Krasnova, & Buxmann, 2014). Furthermore, cross-sectional research indicates that PSMU positively correlates with depressed mood (Frison & Eggermont, 2016). As depressed mood is a core symptom of and a strong predictor of depression (Boschloo, van Borkulo, Borsboom, & Schoevers, 2016), this obser-vation suggests that PSMU may constitute a risk factor for depression. To investigate this possibility, we assessed the link between PSMU and depression symptoms from a network perspective.
According to the network perspective on psychopathology, de-pression is a complex, dynamic network of symptoms that cause each other (Borsboom, 2017). Consider the example of a divorced man who, ruminating about his romantic loss, cannot sleep for days and grows tired as time wears on. He descends into a state of hopelessness and anhedonia, causing him to withdraw from social life and alienate his loved ones. At night, he worries about his problems, causing more stress and sleep loss. As illustrated by this example, the network perspective posits that external conditions, such as stress (Fried, Nesse, Guille, & Sen, 2015), could trigger symptoms that activate other symptoms. Therefore, from a
net-George Aalbers, Department of Clinical Psychology, University of Amster-dam; Richard J. McNally, Department of Psychology, Harvard University; Alexandre Heeren, Department of Psychological Sciences Research Institute and Institute of Neuroscience, Université Catholique de Louvain; Sanne de Wit, Department of Clinical Psychology, University of Amsterdam; Eiko I. Fried, Department of Psychological Research Methods, University of Amster-dam.
Eiko I. Fried is now at the Department of Clinical Psychology, Leiden University.
We thank Payton J. Jones, Olivia Losiewicz, and Sacha Epskamp for their comments on this study. The research design and findings in this article have been discussed in the authors’ lab meetings (McNally Laboratory, Richard J. McNally; Habit Lab, Sanne de Wit) and orally presented to a student audience at the University of Amsterdam. Data, materials, and findings have not been shared online prior to resubmitting the revised article. George Aalbers devel-oped the study concept under the supervision of Richard J. McNally, Eiko I. Fried, Sanne de Wit, and Alexandre Heeren. All authors contributed to the study design. Data collection and analysis, and interpretation of results were performed by George Aalbers under the supervision of Eiko I. Fried. George Aalbers drafted the article, and all other authors provided critical revisions. All authors approved the final version of the article for submission.
Correspondence concerning this article should be addressed to George Aalbers, who is now at the Nederlands Psychoanalytisch Instituut (NPI), Domselaerstraat 128, 1093MB Amsterdam, the Netherlands. E-mail: h.j.g [email protected]
This
document
is
copyrighted
by
the
American
Psychological
Association
or
one
of
its
allied
publishers.
This
article
is
intended
solely
for
the
personal
use
of
the
individual
user
and
is
not
to
be
disseminated
broadly.
© 2018 American Psychological Association 2018, Vol. 1, No. 999, 000
0096-3445/18/$12.00 http://dx.doi.org/10.1037/xge0000528
work perspective, PSMU could function as a depression risk factor if it triggers individual depression symptoms (e.g., depressed mood) or conditions (e.g., stress) that trigger other depression symptoms.
Previous research points to several pathways from PSMU to depression symptoms. First, PSMU could worsen symptoms (i.e., depressed mood and loss of interest) by undermining affective well-being (Verduyn et al., 2015). Furthermore, PSMU may re-duce a sense of belonging (Tobin et al., 2015) that predicts lone-liness (Mellor, Stokes, Firth, Hayashi, & Cummins, 2008). By indirectly increasing loneliness, PSMU could increase depression symptoms (Fried et al., 2015) and stress (DeBerard & Kleinknecht, 1995), and, in turn, stress may ultimately reinforce depression symptoms (Fried et al., 2015). Finally, by exposing individuals to the highly curated lives of their social media contacts—who (on average) seem happier and more popular than themselves (Bollen, Goncalves, van de Leemput, & Ruan, 2017)—PSMU could in-crease feelings of inferiority (Appel, Crusius, & Gerlach, 2015), leading to increases in depression symptoms (Blease, 2015).
Conversely, depression symptoms, loneliness, and stress might increase PSMU. Longitudinal evidence demonstrates that loneli-ness predicts more social media use (Kross et al., 2013). Further-more, as individuals use the Internet to alleviate depressed mood and loneliness (LaRose, Lin, & Eastin, 2003), it is conceivable that they also use social media to do so. Although researchers have not assessed directly whether PSMU ameliorates depression symp-toms and loneliness, social media users do report that they use PSMU to reduce stress and to relieve boredom (Whiting & Wil-liams, 2013), which is positively associated with loss of interest (Goldberg, Eastwood, LaGuardia, & Danckert, 2011). Finally, repeated PSMU to reduce aversive states may become habitual. By that point, aversive states could trigger PSMU automatically and outside awareness (LaRose, 2010). Accordingly, we hypothesized that PSMU increases depression symptoms, loneliness, and stress, and vice versa.
We instructed participants to report social media use, depression symptoms, loneliness, and stress seven times a day for 14 days. From this high-intensive time-series dataset, we estimated three types of network structures:contemporaneous associations, rep-resenting how variables are associated within the same timeframe (e.g., associations between depressed mood and fatigue within a timeframe of 2 hr; these likely reflect fast-moving temporal pro-cesses occurring at a time interval quicker than the sampling interval; Epskamp, Waldorp, Mõttus, & Borsboom, 2018); tempo-ral associations, representing how variables are associated from one time point to next (e.g., fatigue predicts depressed mood during the next timeframe; such temporal prediction satisfies the temporal requirement for causation—i.e., that causes must precede effects—which means that temporal associations could suggest potential causal pathways between variables); and between-subjects associations, representing how within-person mean levels of variables are associated on a larger time-scale (e.g., mean level of fatigue across participants relates to the mean level of loss of interest). Investigating networks by using this threefold framework has become standard practice, and allows complementary views of the data (e.g., Epskamp, Borsboom, & Fried, 2018; Epskamp et al., 2017). We expected that PSMU, depression symptoms, loneliness, and stress would be interconnected by positive temporal and contemporaneous associations, and included between-subjects
as-sociations to explore whether, on average, participants with higher levels on PSMU were also higher on depression symptoms, lone-liness, and stress.
Method
Participants
We recruited undergraduate psychology students (N!132; 91 females, 41 males) via an online study participation platform. A priori power analysis has not yet been developed for the analytic approach used here, so we tried to collect as many participants as possible within the timeframe of 3 months for George Aalbers’s master’s thesis. Notably, the sample size is larger than many recently published studies using the same methodology (e.g., De-Jonckheere et al., 2017; Pe et al., 2015). Prior to data analysis, we excluded seven participants who failed to respond to a minimum number of measurements ("29 out of 98), a cut-off that we chose after consulting with an experience sampling methodology (ESM) expert (M.C. Wichers, personal communication, May 15, 2017). Included participants (N!125; 87 females, 38 males) had a mean age of 20.44 years (SD!1.96) and completed an average of 66.18 measurements (SD ! 15.10), with a range between 29 and 92. Participants received research credits required to complete their curriculum’s mandatory study participation.
Procedure
At fixed times, participants received prompts on their smart-phones to complete a 12-item questionnaire (measuring PSMU, depression symptoms, loneliness, and stress) seven times daily for 14 days. We used the LifeData Company’s RealLife Exp app (https://www.lifedatacorp.com/) to prompt participants and collect data (Runyan et al., 2013). We chose to separate measurements by brief intervals (#2 hr) to investigate subtle dynamical interplay among the measured variables. During an initial one-on-one in-structional session with each participant, George Aalbers demon-strated the smartphone app and defined PSMU as: “You are using social media without commenting, posting, sharing, or chatting— that is, you are scrolling through the news feed, looking at photos, videos, and status updates shared by your social media contacts or public profiles that you follow.” This procedure was approved by the University of Amsterdam’s Institutional Review Board.
Materials
We constructed a 12-item questionnaire for the present ESM study. To minimize participant burden, we prioritized brevity and selected items most relevant in light of the literature on the effects of PSMU on depression symptoms. We paraphrased seven items that commonly occur in the most widely used depression ques-tionnaires (Fried, 2017) to measure depressed mood, loss of inter-est, fatigue, concentration problems, feelings of loneliness, inferi-ority, and hopelessness. To measure stress, we modified a validated one-item stress measure (Elo, Leppänen, & Jahkola, 2003). In addition to an item measuring time spent on PSMU, we included an item to measure time spent on active social media use (ASMU), thereby enabling us to disentangle the effects of passive versus active use of social media. Furthermore, we paraphrased an
This
document
is
copyrighted
by
the
American
Psychological
Association
or
one
of
its
allied
publishers.
This
article
is
intended
solely
for
the
personal
use
of
the
individual
user
and
is
not
to
be
disseminated
broadly.
item from the Self-Report Habit Index (Verplanken & Orbell, 2003) to measure PSMU automaticity. However, because so many participants failed to answer the automaticity item, in light of a lot of missing data, we excluded this item from analyses. Finally, to distract participants from the study goal, we included an item measuring whether participants had received news concerning politics, public events, and issues through social media. Each item was assessed with a visual analog scale (0!not at all; 100!very much) to prevent restricted range. At each prompt, all items appeared in randomized order and the following statement pre-ceded the items: “Please indicate to what extent the following statements applied to you in the past 2 hours.”
Data Analysis
Descriptive statistics. For each participant, we calculated the mean (i.e., within-person mean) and standard deviation (i.e., within-person standard deviation) of each variable. For instance, if a participant reported depressed mood 70 times, we summed all 70 reported values and divided by 70. We repeated this procedure for all variables in all participants, resulting in a set of within-person means of all variables. From these values, we calculated a mean and standard deviation for each variable (reported in Table 1, first column). The same procedure was used to calculate the within-person standard deviation, which resulted in a set of within-within-person standard deviations for each variable. We calculated the mean and standard deviation of these values (reported in Table 1, second column).
Assumption checks. We used Kolmogorov–Smirnov tests to check whether each variable was normally distributed. A require-ment for the statistical model estimated in the present study (i.e., multilevel vector auto-regression [VAR]) is that stationarity holds. This means that the mean and variance of a variable do not change as a function of time. For each variable of each participant, we tested for stationarity using the Kwiatkowksi-Phillips-Schmidt-Shin unit root test (following Bringmann, 2016; Kwiatkowski, Phillips, Schmidt, & Shin, 1992). For both assumption checks, we applied Bonferroni correction to adjustpvalues for multiple test-ing.
Network estimation and visualization. Using the R package mlVAR (Epskamp et al., 2018), we estimated contemporaneous
correlations, temporal correlations, between-subjects correlations, and between-subjects partial correlations among depression symp-toms, stress, PSMU, and ASMU.Contemporaneous correlations represent how variables are associated within the same timeframe, and represent associations that remain after partialing out all other variables in the network within the same timeframe, and after partialing out temporal associations among variables. For instance, a positive contemporaneous correlation between PSMU and lone-liness indicates that, within the same timeframe of 2 hr, higher levels of PSMU co-occur with feeling lonelier, after controlling for all other contemporaneous and temporal relationships. Although a direction of effect cannot be established in these undirected net-works, associations likely come from temporal relationships, and especially relationships that occur at a shorter timeframe than sampled in the present study (minutes, not hours) will end up in the contemporaneous network structure.Temporal correlations indi-cate how a variable is predicted by all other variables (including itself) at a previous timeframe; these are “partial” correlations because they represent an association after controlling for all other temporal effects.
The multilevel VAR model has intercepts for each item, which represents the mean item level across time. Each variable in each individual has a mean level, and we can calculatebetween-subjects correlations between these mean levels. A positive between-subjects correlation between PSMU and loneliness indicates that participants who on average spend more time on PSMU also tend to have a higher level of loneliness. In thebetween-subjects partial correlationsnetwork, associations represent correlations between mean levels of variables while controlling for all other variables in the network.
The package mlVAR estimates the contemporaneous, temporal, and between-subjects correlations in two steps. In the first step, mlVAR estimates temporal and between-subjects associations. In the present study, this is done by estimating 10 multiple regression equations. In each equation, one of the variables in our ESM study is predicted by all variables (including itself) at a previous time-frame (t$1). Consider the following example equation: depressed moodt ! %0 & depressed moodt$1!%1 & PSMUt$1!%2. In this
equation,%2represents the partial correlation between PSMU at a
previous timeframe (t$1) and depressed mood at a subsequent timeframe (t), after controlling for depressed mood at a previous timeframe (t$1). The intercept of these equations (%0) represents
the value of depressed mood at timetwhen depressed moodt$1
and PSMUt$1 are equal to zero. Because mlVAR estimates a
random intercept, we can obtain an intercept for each variable in each participant—the mean value of the variable across 2 weeks. mlVAR uses these person-specific intercepts (means) to estimate the between-subjects associations, which are partial correlations between the person-specific means of all variables. The model estimated in the first step does not fit the data perfectly; stated differently, the original data points are not always equal to the values predicted by the model. In the second step, the residuals of this model (i.e., the differences between the original data points and predicted values) are used to estimate partial contemporaneous associations. mlVAR does this by estimating how the residuals of one variable are predicted by the residuals of all other variables at the same timeframe.
To make the model computationally tractable, we forced random effects of temporal and contemporaneous associations to be orthog-Table 1
Means and Standard Deviations of Within-Person Means and Within-Person Standard Deviations for All Variables
ESM variable M(SD) SD(SD)
Stress 20.55 (14.53) 16.84 (7.42)
Depressed mood 13.01 (11.23) 12.51 (7.48) Loss of interest 25.18 (14.71) 20.44 (8.09)
Fatigue 37.07 (17.37) 23.49 (6.67)
Concentration problems 26.56 (14.38) 21.00 (7.19)
Loneliness 11.90 (11.07) 10.88 (7.22)
Feeling inferior 10.36 (10.53) 9.10 (6.53) Feeling hopeless 11.85 (10.89) 10.84 (6.66)
PSMU 31.27 (14.08) 25.03 (6.03)
ASMU 21.27 (15.38) 18.85 (7.76)
Note. ESM ! experience sampling methodology; PSMU ! Passive social media use; ASMU!active social media use.
This
document
is
copyrighted
by
the
American
Psychological
Association
or
one
of
its
allied
publishers.
This
article
is
intended
solely
for
the
personal
use
of
the
individual
user
and
is
not
to
be
disseminated
onal (i.e., random slopes and intercepts were uncorrelated). In the undirected (i.e., contemporaneous and between-subjects) networks, the model predicts A by B and B by A, resulting in twopvalues for the association between the variables. To avoid estimating false pos-itive associations, we used the conservative AND rule, which means we only included associations in the model if both coefficients were significant at a level ofp".05. The AND rule does not apply to temporal associations, because these are estimated only once. mlVAR deals with missing data by removing all measurement moments that include at least one missing observation.
mlVAR returned a between-subjects correlation matrix with many implausibly high correlations. This might be because mlVAR esti-mates between-subjects partial correlations and then calculates between-subjects correlations from these associations, which can lead to unstable results (S. Epskamp, personal communication, May 29, 2017). To resolve this issue, we consulted with the package author (S. Epskamp, personal communication, May 29, 2017) who suggested a different way to calculate these associations (to calculate within-person means for each variable, and then estimate the correlations between them). We followed this procedure and report these corre-lations in the Results section.
Using the R package qgraph, we visualized all aforementioned associations as networks. These graphs comprise nodes, which represent the variables, and edges, which represent the associations between the variables. We plotted all networks with the same layout, which we determined by averaging over the layout of all networks based on the Fruchterman-Reingold algorithm (Fruch-terman & Reingold, 1991). We only included correlations in the graphs withpvalues smaller than .05. All adjacency matrices are available in the online supplementary materials.
Results
Descriptive Statistics
For all ESM variables that we included in the analysis, Table 1 contains means and standard deviations of within-person means
and within-person standard deviations. Responses ranged from 0 to 100 for all variables.
Assumption Checks
Kolmogorov–Smirnov tests indicated that no variable was nor-mally distributed (p" .001). Distributions indicated bimodality for some variables (fatigue, concentration problems, loss of inter-est, stress, PSMU, and ASMU) and right-skew for others (de-pressed mood, feelings of inferiority, loneliness, and hopeless-ness). Within-person mean levels were normally distributed for fatigue, concentration problems, and loss of interest (p'.05), but not for depressed mood, stress, PSMU, ASMU, and feelings of loneliness, inferiority, and hopelessness (p".001). Kwiatkowski-Phillips-Schmidt-Shin unit root tests suggested stationary data for all variables in all participants.
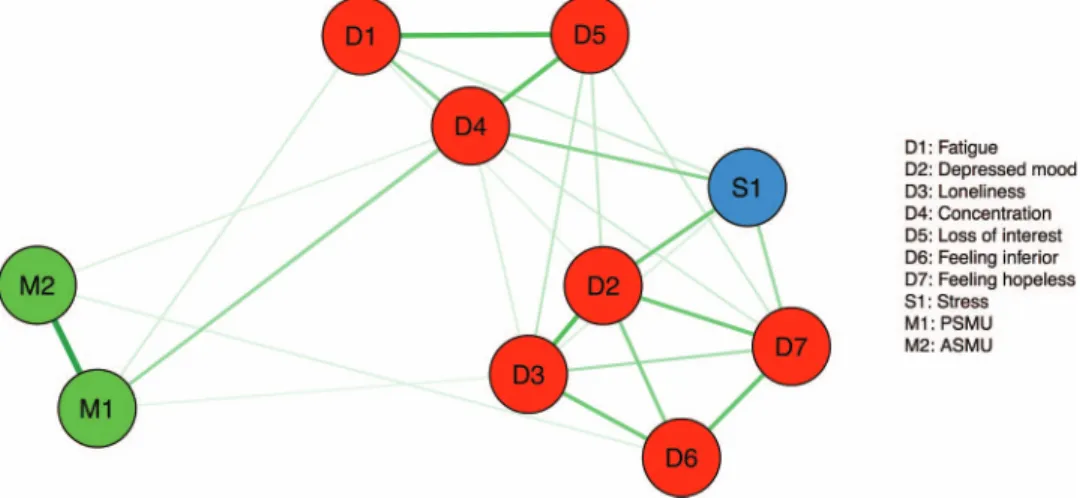
Contemporaneous Network
The contemporaneous network in Figure 1 shows the direct associations between the variables within the same timeframe after controlling for all other temporal and contemporaneous relations. PSMU is positively associated with concentration problems, loss of interest, fatigue, and loneliness, but unrelated to stress and feeling inferior, hopeless, or depressed. Furthermore, there are positive associations between ASMU and feelings of inferiority, and ASMU and concentration problems. Moreover, depression symptoms are positively associated. For instance, loss of interest is positively associated with fatigue and concentration problems. Finally, several depression symptoms, such as concentration prob-lems and depressed mood, are positively associated with stress.
Temporal Network
The temporal network in Figure 2 demonstrates how PSMU, ASMU, depression symptoms, loneliness, and stress predict each other from one timeframe to the next. Fatigue, loneliness, and
Figure 1. Partial contemporaneous correlation network of depression symptoms, stress and social media use. Solid lines represent positive partial correlations. Thicker lines represent stronger partial correlations. The thickest line (between active social media use [ASMU] and Passive social media use [PSMU]) represents a partial correlation of 0.33; the thinnest line (between PSMU and loneliness) represents a partial correlation of 0.03. We only plotted correlations withp-values".05. See the online article for the color version of this figure.
This
document
is
copyrighted
by
the
American
Psychological
Association
or
one
of
its
allied
publishers.
This
article
is
intended
solely
for
the
personal
use
of
the
individual
user
and
is
not
to
be
disseminated
broadly.
ASMU positively predict PSMU, but PSMU positively predicts only AMSU. Furthermore, loneliness and stress positively predict ASMU, and ASMU negatively predicts fatigue. Moreover, several depression symptoms predict each other bidirectionally across time. For instance, depressed mood positively predicts loneliness, and vice versa. However, not all depression symptoms directly predict each other. There is no temporal association between, for example, depressed mood and concentration problems. Finally, stress positively predicts and is predicted by concentration prob-lems, depressed mood, and feeling hopeless. Loneliness positively predicts stress, but not vice versa.
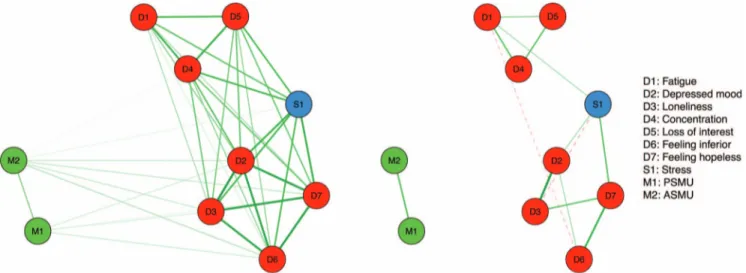
Between-Subjects Network
The between-subjects network in Figure 3 depicts the corre-lations between intraindividual mean levels of PSMU, ASMU, depression symptoms, loneliness, and stress. As Figure 3 shows, mean levels of PSMU correlated positively with mean levels of ASMU, depressed mood, and feelings of loneliness, hopelessness, and inferiority. ASMU correlated positively with the same symptoms as well as with stress and concentration problems. This means that, for instance, students who on aver-age spent more time on PSMU tended to have a higher mean level of loneliness.
However, as can be seen in the between-subjects partial corre-lations network (see Figure 3), PSMU showed only one direct relation with another variable: ASMU. Thus, the positive zero-order correlation between PSMU and other nodes decreased upon controlling for all other items in the network, and became nonsig-nificant (feeling inferior predicted by PSMU, p ! .09; PSMU predicted by feeling inferior,p!.20; depressed mood predicted by PSMU,p!.81; PSMU predicted by depressed mood,p!.48; loneliness predicted by PSMU, p ! .89; PSMU predicted by loneliness,p!.75; hopelessness predicted by PSMU, p! .19;
PSMU predicted by hopelessness,p!.25). One interpretation is that these relationships cease to exist at the level of partial corre-lations; another is that the present study lacked sufficient power to detect small edge coefficients in the partial correlation network. Finally, we see several positive partial correlations among depres-sion symptoms, loneliness, and stress; for instance, stress and fatigue feature unique positive associations, as do depressed mood and loneliness.
Discussion
Summary of Findings
In an experience sampling study of 125 students, with seven prompts per day, engaging in PSMU did not predict depression symptoms, loneliness, or stress. Instead, previous fatigue and loneliness predicted PSMU, indicating that these symptoms might lead participants to scroll through social media pages. Within the same timeframe, PSMU co-occurred with loss of interest, concen-tration problems, fatigue, and loneliness. These contemporaneous relations have been commonly interpreted in the literature as indicative of fast-moving causal processes (Epskamp et al., 2018), but the lack of temporal precedence does not allow for insights into the direction of the effects, that is, if PSMU leads to depression symptoms, vice versa, or both. Finally, we found that participants who spent more time passively using social media also experi-enced higher mean levels of depressed mood, loneliness, hopeless-ness, and feeling inferior. However, when controlling for all vari-ables in this network structure, PSMU was unrelated to all variables except for active social media usage. This means either that there are no partial correlations between PSMU and
depres-Figure 2. Temporal network of depression symptoms, stress and social media use. An arrow from variable A to variable B represents partial temporal correlations between variable A att$1 and variable B att. Solid arrows represent positive temporal correlations, and the dotted arrow represents a negative temporal correlation. Thicker arrows represent stronger correlations. The thickest arrow (from depressed mood to loneliness) represents a partial correlation of 0.09; the thinnest arrow (from stress to feelings of hopelessness) represents a partial correlation of 0.03. For interpretability, we did not plot auto-regressive correlations (see online supplementary materials for a graph including all auto-regressive correlations). We only plotted correlations withp-values"
.05. See the online article for the color version of this figure.
This
document
is
copyrighted
by
the
American
Psychological
Association
or
one
of
its
allied
publishers.
This
article
is
intended
solely
for
the
personal
use
of
the
individual
user
and
is
not
to
be
disseminated
sive symptoms, or that these relations are too weak for detection in the present analysis.1
Importance of Findings
We believe this is the first study to show that PSMU is con-temporaneously associated with concentration problems, fatigue, loneliness, and loss of interest. Given the undirected nature of these associations, we do not know if PSMU causes these symp-toms, or vice versa, or both. However, the observation that PSMU is associated with concentration problems aligns with research demonstrating that individuals who spend more time on PSMU tend to have lower attentional control (Alloway & Alloway, 2012). Possibly, people with poor attentional control tend to get distracted and are unable to inhibit habitual checking of Facebook. As we found this effect in the contemporaneous but not in the temporal network, the present study suggests that this effect occurs on a small timescale. Furthermore, because loss of interest reflects reduced positive affect (Nutt et al., 2007), the present study offers one potential explanation regarding the way PSMU may decrease affective well-being (Kross et al., 2013; Verduyn et al., 2015).
The positive contemporaneous association between PSMU and fatigue is in line with research suggesting that social media use might cause fatigue in individuals who feel overwhelmed by social media (e.g., because they receive too many messages; Lee, Son, & Kim, 2016). However, a different interpretation can be derived by looking at the temporal network, which indicates that PSMU could be part of a (beneficial) self-regulatory feedback loop: fatigue
¡& PSMU¡&ASMU ¡$fatigue. Additionally, whereas
Lee, Son, and Kim (2016) hypothesize that the effect of social media on fatigue is mediated by stress, the present investigation
finds no contemporaneous association between social media and stress, no temporal relation from social media use to stress and no (direct) temporal relation from stress to fatigue. One potential explanation is that the contemporaneous and temporal relations in the present study pertain to a narrow time window, whereas Lee et al. (2016) analyzed cross-sectional survey data, which encompass a larger time window, like the between-subjects partial correlations network in the present study. However, this network is inconsistent with findings by Lee et al. (2016): Although fatigue and stress are positively associated, social media use and stress are not. Alto-gether, these findings call into question the hypothesis that social media causes fatigue via stress caused by information overload.
Consistent with Kross et al.’s (2013) findings, we found that loneliness predicted PSMU and ASMU, but not vice versa, which suggests a unidirectional relationship between social media use and loneliness. Unlike Kross et al. (2013; and Verduyn et al., 2015), we did not find that more time on social media predicts lower affective well-being across time. This discrepancy might be explained by differences in operationalization of affective well-being (momentary affect in previous research vs. mood measures in the present study) and statistical analysis. Kross et al. (2013) and Verduyn et al. (2015) estimated the correlation between momen-tary affect and time spent on social media in the past 2 hr, which were measured at the same moment. Possibly, this procedure could have led to recall bias (e.g., when a person feels negative, they
1In a sensitivity analysis (see online supplementary materials), total
time spent on social media (i.e., sum of PSMU and ASMU) was positively related to feeling inferior in the between-subjects partial correlation net-work.
Figure 3. Between-subjects correlations (left panel), and between-subjects partial correlation network (right panel), representing the correlations between mean levels of depression symptoms, stress, and social media use. Solid lines represent positive correlations; dotted lines represent negative correlations. Thicker lines indicate stronger associations. In the left panel, the thickest line (between loneliness and depressed mood) represents a correlation of 0.94; the thinnest line (between loss of interest and Passive social media use [PSMU]) represents a correlation of 0.10. In the right panel, the thickest line (between loneliness and depressed mood) represents a partial correlation of 0.69; the thinnest line (between fatigue and feeling inferior) represents a partial correlation of 0.18. We only plotted associations withp-values".05. See the online article for the color version of this figure.
This
document
is
copyrighted
by
the
American
Psychological
Association
or
one
of
its
allied
publishers.
This
article
is
intended
solely
for
the
personal
use
of
the
individual
user
and
is
not
to
be
disseminated
broadly.
might overestimate the time they spent on social media in the past two hours). This issue is less likely to occur in the present study, because temporal associations pertain to relationships between variables at different measurement moments. A second reason for this discrepancy could be that Kross et al. (2013) and Verduyn et al. (2015) examined the effects of social media in an American student sample, whereas we did so in a European student sample. This could suggest that social media use has a different effect on American students than on European students. A final possibility is that social media use does predict depressed mood and loss of interest, but when controlling for all other variables in the network, these are statistically nonsignificant. However, when we reran our analyses including only social media use, depressed mood, and loss of interest, we found no temporal associations from social media use to mood items.
Furthermore, we did not find evidence that social media causes individuals to compare themselves with their (ostensibly) superior contacts, which could cause depression symptoms by increasing feelings of inferiority (Blease, 2015). Although research shows that social media exposes individuals to the highly curated lives of social media users who (on average) seem happier and more popular (Bollen et al., 2017), present findings suggest that—in a student population—there is no direct influence from PSMU to feelings of inferiority.
Finally, this study adds to a growing body of research demon-strating that individual depression symptoms are differentially associated with nonsymptom variables, such as psychosocial func-tioning (Fried & Nesse, 2014). Thereby, it underscores the impor-tance of modeling individual depression symptoms in research instead of sum scores or diagnoses that obfuscate crucial informa-tion (Fried & Nesse, 2015).
Strengths and Limitations
To the best of our knowledge, this study is the first to apply a network perspective to the link between social media and mental health. Our work extends prior work (e.g., Kross et al., 2013; Verduyn et al., 2015) in that we went beyond affect, including more detailed mental health facets such as fatigue and concentra-tion problems, and applied a recently developed statistical analytic procedure. An important quality of the present study is that its experience sampling protocol was almost twice as intensive as those applied in previous studies on social media and psycholog-ical well-being (Kross et al., 2013; Verduyn et al., 2015). Experi-ence sampling is considered an approach with high ecological validity because it monitors people in daily life. We make all ESM data, R-syntax, model output, and the correlation matrix of the data available in the online supplementary materials.
Our study does have several limitations. First, as this was a student sample, mean levels of depression symptoms, loneliness, and stress were fairly low. Further, items might have been inter-preted differently by this nonclinical sample than they would have been in a clinical sample. For instance, to individuals without depression, endorsing “I had little interest in doing anything” could mean they felt bored, whereas in individuals with depression, this could represent anhedonia. As social media’s adverse effects ap-pear to be demonstrably stronger in depressed than in nonde-pressed individuals (Appel, Crusius, & Gerlach, 2015), it remains possible that clinical samples show stronger and more (temporal)
relations between social media use and depression symptoms. Therefore, future extensions of the present work in clinical sam-ples is needed. Finally, although our ESM questionnaire included a distractor item for social media use (i.e., news), we did not include additional items to distract from negative affect items. As a consequence, some participants might have been aware of our study’s purpose, which could have influenced their responses in the direction of our hypotheses (e.g., reporting greater loss of interest when also reporting more PSMU). This will be an inter-esting challenge moving forward in the emerging field of ESM studies, with the goal to balance the need of focusing on few items to reduce participant burden with including sufficient distractors. This is particularly important when such research has an intensive sampling protocol as in the present study. One possibility is that future studies include one or two positive or neutral affect items to counterbalance the aforementioned potential effects, or include a social desirability question.
Second, as PSMU may be initiated with minimal awareness when performed habitually, self-reports may not always accurately reflect actual PSMU. Conversely, it is possible that individuals sometimes overestimate how much time they spend on social media (Junco, 2013). Using self-tracking applications that can accurately estimate time spent on social media might solve this problem. We consider this an important direction for future work on this topic.
Third, although tests suggested that the present data met the assumption of stationarity, sensitivity analyses suggested that this assumption might have been violated. One way to deal with this issue is to detrend nonstationary individual time series data before running group level analyses. Furthermore, our data did not meet all assumptions of multivariate normality. This is not unusual in psychology, but as it is unclear at present how robust the employed methods are to such violations, results need to be interpreted with caution. Following a reviewer’s suggestion, we log transformed the data and reran analyses (reported in the online supplementary materials as sensitivity analysis), which did not affect the overall pattern of results. As an additional assumption check, suggested by two reviewers, we also tested if the residuals of the contempora-neous network followed a normal distribution. We found that this was not the case for any of the variables, violating some of the model assumptions. Because some variables were bimodally dis-tributed, future research into this issue might benefit from logistic rather than linear regression. However, to this date, logistic regres-sion approaches have not been made readily available in common multilevel analysis routines of ESM data, and these and related challenges of non-normal residuals require urgent attention in future methodological research. Finally, network models in cross-sectional data have greatly benefitted from recent investigations into the accuracy and stability of network parameters such as edge weights and centrality estimates (Epskamp et al., 2018). Unfortu-nately, such checks are not yet available for mlVAR models as estimated in R, and we look forward to methodological develop-ments in this field.
Fourth, the present modeling framework is limited to estimating linear relationships, and cannot capture higher-order interactions among variables. For instance, it is possible that PSMU only predicts feelings of inferiority when individuals feel very lonely. We are looking forward to statistical developments that would allow to tackle these issues.
This
document
is
copyrighted
by
the
American
Psychological
Association
or
one
of
its
allied
publishers.
This
article
is
intended
solely
for
the
personal
use
of
the
individual
user
and
is
not
to
be
disseminated
Constraints on Generality
The sample of participants is representative of Dutch undergrad-uate psychology students at a large university. The present study included participants from a relatively narrow age band. Because social media use is highly differentiated by age, it is important to note that our results are more likely to generalize to young than to old individuals. Replication studies, using the present study’s ESM questionnaire (see online supplementary materials), could be con-ducted in other student populations, age groups, and in clinical populations, such as depressed individuals. The present findings depend on algorithms that social media use to determine news feed content. Changes in these algorithms might lead to different re-sults.
A Network Approach to Social Media and
Psychopathology
These limitations notwithstanding, we believe the network per-spective provides important insights into the complex, dynamic relation between social media and psychopathology. Until re-cently, this perspective has focused primarily on symptom net-works (Fried et al., 2017); however, several studies have now estimated networks that include nonsymptom variables (e.g., Bern-stein, Heeren, & McNally, 2017; Heeren & McNally, 2016). These studies and our own study align with the recently proposed ex-panded network approach, which aims to uncover the network structure of all variables—symptoms and nonsymptoms—that could be causally relevant to psychopathology (Fried & Cramer, 2017; Jones, Heeren, & McNally, 2017). We believe the present study illustrates the utility of this approach and we hope it encour-ages researchers to investigate the network structure of symptoms and beyond.
Context of the Research
The general idea for this study was developed by combining ideas and findings in clinical psychology, psychological research methods, and communication science. We consider network anal-ysis an important tool to quantitatively integrate empirical research from different fields of study, and the present study aimed to do so for clinical psychology and communication science. Our findings are best situated in the authors’ novel research program—the expanded network approach (Fried & Cramer, 2017; Jones et al., 2017)—which examines the network structure of variables that are causally relevant to mental health. Future extensions of the present research are direct replications in clinical samples (e.g., in indi-viduals with depression, or body image disorders), and other cultures, and studies that include symptoms of other psychiatric syndromes (e.g., compulsively checking nonexistent or minor flaws in physical appearance in individuals with body dysmorphic disorder).
References
Alloway, T. P., & Alloway, R. G. (2012). The impact of engagement with social networking sites (SNSs) on cognitive skills.Computers in Human Behavior, 28,1748 –1754. http://dx.doi.org/10.1016/j.chb.2012.04.015 Andreassen, C. S., Pallesen, S., & Griffiths, M. D. (2017). The relationship
between addictive use of social media, narcissism, and self-esteem:
Findings from a large national survey.Addictive Behaviors, 64,287– 293. http://dx.doi.org/10.1016/j.addbeh.2016.03.006
Appel, H., Crusius, J., & Gerlach, A. L. (2015). Social comparison, envy, and depression on Facebook: A study looking at the effects of high comparison standards on depressed individuals.Journal of Social and Clinical Psychology, 34,277–289. http://dx.doi.org/10.1521/jscp.2015 .34.4.277
Appel, H., Gerlach, A. L., & Crusius, J. (2016). The interplay between Facebook use, social comparison, envy, and depression.Current Opin-ion in Psychology, 9,44 – 49. http://dx.doi.org/10.1016/j.copsyc.2015.10 .006
Bernstein, E. E., Heeren, A., & McNally, R. J. (2017). Unpacking rumi-nation and executive control: A network perspective.Clinical Psycho-logical Science, 5, 816 – 826. http://dx.doi.org/10.1177/216770 2617702717
Blease, C. R. (2015). Too many ‘friends’, too few ‘likes’? Evolutionary psychology and ‘Facebook depression’.Review of General Psychology, 19,1–13. http://dx.doi.org/10.1037/gpr0000030
Bollen, J., Goncalves, B., van de Leemput, I., & Ruan, G. (2017). The happiness paradox: Your friends are happier than you.EPJ Data Sci-ence, 6,4. http://dx.doi.org/10.1140/epjds/s13688-017-0100-1 Borsboom, D. (2017). A network theory of mental disorders.World
Psy-chiatry, 16,5–13.
Boschloo, L., van Borkulo, C. D., Borsboom, D., & Schoevers, R. A. (2016). A prospective study on how symptoms in a network predict the onset of depression.Psychotherapy and psychosomatics, 85,183–184. http://dx.doi.org/10.1159/000442001
Bringmann, L. F. (2016).Dynamical networks in psychology: More than a pretty picture?(master’s thesis). University of Groningen, Groningen, the Netherlands.
DeBerard, M. S., & Kleinknecht, R. A. (1995). Loneliness, duration of loneliness, and reported stress symptomatology.Psychological Reports, 76,1363–1369. http://dx.doi.org/10.2466/pr0.1995.76.3c.1363 Dejonckheere, E., Bastian, B., Fried, E. I., Murphy, S. C., & Kuppens, P.
(2017). Perceiving social pressure not to feel negative predicts depres-sive symptoms in daily life. Depression and Anxiety, 34, 836 – 844. http://dx.doi.org/10.1002/da.22653
Elo, A. L., Leppänen, A., & Jahkola, A. (2003). Validity of a single-item measure of stress symptoms.Scandinavian Journal of Work, Environ-ment & Health, 29,444 – 451. http://dx.doi.org/10.5271/sjweh.752 Epskamp, S., Borsboom, D., & Fried, E. I. (2018). Estimating
psycholog-ical networks and their accuracy: A tutorial paper.Behavior Research Methods, 50,195–212. http://dx.doi.org/10.3758/s13428-017-0862-1 Epskamp, S., van Borkulo, C. D., van der Veen, D. C., Servaas, M. N.,
Isvoranu, A. M., . . . Cramer, A. O. (2017). Personalized network modeling in psychopathology: The importance of contemporaneous and temporal connections.Clinical Psychological Science, 6,416 – 427. Epskamp, S., Waldorp, L. J., Mõttus, R., & Borsboom, D. (2018). The
Gaussian graphical model in cross-sectional and time-series data. Mul-tivariate Behavioral Research. Advance online publication. http://dx.doi .org/10.1080/00273171.2018.1454823
Fried, E. I. (2017). The 52 symptoms of major depression: Lack of content overlap among seven common depression scales.Journal of Affective Disorders, 208,191–197. http://dx.doi.org/10.1016/j.jad.2016.10.019 Fried, E. I., Bockting, C., Arjadi, R., Borsboom, D., Amshoff, M., Cramer,
A. O., . . . Stroebe, M. (2015). From loss to loneliness: The relationship between bereavement and depressive symptoms.Journal of Abnormal Psychology, 124,256 –265. http://dx.doi.org/10.1037/abn0000028 Fried, E. I., & Cramer, A. O. J. (2017). Moving forward: Challenges and
directions for psychopathological network theory and methodology. Perspectives on Psychological Science, 12,999 –1020. http://dx.doi.org/ 10.1177/1745691617705892
This
document
is
copyrighted
by
the
American
Psychological
Association
or
one
of
its
allied
publishers.
This
article
is
intended
solely
for
the
personal
use
of
the
individual
user
and
is
not
to
be
disseminated
broadly.
Fried, E. I., & Nesse, R. M. (2014). The impact of individual depressive symptoms on impairment of psychosocial functioning.PLoS ONE, 9, e90311. http://dx.doi.org/10.1371/journal.pone.0090311
Fried, E. I., & Nesse, R. M. (2015). Depression sum-scores don’t add up: Why analyzing specific depression symptoms is essential.BMC Medi-cine, 13,72. http://dx.doi.org/10.1186/s12916-015-0325-4
Fried, E. I., Nesse, R. M., Guille, C., & Sen, S. (2015). The differential influence of life stress on individual symptoms of depression. Acta Psychiatrica Scandinavica, 131, 465– 471. http://dx.doi.org/10.1111/ acps.12395
Fried, E. I., van Borkulo, C. D., Cramer, A. O., Boschloo, L., Schoevers, R. A., & Borsboom, D. (2017). Mental disorders as networks of prob-lems: A review of recent insights.Social Psychiatry and Psychiatric Epidemiology, 52,1–10. http://dx.doi.org/10.1007/s00127-016-1319-z Frison, E., & Eggermont, S. (2016). Exploring the relationships between
different types of Facebook use, perceived online social support, and adolescents’ depressed mood. Social Science Computer Review, 34, 153–171. http://dx.doi.org/10.1177/0894439314567449
Fruchterman, T. M., & Reingold, E. M. (1991). Graph drawing by force-directed placement.Software, Practice & Experience, 21,1129 –1164. http://dx.doi.org/10.1002/spe.4380211102
Goldberg, Y. K., Eastwood, J. D., LaGuardia, J., & Danckert, J. (2011). Boredom: An emotional experience distinct from apathy, anhedonia, or depression.Journal of Social and Clinical Psychology, 30,647– 666. http://dx.doi.org/10.1521/jscp.2011.30.6.647
Gonzales, A. L., & Hancock, J. T. (2011). Mirror, mirror on my Facebook wall: Effects of exposure to Facebook on self-esteem.Cyberpsychology, Behavior, and Social Networking, 14,79 – 83. http://dx.doi.org/10.1089/ cyber.2009.0411
Heeren, A., & McNally, R. J. (2016). An integrative network approach to social anxiety disorder: The complex dynamic interplay among atten-tional bias for threat, attenatten-tional control, and symptoms. Journal of Anxiety Disorders, 42,95–104. http://dx.doi.org/10.1016/j.janxdis.2016 .06.009
Jones, P. J., Heeren, A., & McNally, R. J. (2017). Commentary: A network theory of mental disorders.Frontiers in Psychology, 8,1305. http://dx .doi.org/10.3389/fpsyg.2017.01305
Junco, R. (2013). Comparing actual and self-reported measures of Face-book use.Computers in Human Behavior, 29,626 – 631. http://dx.doi .org/10.1016/j.chb.2012.11.007
Kross, E., Verduyn, P., Demiralp, E., Park, J., Lee, D. S., Lin, N., . . . Ybarra, O. (2013). Facebook use predicts declines in subjective well-being in young adults.PLoS ONE, 8,e69841. http://dx.doi.org/10.1371/ journal.pone.0069841
Kwiatkowski, D., Phillips, P. C. B., Schmidt, P., & Shin, Y. (1992). Testing the null hypothesis of stationarity against the alternative of a unit root.Journal of Econometrics, 54,159 –178. http://dx.doi.org/10.1016/ 0304-4076(92)90104-Y
LaRose, R. (2010). The problem of media habits.Communication Theory, 20,194 –222. http://dx.doi.org/10.1111/j.1468-2885.2010.01360.x LaRose, R., Lin, C. A., & Eastin, M. S. (2003). Unregulated internet usage:
Addiction, habit, or deficient self-regulation? Media Psychology, 5, 225–253. http://dx.doi.org/10.1207/S1532785XMEP0503_01
Lee, A. R., Son, S. M., & Kim, K. K. (2016). Information and communi-cation technology overload and social networking service fatigue: A
stress perspective.Computers in Human Behavior, 55,51– 61. http://dx .doi.org/10.1016/j.chb.2015.08.011
Liu, D., & Baumeister, R. F. (2016). Social networking online and per-sonality of self-worth: A meta-analysis.Journal of Research in Person-ality, 64,79 – 89. http://dx.doi.org/10.1016/j.jrp.2016.06.024
Meier, A., Reinecke, L., & Meltzer, C. E. (2016). Facebocrastination? Predictors of using Facebook for procrastination and its effects on students’ well-being.Computers in Human Behavior, 64,65–76. http:// dx.doi.org/10.1016/j.chb.2016.06.011
Mellor, D., Stokes, M., Firth, L., Hayashi, Y., & Cummins, R. (2008). Need for belonging, relationship satisfaction, loneliness, and life satis-faction.Personality and Individual Differences, 45,213–218. http://dx .doi.org/10.1016/j.paid.2008.03.020
Nutt, D., Demyttenaere, K., Janka, Z., Aarre, T., Bourin, M., Canonico, P. L., . . . Stahl, S. (2007). The other face of depression, reduced positive affect: The role of catecholamines in causation and cure.Journal of Psychopharmacology, 21, 461– 471. http://dx.doi.org/10.1177/0269 881106069938
Pe, M. L., Kircanski, K., Thompson, R. J., Bringmann, L. F., Tuerlinckx, F., Mestdagh, M., . . . Gotlib, I. H. (2015). Emotion-network density in major depressive disorder.Clinical Psychological Science, 3,292–300. http://dx.doi.org/10.1177/2167702614540645
Runyan, J. D., Steenbergh, T. A., Bainbridge, C., Daugherty, D. A., Oke, L., & Fry, B. N. (2013). A smartphone ecological momentary assess-ment/intervention “app” for collecting real-time data and promoting self-awareness.PLoS ONE, 8,e71325. http://dx.doi.org/10.1371/journal .pone.0071325
Tobin, S. J., Vanman, E. J., Verreynne, M., & Saeri, A. K. (2015). Threats to belonging on Facebook: Lurking and ostracism.Social Influence, 4510,1–12.
Twenge, J. M. (2017).iGen: Why today’s super-connected kids are grow-ing up less rebellious, more tolerant, less happy—and completely un-prepared for adulthood. New York, NY: Atria.
Verduyn, P., Lee, D. S., Park, J., Shablack, H., Orvell, A., Bayer, J., . . . Kross, E. (2015). Passive Facebook usage undermines affective well-being: Experimental and longitudinal evidence.Journal of Experimental Psychology: General, 144, 480 – 488. http://dx.doi.org/10.1037/xge 0000057
Verplanken, B., & Orbell, S. (2003). Reflections on past behavior: A self-report index of habit strength.Journal of Applied Social Psychol-ogy, 33, 1313–1330. http://dx.doi.org/10.1111/j.1559-1816.2003 .tb01951.x
Wenninger, H., Krasnova, H., & Buxmann, P. (2014, June). Activity matters: Investigating the influence of Facebook on life satisfaction of teenage users. Proceedings of the European Conference on Information Systems (ECIS) 2014, Tel Aviv, Israel.
Whiting, A., & Williams, D. (2013). Why people use social media: A uses and gratifications approach.Qualitative Market Research, 16,362–369. http://dx.doi.org/10.1108/QMR-06-2013-0041
Received March 16, 2018 Revision received September 20, 2018
Accepted September 23, 2018 !
This
document
is
copyrighted
by
the
American
Psychological
Association
or
one
of
its
allied
publishers.
This
article
is
intended
solely
for
the
personal
use
of
the
individual
user
and
is
not
to
be
disseminated