Development of Peptidase Resistant Reporters for Intracellular Enzymatic Activity
Shan Yang
A dissertation submitted to the faculty of the University of North Carolina at Chapel Hill in partial fulfillment of the requirements for the degree of Doctor of Philosophy in the Department of Chemistry.
Chapel Hill 2011
ii © 2011 Shan Yang
iii ABSTRACT
SHAN YANG: Development of Peptidase Resistant Reporters for Intracellular Enzymatic Activity
(Under the direction of Nancy L. Allbritton)
There is an increased interest in using peptides with consensus site motifs as reporters to assess enzymatic activity in living cells for cancer research. However, the application of these reporters is often challenged by the short lifetimes of these peptides due to hydrolysis by peptidases within the cell. Since the majority of intracellular peptidases possess catalytic sites buried deep within a cavity, the linearized peptide can access these spaces from the N-terminus and are subsequently degraded. Here, appending a bulky group to the N-terminus of a linear peptide is proposed to overcome this issue. This bulky group might block the access of the peptide to sterically hindered peptidase catalytic sites and improve the lifetime of peptide within cells. Previous work
demonstrated that small folded motifs based on beta hairpins were resistant to peptidases in vitro. These small beta hairpins were termed "protectides" in this work due to their ability to resist hydrolysis by peptidases. Several designs of protectides are presented in this work for multiple enzymes. For Abl kinase, three designs were utilized: two non-crosslinked beta-bend peptides; two non-crosslinked beta hairpin peptides; and a FlAsH-tetracysteine beta hairpin complex. For Protein Kinase C and the proteasome, a series uncrosslinked protectide based on WKWK peptide structures developed by the Waters lab were designed and evaluated.
These protectides are linked to the N-terminus of a kinase substrate peptide via a polyethylene glycol (PEG) linker. Capillary electrophoresis with laser-induced
iv
phosphorylation. The studies also demonstrated that the protectide-peptide constructs provided “protection” to the substrate from cytosolic peptidases and they remained substrates for the target kinase both in cell lysate and single intact cell assays.
Additionally, successful development of protectide-peptide constructs to be
utilized as reporters for other intracellular enzymes was demonstrated. Substrate reporters to measure proteasome activity were designed utilizing the same strategy. For this
v
This work is dedicated to
my best friends, my love Wei XU,
for all of his love and support
and to my Parents and Sisters
vi
ACKNOWLEDGEMENTS
I would like to sincerely thank Dr. Nancy L. Allbritton and Dr. Chris Sims for their excellent guidance during my Ph.D. studies at the University of North Carolina, Chapel Hill. They provided me with valuable suggestions not only on the experimental skills but also on the way of thinking. Without their guidance, I could not overcome all the issues encountered in my challenging Ph.D. project.
I also would like to thank Dr. Marcey Waters for her wonderful guidance and
collaboration during the process of my Ph.D. studies. I also would like to thank Kaiulani Houston, Dr. Lauren Cline and Dr. Alex Riemen from Dr. Waters’ group for their excellent collaboration. It was a happy and fruitful working experience.
I would like to sincerely thank Dr. James W. Jorgenson, Dr. Gary Pielak and Dr. Mark Wightman for being my Ph.D. dissertation committee members. It’s an honor to have these world class scientists on my Ph.D. committee.
I would also like to give special thanks to Angie Proctor for her encouragement, great help and being my good friend. You make my life in the lab happy every day!
vii
Kovarik, Dr. Kelong Wang, Ryan Phillips, Abby Turner, Jazz Dickinson, Nick Dobes, and Colleen Phillips.
viii
TABLE OF CONTENTS
List of Tables………... xvi
List of Figures………...…..xviii
Listof Abbreviations………...xxvii
List of Symbols…...….……….…xxxiv
Chapter 1: Introduction……….…………...…....1
1.1 Protein Kinases in Cancer…...……….…………...………..1
1.1.1Protein Kinases and Phosphorylation…..…….…..………...……….1
1.1.2 Phosphorylation in Cell Signal Transduction………..……….……...…….. 1
1.1.3Dysregulation of Kinases in Cancer Cells…………...………...…... 2
1.2 Molecularly Targeted Therapy for Cancer (MTTC)…..……..………....3
1.2.1 Molecularly Targeted Therapy……….………..……….…3
1.2.2Targeting Protein Kinases for Cancer Therapy….……..………...……4
1.3 Challenges in the Measurement of Kinase Activity in Clinical Samples………...…..5
1.3.1Requirement for Clinical Measurements…....……….………...5
1.3.2Limitations of Current Assays…..…………..………6
1.4 Microelectrophoretic Techniques for Cellular Kinase Activity Measurements………...………...…...6
1.4.1Previous Work on Microelectrophoretic Techniques…...….…..…………..7
1.4.2Cytosolic Degradation as a Limitation of Peptide Reporters for Cell Assays………..………...…..……9
ix
1.5.1Main Goal of This Work………….………10
1.5.2Scope of the Dissertation………...………...10
1.6Figures……….……….12
1.7References……….………...13
Chapter 2: Proposed Design of Peptidase Resistant Reporters Study of Cytosolic Peptidase………..………….….….………..22
2.1 Introduction……….………..……….…….….……...22
2.1.1 Intracellular Protein Degradation………...……….….…….. 22
2.1.2 Classification of Peptidases………….……….….….……23
2.1.3 Cytosolic Peptidases……….……….…….….…...23
2.1.3.1 Prolyl Oligopeptidases (POP)……….…………..…………..…...24
2.1.3.2 Thimet Oligopeptidases (TOP)……….…….………..…..24
2.1.3.3 Leucine Aminopeptidase (LAP)……..……….…….…...……… 25
2.1.3.4 Tripeptidylpeptidase II (TPPII)…...……….…………..…………25
2.1.3.5 Tricone peptidase (TRI)………...26
2.2 Experimental……….……….………..26
2.3 Result and Discussion……….……….………27
2.3.1 Prolyl Oligopeptidase (POP) Structure……..….….……….……….27
2.3.2 Thimet Oligopeptidase (TOP) Structure……….…...………...…...……...28
2.3.3 Leucine Aminopeptidase (LAP) Structure……..……….…...28
2.3.4 Tripeptidylpeptidase II (TPP II) Structure……….………....28
2.3.5 Tricone Peptidase (TRI) Structure…….………29
2.4 Conlusion……..………..……….……….……….…..29
2.5 Proposed Designs of Peptidase Resistant Reporter……….……….……...……....30
2.5.1 Early Generation of the Peptide Reporters……...………...………..30
x
2.5.3 Beta Hairpin Structure Protectides…...…………...………..31
2.5.4 General Design……….…..………...32
2.5.5 Substrate Docking into TOP Peptidase……….…..……….…..33
2.6 Figures and Tables……….……….….34
2.7 References……….……….…..46
Chapter 3: Design and Synthesis of Cytosolic Degradation Resistant Reporters for BCR-ABL Kinase Activity…...………..50
3.1 Introduction……….……….………...50
3.1.1 Abl Kinase………...……….………50
3.1.2 BCR-Abl Kinase………...……….….………..51
3.1.3 Targeting BCR-Abl Kinases in CML…...……….………...51
3.1.4 Kinase Reporters for BCR-Abl…………...……….………53
3.2 Experimental………...……..……….……….…………53
3.2.1 Materials…….………..53
3.2.2 Peptide Synthesis……….……….54
3.2.3 Cyclization of Peptides……….……….……….………..54
3.2.3.1 Covalent Crosslinking…...….……….……...54
3.2.3.2 Tetracysteine-FLAsH Binding……..…….….………..55
3.2.4 Purification……….……….………….……….57
3.2.5 Mass Spectroscopy…...……….……….…………..……….57
3.2.6 Peptide Concentration Determination…….…...………..…….57
3.3 Results and Discussion………58
3.3.1 Components of the Designed BCR-Abl Substrate Reporters…….……….………...……...58
3.3.1.1 Selection of Substrate……….……...….……….…..58
3.3.1.2 Selection of Linker……….……….………...59
xi
3.3.1.4 Description of Designed BCR-Abl Kinase
Reporters………...……….….…....61
3.3.2 Synthesis, Cyclization and Purification of the BCR -Abl Reporters……….……….……….…...61
3.4 Conclusion……….……….……….……...……66
3.5 Figures and Tables……….….…..……...…..…..67
3.6 References……….….……….…...……84
Chapter 4: Characterization of BCR-Abl Kinase Reporters in vitro and in Intact Living Cells………….………...88
4.1 Introduction……….……….……….…...88
4.2 Experimental……….……….….………...…...89
4.2.1 Material………..……….……….…………...89
4.2.2 CE-LIF Setup……….……….……….…...……..……...90
4.2.2.1 Electrophoresis Setup……….……..………....……...…….…....…...91
4.2.2.2 Optical Setup………..…….…….…...………….…...…...…...91
4.2.2.3 Electronic Setup……...….…….….…...……...……...…....….….…93
4.2.3 Capillary Electrophoresis……….………...…...….…..94
4.2.4 Cytosolic Peptidase Degradation Assay…….….……….…...…..….94
4.2.5 Cell lysate Degradation Assay……….………....….…...95
4.2.5.1 Cell Culture and Cell lysate Preparation………..……..…...……95
4.2.5.2 Measuring Protein Concentration……….………96
4.2.5.3 Cell lysate Degradation Assay………....…....….97
4.2.6 Abl Kinase Assay………….……....………....….……...97
4.2.7 Kinetic Properties of the Designed Reporters for Abl Kinase………..………98
4.2.7.1 in vitro Kinase Assay………..……….…...…….….…..98
4.2.7.2 Phosphorylation Measured by IMAP……….……..……..98
xii
4.2.8.1 Cell lysate Preparation for Kinase Assay….……...….…...….…..99
4.2.8.2 Abl Peptide Reporters Assay…………....…………...……….…..99
4.2.9 Loading Peptide into Living Cells (BaF3)……..….………....100
4.2.9.1 Light and Fluorescence Microscopy……..…..……….….100
\ 4.2.9.2 Pinocytic Loading…………..….…..…...….……….…….……...100
4.2.9.3 Microinjection………...…………...……..……….…...100
4.2.10 Single Cell Assay……….………...…..………...102
4.2.10.1 Experimental Set Up……….…..……….………...102
4.2.10.2 Single Cell Experiments………...………....……….….103
4.3 Results and Discussion…………...….……….…....….……104
4.3.1 CE-LIF Instrument Optimization……...…………...……….…...……..104
4.3.2 Determination of Separation Buffers ………...…...……..…..…..105
4.3.3 Endopeptidase Assay………...……….…...…...…….…110
4.3.4 Degradation of Peptides in a Cell Lysate……….………...…...110
4.3.5 Kinetic Properties of the Designed Reporters for Abl Kinase………..……….…...…..113
4.3.6 Cell Lysate Kinase Assay in a BCR-Abl BaF3 Cell Line…………..………...115
4.3.7 Loading Methods………...……...………..….…..…...116
4.3.8 Single Cell Assay……….………..….……...117
4.4 Conclusions and Future Work………..………...…...….………119
4.5 Figures and Tables………....……….……….……….121
4.6 References………..……….……….…….….…….…148
Chapter 5: Characterization of BCR-Abl Kinase Reporters in vitro and in Intact Living Cells………...150
5.1 Introduction……….………....150
xiii
5.2.1 Reagents………..….151
5.2.1 Pronase E Cocktail Assay………..…..151
5.2.2 LC/MS and MALDI Assay………..152
5.3 Discussion………...152
5.4 Conclusion……….……….155
5.5 Figures and Tables………....…..157
5.6 Reference……….…...…....165
Chapter 6: Applications of Using “protectide” to Design Reporters of Protein Kinase C (PKC) in Multiple Myeloma (MM)……….166
6.1 Introduction………... 166
6.1.1 Protein kinase C (PKC)………...………..… 166
6.1.2 PKC Implication in Cancers………..……….167
6.1.3 Targeting PKC in Multiple Myeloma (MM)…………..………....167
6.2 Experimental……….……….………...168
6.2.1 Materials……….………....168
6.2.2 Synthesis and Purification of PKC reporters………..……....168
6.2.3 Fragment Standards Generating by Trypsin and Pronase E……..……….……….169
6.2.4 Separation of PKC Reporters and Phosphorylated Products by CE……….………..…. 169
6.2.5 Cell Lysate Degradation of the PKC Reporter……….………..170
6.2.5.1 Lysate Preparation……….………..170
6.2.5.2 Protein Concentration Measurement……….……..170
6.2.5.3 Degradation Assay……….….170
6.2.6 Kinase assay……….….170
6.2.7 Cell Lysate Kinase Assay……….170
xiv
6.2.7.2 Cell lysate Kinase for PKC Reporters………171
6.2.8 Loading Reporters into Intact Cells ……….……...171
6.3 Results and Discussion………...172
6.3.1 Design of Protein Kinase C reporters………172
6.3.1.1 Selection of Substrate Sequence for PKC Reporters……….….172
6.3.1.2 Selection of protectides……….…………...172
6.3.2 Selection of Separation Buffer………...……….…...174
6.3.3 Fragment Generation by Trypsin and Pronase E………..…….….…...175
6.3.4 Cell Lysate Degradation Assay………..176
6.3.5 Kinase Assay………..…...177
6.3.6 Cell Lysate Kinase Assay Utilizing OPM-2 Cells………..……...178
6.3.7 Loading of PKC Reporters into OPM-2 Cells……….……..178
6.4 Conclusion and Future Work……….….…179
6.5 Figures and Tables………..………….….…...………181
6.6 References………….……….………194
Chapter 7: Development of Protectide-degron Peporters for Proteasome/Ubiquitination Activity………. ……….…....196
7.1 Introduction……….…..196
7.1.1 Proteasome/Ubiquitination Degradation Pathway….………..196
7.1.2 Degrons and Ubiquitination……….………..….…...196
7.1.3 Targeting Then Proteasome in Multiple Myeloma (MM)…….…….…..198
7.2 Experimental……….…….199
7.2.1 Material……….……….…...199
7.2.2 20S Assay……….………….…...199
7.2.3 Ubiqutination (S100 lysate-based) Assay……….….…..200
xv
7.3 Results and Discussion………...201
7.3.1 Design of Proteasome Reporter………201
7.3.1.1 Selection of Degrons……….. 202
7.3.1.2 Selection of Protectide………... 202
7.3.1.3 Details of the Design of Proteasome Reporters……….… 202
7.3.2 20S Assay………...203
7.3.3 Ubiquitination Assay and Characterization………...204
7.4 Conclusion and Future Works……….….207
7.5 Figures and Tables………...208
xvi
LIST OF TABLES
Table 2.1: Dimensions of peptidase catalytic cavities………..……… 45
Table 3.1: Partial list of published peptide substrates for BCR-Abl………...….…….... 80
Table 3.2: Designed peptide reporters for BCR-Abl kinase……….….81
Table 3.3: MALDI result of designed reporters………...… 82
Table 3.4: Dimensions of different beta hairpin protectides………...….. 83
Table 4.1: Reproducebity of the homemade CE system…...………... 144
Table 4.2: Comparison peptidase of cell lysate and intact cell………...…………...… 145
Table 4.3: t1/2 and protectide size of all reporters…………...………..… 146
Table 4.4: Kinetics perimeters of all reporters………...………… 147
Table 5.1: 67B peptide expected and observed MW of all fluorescent fragments……….…………..160
Table 5.2: Her-2 peptide expected and observed MW of all fluorescent fragments………..161
Table 5.3: EGFR-1 peptide expected and observed MW of all fluorescent fragments……….162
Table 5.4: Expected and observed MW of Fluorescent fragments of Trpzip 2 peptide………...…163
Table 5.5: Expected and observed MW of Fluorescent fragments of XBB1 peptide……….164
Table 6.1 Folding percentages of the protectides……….191
Table 6.2: Designed peptide reporters for protein kinase C………...191
Table 6.3: PKCα and OPM-2 cell lysate kinase assay conditions……….190
xvii
Table 7.1: Peptides for 20S assay……….………. 212
Table 7.2: Designed peptide reporters of proteasome and degrons……….…………...……….…………....213
Table 7.3: 20S degradation assay condition……….. 214
Table 7.4: 20S degradation result for different peptide..………...… 215
xviii
LIST OF FIGURES
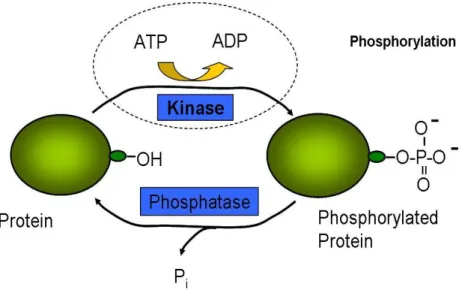
Figure 1.1: A kinase transfers phosphoryl groups from high-energy donor molecules, such as ATP, to specific target molecules
(substrate proteins); the process is termed phosphorylation……….………….... 12 Figure 1.2: Separation of analytes in the capillary by CE. The
aqua circles represent the negatively charged analytes, the purple circles represent positively charged analytes and the white
circles represent neutral analytes……….…..………...…. …13 Figure 2.1: Schematic diagram of peptidases hydrolysis position.
Further subdivisions of the exoxypeptidases and the
endopeptidases have been made on the basis of catalytic positions, dark grey ellipses represent amino acid residues and blue ellipses are the residues comprising the blocks of one, two, or three terminal amino acids that are cleaved off by different peptidases. The orange hexagons indicate the termini that provide substrates for the omega peptidases. The orange arrows point the peptide bonds which are
hydrolyzed by peptidase……… 35 Figure 2.2: The classification of the peptidase according to the
position at which they hydrolyze the peptide chain. Further categorizations are based on hydrolysis residues. The terms
are recommended by IUBMB……….………..… 36 Figure 2.3: The ribbon diagram of 3D structure of
Prolyl oligopeptidase (POP) (PDB;Iqfm). The structure is contained catalytic domain with a big cavity and Beta propeller domain in which the degradation entrance is located the center. The picture was drawn with Molsoft ICM-browser
(2011 Molsoft LLC.)……….……… 37 Figure 2.4: Close up of degradation entrance of POP in surface model.
The active site residues are buried in the tunnel which is covered by Beta propeller domain. Therefore they are invisible in this case. The entrance of catalytic cavity, which is located in the middle of the Beta propeller domain, is showing as yellow solid line in thegraph. The yellow dashed lines are indicating the measurements (9 Å) of diameter of enzyme and entrance. The image and measurements
were produced with Pymol 1.1evel………..……….... 38 Figure 2.5: Measurement of TOP binding cleft and active site in
xix
and entrance of binding cleft is measured and showing in the graph. The yellow dashed lines are indicating the measurements of cleft of enzyme. The width is about 13-21 Å and the length is about 51 Å.
The image and measurements were produced with Pymol 1.1evel……….. 39 Figure 2.6 : Close up and measurement of LAP monomer binding
cleft and active site in surface model. The active site residues are marked as blue and entrance of binding cleft is measured and showing in the graph. The yellow dashed lines are indicating the measurements of cleft of enzyme. They are 13- 23 Å. The image and
measurements were produced with Pymol 1.1evel……….……….. 40 Figure 2.7: Close up Structure of TPPII in surface model. The
active site residue Ser 462 is marked as blue. The yellow dish lines are indicating the measurements of catalytic cavity of enzyme. The size range is about 16-37 Å. The image and measurements
were produced with Pymol 1.1evel……….……….. 41 Figure 2.8: Close up and measurement of TRI central tunnel of
biological assembly in surface model. The yellow dashed lines are indicating the measurements of tunnel enzyme. The central pore measures 50 Å in diameter at its entrance and 25 Å close to the centre of the molecule. The image and measurements
were produced with Pymol 1.1evel……….……….. 42 Figure 2.9: General design of protectide-substrate conjugation reporters
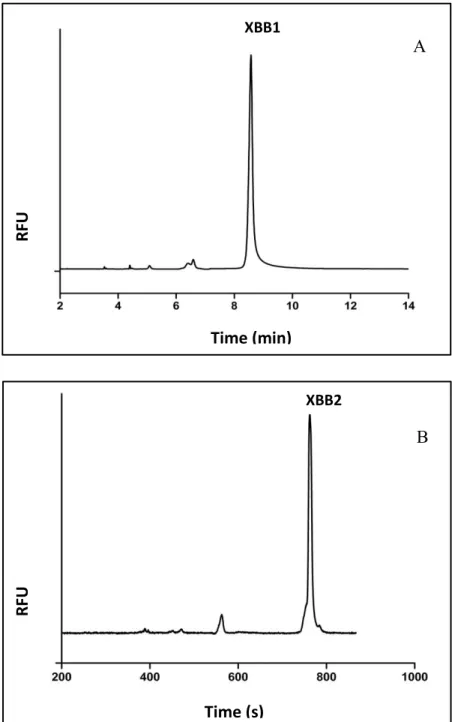
for kinase………...………. 43 Figure 2.10: Known TOP substrate peptide ELYEQKPYIL (A) and
XBB2 peptide (B) docking to the catalytic cavity of TOP…………...…….………….... 44 Figure 3.1: Philadelphia translocation. A piece of chromosome 9 and a
piece of chromosome 22 break off and trade places. The BCR-Abl gene is formed on chromosome 22 where the piece of chromosome 9 attaches.
xx
FlAsH reagent was dissolved in DMSO and TCFLN-abl in 1 x PBS
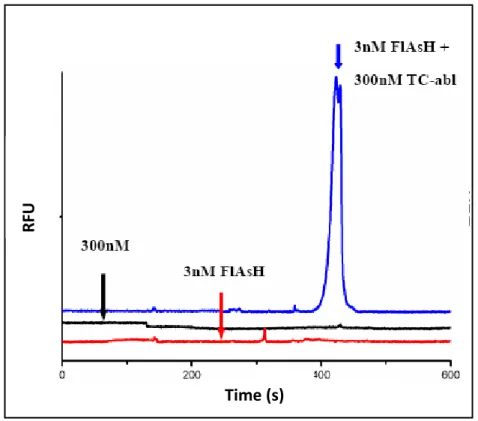
pH7.4.………...……….……… 71 Figure 3.6: CE-based analysis of biarsenical binding tothe TC-abl. Shown
are electropherograms of 3nM FlAsH (red), 300nMTCFLN-abl (black), and the TCC (blue). Run buffer is composed of 1mM DTT, 1% SDS, and 0.1M
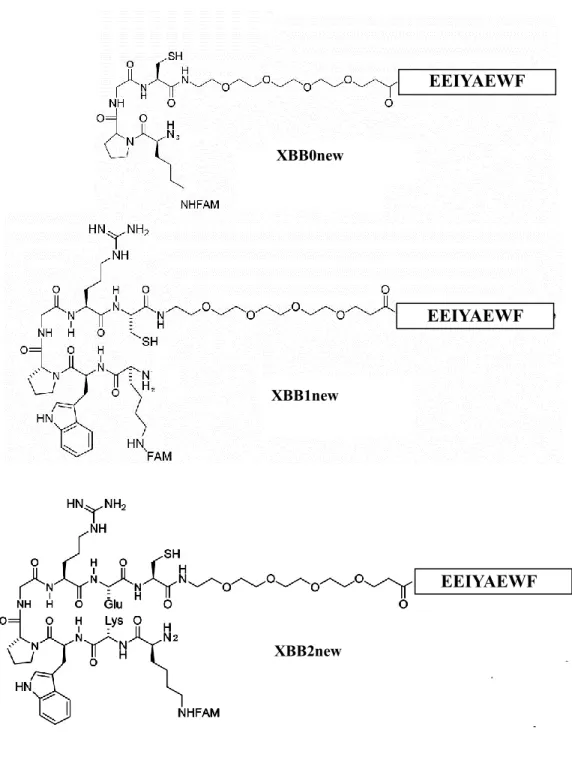
borate buffer, pH8.5………..……….…72 Figure 3.7: Backbone structures of uncrosslinked XBB0new, XBB1new
and XBB2new. There are different numbers of amino acids in the beta hairpin
motif.………...……….………. 73 Figure 3.8: Purified XBB2new peptide (indicated with arrow) is shown in RP-HPLC (A) and CE-LIF (B) results. Other peaks in the electropherogram represent
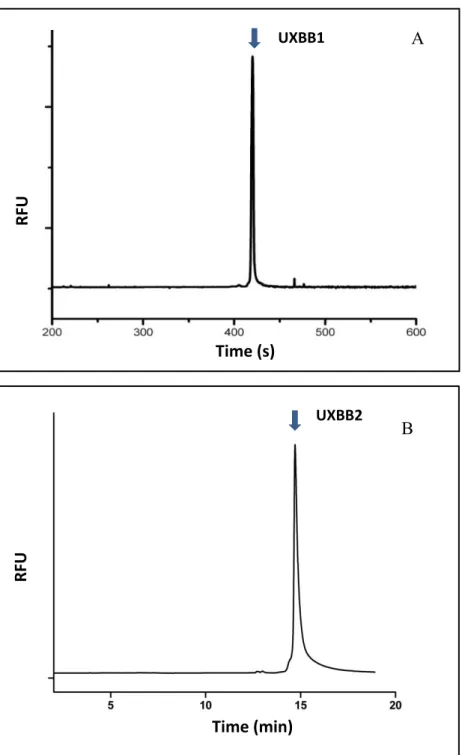
impurities.………..…….……... 74 Figure 3.9: Electropherogram of purified UXBB1 (A) and UXBB2(B).
The purity of both peptides is more than 90%...75 Figure 3.10: Electropherogram of purified XBB1 (A) and XBB2 (B).
The purity of both peptides is more than 90%.………..………... 76 Figure 3.11: HPLC purification trace of TCC-FlAsH complex. A is
the trace with fluorescence (excitation: 480 nm and emission: 530 nm)
detection and B with absorbance (220 nm)…….……….………. 77 Figure 3.12: Backbone structures of Abl, UXBB1 and UXBB2.
The structures include 4 units: protectides (Red), linker (blue), substrate (black) and fluorophore (green). Residues which can be
phosphrylated are marked as pink………..………....78 Figure 3.13: Backbone structures of XBB1, XBB2 and TCC-FlAsH.
The structures include 4 units: protectides (Red), linker (blue), substrate
(black) and fluorophore (green)……...…...………79 Figure 4.1: The diagram of CE-LIF system set up. The system includes
capillary electrophoresis section, optical section and electrical
section………..….... 121 Figure 4.2: Limit of detection of the homemade CE-LIF system.
The signal to noise is 23. The injection concentration of fluorescein
xxi
products A) Abl and phosphorylated Abl can be separated in 100mM tris/tricine pH 8.2buffer There are peak tailing for both peptides. B) TCC and phosphorylated TCC could be separated in same buffer
without peak tailing………..………….……….. 123 Figure 4.4: Electrophagram of UXBB1 and phosphorylated UXBB1
mixture (A) and XBB1 and phosphorylated XBB1 mixture (B) in buffer 100mM borate 10mM SDS pH 8.5 are showing no separation
for the substrate peptides and phosphorylated ones…………..……….………. 124 Figure 4.5: Electropherogram are showing separation of the substrate
peptide UXBB1(A) and XBB1(B) pointed by blue arrow and phosphorylated one pointed by red arrow in 20mM sodium
citrate pH 3.0………..………...………..… 125 Figure 4.6: Electropherogram showing separation of the substrate
peptide XBB2 and phosphorylated XBB2 in 100mM Tris/Tricine
5% eotrol HR pH 7.7……….……….. 126 Figure 4.7: Electrophorgrams of cell lysate degradation for Abl min.
The standard Abl min peak is showing in A and there is no Abl min
left within 1 minute in B………...………..……….... 127 Figure 4.8: Electrophorgrams of cell lysate degradation for XBB1.
The result of 1min is showing in A and XBB1 was pointed by
the arrow. The 3 minutes assay is showing in B and 5 minutes showing
in C in which there is no XBB1 left……….………... 128 Figure 4.9: Electrophorgrams of cell lysate degradation for XBB2. The
1min is showing in A and XBB1 was pointed by the arrow. The 5 minutes assay is showing in B and 10 minutes showing in C in which there is few
XBB2 left………...………..………... 129 Figure 4.10: The electrophorgrams of BaF3 cell lysate (3 mg/mL)
degradation for Sub-Abl peptide. The standard Sub-Abl peptide is pointed by the arrow. The 3 minutes and 5 minutes assay are showing
in which there is a 10% and no Abl peptide left………. 130 Figure 4.11: Electrophorgrams of BaF3 cell lysate degradation for
TCC-FlAsH. The standard peptide is showed in A and pointed by the arrow. The 3 minutes assay is showing in B and 5 minutes showing in C in which there is no parent peptide left. Other peaks represent
xxii
Figure 4.12: Degradation all designed peptide reporters in BaF3 cell
lysate over the time………...………..… 132 Figure 4.13: Electropherograms of the Sub-Abl peptide in pure Abl1
kinase assay at 5(a), 10(b), 15(c) minutes respectively. The peak of
Pho-Sub-Abl is increased over the time………...………133 Figure 4.14: Molecular devices IMAP® assay.16 Binding of the large
metal III containing nanoparticle to the phosphorylated peptide slows down the rotation of the peptide, thereby increasing its anisotropy over the
non-phosphorylated peptide………...………... 134 Figure 4.15: The rates of phosphorylation of the designed reporters
by Abl kinase fit to an equation of the form v = Vmax[ S]/ (KM+ [S]) where [S] is the concentration of the substrate peptide. A is the v vs. substrate concentration ([S]) curve for Sub-Abl and B is UXBB1 peptide. The solid lines represent the fits to the Michaelis-Menten
equation………... 135 Figure 4.16: The rates of phosphorylation of the designed
reporters by Abl kinase fit to an equation of the form v = Vmax[ S]/ (KM+ [S]) where [S] is the concentration of the substrate peptide. A is the v vs. substrate concentration ([S]) curve for UXBB2 and B is XBB1 peptide. The solid
lines represent the fits to the Michaelis-Menten equation……….……… 136 Figure 4.17: The rates of phosphorylation of the designed
reporters by Abl kinase fit to an equation of the form
v = Vmax[ S]/ (KM+ [S]) where [S] is the concentration of the substrate peptide. A is the v vs. substrate concentration ([S]) curve for XBB2 and B is TCC-FlAsH peptide. The solid lines represent
the fits to the Michaelis-Menten equation……….……… 137 Figure 4.18: Cell lysate kinase assay of XBB2 peptide.
A as control is cell lysate assay with inhibitor Gleevec at 10minutes and B is the assay at 10 minutes without inhibitor. The
parent peptide XBB2 and Pho-XBB2 are pointed by arrow. Other peaks represent the degradation products in
cell lysate………..……….……….…. 138 Figure 4.19: Cell lysate kinase assay of ABL, XBB2 and
TCC-FlAsH peptide. The peptide XBB2 shows the most
xxiii
Figure 4.20: Pinocytosis loading the Oregon green to BaF3 cell line. The transparent light image is A and Fluorescent light image (B) shows that no fluorescent dye was loaded into
BaF3 cell by this method………...……...………... 140 Figure 4.21: Electropherograms of peptide Abl single cell assay
using microinjection loading method. A is standard mixture of Abl and phosphorylated XBB2. B is assayat 20 minuts and c is assay with the single cell pre-incubated by inhibiter Gleevec. The results are showing that no phosphorylation of the Abl peptide and fully
degradation was detected in this condition………... 141 Figure 4.22: Electropherograms of peptide XBB2 single cell assay
using microinjection loading method. A is standard mixture of XBB2 and phosphorylated XBB2. B is assay at 20 minuts and C is assay with the single cell pre-incubated by inhibiter Gleevec. The results are showing that phosphorylation of the XBB2 peptide in 20 minutes
assay was detected in this condition………..……… 142 Figure 4.23: Phosphorylation percentage of XBB2 in 10 single cell assays with 20 minutes incubation.……….…………...……….…....143 Figure 5.1: Electrophegram of the known 67B fragments
(A) and the generated by Pronase E assay (B). The result show all fluorescent fragments (Peak 1-12) which showing in A as the
studendard are showing in the result in pronase E assay………..………. 157 Figure 5.2: MALDI of the pronase assay for HER-2 peptide. The
MALDI trace of peptide Her-2 and all fluorescent fragments are showing in 10 min assay mixture. Sequence of each fragment is listed
in Table 6.2……..………..………..158 Figure 5.3: MALDI and CE result of the Pronase assay for XBB1. The
MALDI result of peptide is showing all MW of the fluorescent fragments of XBB1 (A). The parent peptide XBB1 (pointed by arrow) and the
fragments (other peaks) are showing in CE trace (B)……….………159 Figure 6.1: Schematic representation of the primary structure of
conventional, novel, and atypical protein kinase Cs. Indicated are the pseudosubstrate domain (pink), C1 domain comprising one or two Cys-rich motifs (purple), C2 domain (blue) in the regulatory domain, and catalytic region including the C3 (ATP binding region, orange) and C4 substrate-binding lobe (green). nPKCs have a C2-like
xxiv
Figure 6.2: Backbone structures of WKpG-PKC and Trpk-PKC……….. 182 Figure 6.3: Backbone structures of WKpG-PKC and Trpk-PKC……….. 183 Figure 6.4: The Scram-PKC and phosphorylated Scram-PKC showed
no separation in 100 mM Borate and 100 mM SDS buffer pH 8.2……… 184 Figure 6.5: The WKpG-PKC and phosphorylated WKpG-PKC
(Pho- WKpG-PKC) are separated in 250 mM Phosphoric acid pH 1.5. The Pho- WKpG-PKC peak increased over time when incubated
with PKC α………. 185 Figure 6.6: The Trpk-PKC and degradation fragments (Table 5.3)
indicated by arrows are separated in 250 mM Phosphoric acid pH 1.5………. 186 Figure 6.7: Degradation of the designed PKC reporters in OPM-2
cell lysate. Samples of the reaction mixture were removed at varying time points and the amount of degradation of peptide was measured. The substrate with the fastest degradation was Scram-PKC while WKpG-PKC processed the longest life time in
this lysate……… 187
Figure 6.8: Phosphorylation of the designed PKC reporters by
PKC α kinase……….. 188 Figure 6.9: Phosphorylation of the designed PKC reporters in
OPM-2 cell lysate……….……189 Figure 6.10: PKC reporter WKpG-PKC loading into OPM-2 cells.
Control cells incubated without reporters (A-B) and experimental cells incubated with Scram-PKC for 20 min (C-D). (A) and (C)
are transmitted light images and (B) and (D) are fluorescent images……….….190 Figure 7.1: Intracellular protein degradation pathways. The most
intracellular protein are ubiquitinated and degraded into peptides by proteasome. These peptide are degraded further by peptidase into
amino acid which can be used for protein synthesis by ribosome……….. 208 Figure 7.2 General design of the degron- protectide peptide reporters
for proteasome activity. There are five key parts including degron, linker,
xxv
Figure 7.3: 20S assay of know substrate Suc-LLVY-AMC and different inhibitors at different concentration. The Inhibitor1 is
Ada-Y-(Ahx)3-L3-Vinyl sulfone and inhibitor2 is Bortezimib………...210 Figure 7.4: Fluorescence imaging of gel electrophoresis of peptide
BC-4-TrpK uiquntination assay using S100 cell lysate and methylation ubiquitin (MeUb). The band above BC-TrpK (13.6 kD) is single MeUb linked peptide (MeUb-BC-4-TrpK). Other two bands could be multi ubiquitinated peptide because of ubiquitination using endogenous ubiquitin. The bands below the BC-TrpK
could be the degradation products………..…..211 Figure 7.5: Fluorescence imaging of gel electrophoresis of peptide BC-4
ubiquitination assay using S100 cell lysate. The bands above the BC-4 (3.6 kD) could be mono, two and 3 ubiquitinated products with methylation ubiquitin (MeUb). The bands below the BC-TrpK
could be the degradation products………... 212 Figure 7.6: Fluorescence imaging of gel electrophoresis of peptide
Tripzip and BC-4-TrpK in uiquitination assay using S100 cell lysate. Tripzip 2 is showing no ubiquitination appear (6) while the BC-4-Trpk showed successful ubiquitination after 1 (7) and 2 hours (8) incubation. While the controls lysate only (2), peptide only (5) and –ATP (9)
shows no ubiquitination or very little ubiquitination. Lane 1 is fluorescent protein molecular weight ladder. Lane 3 and 4 are ubiquitination assay
xxvi
LIST OF ABBREVIATIONS
Abbreviation Definition
ºC degree Celsius
3D three dimensions
A alanine
A/D analog to digital
Abl able
ALL acute lymphocytic leukemia
AMC 7-amino-4-methylcoumarin
Arg Abl-related ATP adenosine-5'-triphosphate
BCR breakpoint cluster region
BME 2-Mercaptoethanol
C cysteine
CaCl2 calcium chloride
CAPS N-cyclohexyl-3-aminopropanesulfonic acid
CCD charge coupled device
CDKs cyclin-dependent kinases
CE capillary electrophoresis
xxvii D aspartic Acid
DAG diacylglycerol
DCM dichloromethane
DIPEA diisopropylethylamine
DMF dimethylformamide
DMSO dimethyl Sulfoxide
DTAB dodecyl trimethyl ammonium bromide DTT DL-Dithiothreitol
E glutamic acid
ECB excellular cell buffer
EDT ethane dithiol
EDTA ethylenediaminetetraacetic acid EGFR epidermal growth factor receptor
EOF electroosmotic flow
ESI electrospray ionization
ER endoplasmic reticulum
F phenylalanine
FBS fetal bovine serum
xxviii
F-moc 9-fluorenyl- methyloxycarbonyl G glycine
H histidine
HBTU 2-(1H-Benzotriazole-1-yl)-1,1,3,3-tetramethyluronium hexafluorophosphate
HEPES (4-(2-hydroxyethyl)-1-piperazineethanesulfonic acid )
HCL hydrochloric acid
HOBT hydroxybenzotriazole
HPLC high-performance liquid chromatography
HR high reverse
I isoleucine
i.d. inner diameter
IMAP ion affinity-based fluorescence polarization
kDa kiloDalton
K lysine L leucine
LAP leucine aminopeptidase
LC liquid chromatography
LIF laser-induced fluorescence detection
LOD limit of detection
LR low reverse
Lys lysine
xxix
MALDI matrix-assisted laser desorption/ionization
MDa mega dalton
MeOH methanol
mg milli gram
MgCl2 magnesium chloride
min minute
mL milli liter
MM multiple myeloma
mM milli more
MS mass
MTTC molecularly targeted therapy for cancer
mW milli watts
N asparagine
N.A. numerical aperture
NaCL sodium Chloride
NaOH sodium hydroxide
ng nano gram
nm nano meter
NMR nuclear magnetic resonance
o.d. outer diameter
P proline
xxx
PDB protein data bank
PEG polyethylene glycol
pH hydrogen ion concentration
PKB protein kinase B
PKC Protein kinase C
pL pico liter
PMA phorbol-12-myristate-13-acetate
PMT photo multiplier tube
POP prolyl oligopeptidase
PS polystyrene
PS phosphatidylserine
PVDF polyvinylidene fluoride Q glutamine
rpm revolutions per minute
RP reversed phase
RPMI roswell park memorial institute S serine
S/N signal to noise ratio
SDC CTAB sodium deoxycholate cetrimonium bromide
SDS sodium dodecyl sulfate
xxxi
TCEP tris(2-carboxyethyl)phosphine TFA trifluoroacetic acid
TIPS triisopropylsilane
TOF time of flight
TOP thimet oligopeptidase
TPA 12-O-tetradecanoylphorbol 13-acetate TPPII tripeptidylpeptidase II
TRI tricone peptidase
Tris 1,1,1-tris(hydroxymethyl)-methanamine UPLC ultra performance liquid chromatography
UPS ubiquitin-proteasome system
V valine
v/v volume/volume
VEGFR vascular endothelial growth factor W tryptophan
μm micro meter
μM micro mole
µg micro gram
µL micro liter
xxxii
LIST OF SYMBOLS
Symbol Definition
Å Angstrom
% percentage
M molarity
V voltage
N normality
g earth's gravitational acceleration
x times
I‖ fluorescence intensity parallel to the excitation plane I⊥ fluorescence intensity perpendicular to the excitation plane
KM Michaelis constant
Vmax theoretical maximal velocity
Chapter 1: Introduction 1.1Protein Kinases in Cancer
1.1.1 Protein Kinases and Phosphorylation
A protein kinase is one type of enzyme that helps to transfer phosphoryl group to target proteins. In eukaryotic cells, kinases catalyze the reaction of the addition of the phosphoryl group from adenosine-5'-triphosphate (ATP) to a serine, threonine or tyrosine residue on substrates.1-4 This whole process is known as phosphorylation (Figure 1.1). In a mammalian cell, phosphorylation occurs at some time in almost one third of the proteins. Therefore, phosphorylation is one of the most important post-translational modifications.4-7 1.1.2 Phosphorylation in Cell Signal Transduction.
The importance of phosphorylation in cellular metabolism has been studied for more than one hundred years.8,9 Over the decades, researchers discovered that protein kinases play a key role in regulating biochemical signaling pathways in eukaryotic cells and the signal
transduction is essential for almost all aspects of cell functions.10,11 The signal transduction process begins with the binding of extracellular signaling molecules to receptors at the cell surface. These binding actions often induce the activation of kinases. The organization of these activated kinases and their substrates form a phosphorylation cascade. The
2
pathways in cells and mediating signal transduction. As a result, phosphorylation cascade controls almost all cellular processes including metabolism, cell cycle progression,
transcription, cytoskeletal rearrangement and cell motility, apoptosis, and differentiation.11-19 The control of signal transduction by phosphorylation occurs by several different mechanisms. First, a change in protein activity can come from the added bulk and charge of the phosphate group, or from a conformational change in the protein, or both.20,21 For
example, phosphorylation of a prion protein at serine 43 induces a change of conformation to its disease-associated form.22 Second, the change in activity can be caused by the creation of a new recognition site in the phosphorylated protein to which another protein can bind. For instance, the phosphorylation-dependent binding of an adaptor molecule, clathrin AP2, to the phosphorylated GABAA (γ-aminobutyric acid) receptor regulates the efficiency of synaptic transmission.23 In general, phosphorylation controls protein activity such as enzymatic activity, interaction with other molecules, location in the cell, and propensity for degradation.
22-26 By this way, phosphorylation directs cell signal transduction and is deeply involved in
almost all cellular processes.
1.1.3 Dysregulation of Kinases in Cancer Cells
Cancer is a disease known to be characterized by abnormal activities in cellular growth, proliferation, and survival pathways.27 Today, cancer represents one of the most urgent health challenges. Cancer is frequently fatal since cell division in cancer is
3
To date, approximately 120 known oncogenes which encode for kinases have been identified.33 In the cell, even a single mutation of a kinase-encoding gene can change the expression, conformation, or stability of a kinase. Since as discussed above, kinases play a central role in mediating diverse intracellular signaling pathways, a gene mutation of this sort affects the signaling pathway as a whole and can result in the inappropriate regulation of cell growth and survival which underlies the cancer phenotype.30 For example, the mutated oncogenic protein BCR-Abl, which results in the improper activation of the catalytic activity of Abelson protein tyrosine kinase (Abl) and leads to the formation of chronic myelogenous leukemia (CML) in humans, is a fusion between the Abl kinase and the Breakpoint Cluster Region (BCR) protein.34-36 In addition, inappropriate kinase activity can also result from defects in upstream regulatory proteins. Many kinases in pathways downstream of activated oncogenes are only rarely mutated or overexpressed in tumors, but are critical regulators of oncogenic signaling (e.g. protein kinase B (PKB)).37-39
1.2 Molecularly Targeted Therapy for Cancer (MTTC) 1.2.1 Molecularly Targeted Therapy
Molecularly targeted therapy refers to a type of therapy which kills cancer cells by interfering with specific molecules involved in tumor growth and progression.44 Compared to traditional treatments like chemotherapy and radiotherapy, MTTC has been regarded as a potential treatment which is more effective and less harmful to normal cells. Therefore, now MTTC is at the forefront of a revolution in cancer therapy.40
1.2.2 Targeting Protein Kinases for Cancer Therapy
4
molecularly targeted therapy in oncology research. Kinase inhibitors have shown great promise in blocking or modulating the activity of select kinases controlling tumor
progression. Based on these basic research developments, protein kinases have become a very attractive group of drug targets.41-47
Recently, clinical experience with tyrosine kinase inhibitors has demonstrated that the inhibition of a dysregulated kinase often brings an effective clinical benefit. For example, imatinib (Gleevec), a molecularly targeted drug inhibiting BCR-Abl, has shown dramatic clinical success in treating CML.48-50 Such success has initiated extensive efforts to develop small molecule inhibitors and monoclonal antibodies against a variety of protein kinases. 49,51-58
Since the FDA approved the use of imatinib for CML treatment, six more small-molecule kinase inhibitors have been approved. Currently, multiple therapies targeting receptors for tyrosine kinases or intracellular kinases can be found on the market. As the same time, pharmaceutical and biotechnology companies are developing an increasing number of drugs targeting kinases and using them in clinical trials for various cancers and other diseases. 40,53-60
5
provide important information for diagnosis and on treatment response.42 ,43 1.3 Challenges in Measurement of Kinase Activity in Clinical Samples 1.3.1 Requirements for Clinical Measurements
6 1.3.2 Limitations of Current Assays
A number of methods for investigating kinase activity are available, but most of them require large numbers of cells, therefore limiting their use in clinical applications.69 For example, western blotting has been used in clinical trials; however, it provides only a
qualitative measurement, requires large numbers of cells, and is limited by the availability of validated antibodies.70 Flow cytometry has been proven powerful for single-cell analysis of patient samples, but it also requires large numbers of cells per assay and needs extensive optimization to achieve reproducible results. Flow cytometry is even more limited by availability of validated phospho-specific antibodies.71-73 Mass spectrometry is another powerful tool for analysis of phosphoproteins, but it requires very large numbers of cells and is not expected to be applicable in the foreseeable future due to this lack of sensitivity 70,74 Immunohistochemical staining of phospho-proteins in tissue has been used in an analogous fashion, but suffers from problems with quantification.75,76 Recently, a new technology based on isoelectric focusing and chemiluminescence combined with antibody recognition may make it possible to generate data equivalent to western blotting from small samples of cells, but at present, this method lacks validated targets and has inadequate sensitivity for single-cell assays.76,77 Finally, kinase assays based on genetically engineered fluorescent protein constructs have been developed, but are not amenable to assays in patient cells.71 Overall, there exists a strong requirement for an assay that measures relevant enzyme activity directly and sensitively in primary tumor samples before and after treatment.
1.4 Microelectrophoretic Techniques for Cellular Kinase Activity Measurements 1.4.1 Previous Work on Microelectrophoretic Techniques
7
method by Jorgenson and Lukacs in the 1980s.78 CE uses a small internal diameter, fused silica capillary filled with an electrolytic buffer. Once the capillary is loaded with sample, high voltage is applied across the capillary ends and the components of the sample are separated within the capillary based on their different mobilities in an electric field.
Electroosmotic flow (EOF) arises at the charged capillary wall and works as a mobile “pump” to sweep all species in the capillary toward one terminal. Velocity of migration is
determined by both the individual sample component’s electrophoretic migration and the electroosmotic mobility of the buffer (Figure 1.2).
CE is a well-established technology for protein and peptide analysis. This technique has been successfully applied to protein and peptide separations in several fields, such as the separation of proteolytic fragments and other metabolic products. Combined with mass spectrometry, CE becomes a powerful analytical tool for proteomic studies.79-81 More recently, this technique has been used to analyze the contents of single cells or small cell sample size in the field known as chemical cytometry. Electrophoretic separation combined with laser-induced fluorescence detection (LIF) is one of the most sensitive methods used for protein investigation, enabling numerous biochemical studies in single cells.82-86 For
8
non-phosphorylated species in an electropherogram. In addition, CE was also applied to successfully separate the degradation products of peptides,81 making CE a powerful tool for monitoring peptide degradation.90
The Allbritton group has pioneered the development of single-cell assays for chemical cytometry and studied new reagents and instrumentation. To support research on signal transduction, particularly kinase assays,90-97 a system was developed for single-cell assays. This platform integrates an inverted microscope, a pulsed laser, an LIF detection system, and a CE setup to provide several advantages for single cell assays, such as fast cell lysis, high sensitivity, the potential for multiplexed measurements of several kinases, and monitoring of cells in real-time.
Chemical cytometry experiments are performed on this instrument as follows: First, cells are loaded with fluorescently labeled substrates, which act as reporters for the activity of the target enzymes within the cells. The substrates can be fluorescent peptides or lipids. For protein kinase assays, the substrates contain a serine, threonine or tyrosine residue which can be recognized and phosphorylated by target kinases.96 After cells were loaded with substrates and attached to the sample dish, a nono-second pulsed laser was fired at a position close to the cell. The plasma generated by the laser pulse lysed the cell within tens of micro seconds. Immediately after lysis, the cellular contents were electrokinetically injected into the capillary and separated by CE. The reporters are typically labeled with carboxy
9
assayed at the same time in single cells so far and substantially greater multiplexing is
possible due to the very high separation efficiency of micro-electrophoretic methods. 90,92-94,96-98
1.4.2 Cytosolic Degradation as a Limitation of Peptide Reporters for Cell Assays Although the peptide reporters have been shown effective, a major pitfall is the degradation by intracellular proteases. This degradation drastically shortens the lifetime of the peptides inside the cell, decreasing their utility as reporters. For example, as the peptide reporter degrades, the signals for the phosphorylated and unmodified forms become spread out over multiple peaks, making them harder to detect.
Intracellular proteolysis is a natural process in the cell which controls the turnover of proteins and the amount of peptides (antigens) present. This degradation process typically involves the ubiquitin-proteasome system, as well as several aminopeptidases and
endopeptidases. In eukaryotic cells, a protein is first degraded by the 26S proteasome into oligopeptides that are either the correct size for antigenic peptides or extended on their N-termini. Aminopeptidases in the cytosol or ER trim the N-extended precursors into antigenic peptides of the correct length. Proteosome products and other oligopeptides undergo
degradation by endo- and exopeptidases. With the effect of the combination of the above process, a peptide reporter’s stability within the cell is limited.99-103
Key cytoplasmic peptidases include tripeptidylpeptidase II (TPPII), thimet
10
substrate peptide is buried deep within the cleft.102,104,105 This dissertation focuses on utilizing this aspect of peptidase structure to slow peptide degradation in cells.
1.5 Research Goals and Scope of the Dissertation 1.5.1 Main Goal of This Work
The overall objective of this research was to develop cytosolic peptidase resistant reporters for intracellular kinase activity in a single living cell assay. This goal is further to divided into three sub-goals. First, the designed reporters must have the ability to resist cytosolic degradation. Second, the reporters needed to remain a substrate of the target kinase. Third, the reporters needed to be small and cell membrane permeable.
1.5.2 Scope of the Dissertation
This project was completed in collaboration with Dr. Marcey L. Waters’ laboratory. In order to prevent degradation of peptide reporters by cytosolic peptidases, it is very important to investigate the mechanism by which cytosolic peptidases degrade their
substrates. The first step of the work, described in Chapter 2, was a study of the degradation mechanisms and structure of cytosolic peptidases. The unique groove structure of the
11
Based on the successful development of peptidase resistant BCR-Abl kinase reporters using protectides, protectides were also applied to reporters for protein kinase C and the
12 1.6 Figures
13
Figure 1.2 Separation of analytes in the capillary by CE. The aqua circles represent the negatively charged analytes, the purple circles represent positively charged analytes and the white circles represent neutral analytes.
Detection window for laser-based excitation and collection of fluorescence emission
EOF
14 1.7 References
(1) Burnett, G.; Kennedy, E. P. J Biol Chem 1954, 211, 969.
(2) Schiltz, E.; Sekeris, C. E. Hoppe Seylers Z Physiol Chem 1969, 350, 317.
(3) Stahl, J.; Bohm, H.; Bielka, H. Acta Biol Med Ger 1974, 33, 667.
(4) Hanks, S. K.; Hunter, T. FASEB J 1995, 9, 576.
(5) Chardot, T.; Benetti, P. H.; Canonge, M.; Kim, S. I.; Chaillot, D.; Fouques, D.; Meunier, J. C. Nahrung 1998, 42, 145.
(6) Leonard, C. J.; Aravind, L.; Koonin, E. V. Genome Res 1998, 8, 1038.
(7) Ptacek, J.; Devgan, G.; Michaud, G.; Zhu, H.; Zhu, X.; Fasolo, J.; Guo, H.; Jona, G.; Breitkreutz, A.; Sopko, R.; McCartney, R. R.; Schmidt, M. C.; Rachidi, N.; Lee, S. J.; Mah, A. S.; Meng, L.; Stark, M. J.; Stern, D. F.; De Virgilio, C.; Tyers, M.; Andrews, B.; Gerstein, M.; Schweitzer, B.; Predki, P. F.; Snyder, M. Nature 2005, 438, 679.
(8) Marks, F.; Boukamp, P. J Cancer Res Clin Oncol 1997, 123, 522.
(9) Ehlers, R. A., 2nd; Bonnor, R. M.; Wang, X.; Hellmich, M. R.; Evers, B. M. Surgery 1998, 124, 239.
(10) Dhanasekaran, N.; Premkumar Reddy, E. Oncogene 1998, 17, 1447.
(11) Gabbita, S. P.; Robinson, K. A.; Stewart, C. A.; Floyd, R. A.; Hensley, K. Arch Biochem Biophys 2000, 376, 1.
(12) Roman, R. J.; Harder, D. R. J Am Soc Nephrol 1993, 4, 986.
(13) Schulte am Esch, J. Anasthesiol Intensivmed Notfallmed Schmerzther 1999, 34, 77.
15
(15) Saltiel, A. R.; Decker, S. J. Bioessays 1994, 16, 405.
(16) Dierick, H.; Bejsovec, A. Curr Top Dev Biol 1999, 43, 153.
(17) Li, S. Int J Biol Sci 2005, 1, 152.
(18) Prog Clin Biol Res 1987, 249, 1.
(19) Sumioka, A.; Yamamoto, T.; Suzuki, T. Seikagaku 2006, 78, 949.
(20) Mazzoni, I. E.; Ledebur, H. C., Jr.; Paramithiotis, E.; Cashman, N. Biochem Cell Biol 2005, 83, 644.
(21) She, Y. M.; Xu, X.; Yakunin, A. F.; Dhe-Paganon, S.; Donald, L. J.; Standing, K. G.; Lee, D. C.; Jia, Z.; Cyr, T. D. J Proteome Res 2010, 9, 3311.
(22) Giannopoulos, P. N.; Robertson, C.; Jodoin, J.; Paudel, H.; Booth, S. A.; LeBlanc, A. C. J Neurosci 2009, 29, 8743.
(23) Kittler, J. T.; Chen, G.; Honing, S.; Bogdanov, Y.; McAinsh, K.; Arancibia-Carcamo, I. L.; Jovanovic, J. N.; Pangalos, M. N.; Haucke, V.; Yan, Z.; Moss, S. J. Proc Natl Acad Sci U S A 2005, 102, 14871.
(24) Larsen, M. R.; Sorensen, G. L.; Fey, S. J.; Larsen, P. M.; Roepstorff, P. Proteomics 2001, 1, 223.
(25) Mimura, S.; Seki, T.; Tanaka, S.; Diffley, J. F. Nature 2004, 431, 1118.
(26) McKendrick, L.; Milne, D.; Meek, D. Mol Cell Biochem 1999, 191, 187.
(27) Weber, B. L. Cancer Cell 2002, 1, 37.
(28) Futreal, P. A.; Coin, L.; Marshall, M.; Down, T.; Hubbard, T.; Wooster, R.; Rahman, N.; Stratton, M. R. Nat Rev Cancer 2004, 4, 177.
16
(30) Alexander, D. R. Cell Cycle 2004, 3, 584.
(31) Manning, G.; Whyte, D. B.; Martinez, R.; Hunter, T.; Sudarsanam, S. Science 2002, 298, 1912.
(32) Tsatsanis, C.; Spandidos, D. A. Int J Mol Med 2000, 5, 583.
(33) Bridges, A. J. K., A. J. 1997, 1314.
(34) Laneuville, P. Semin Immunol 1995, 7, 255.
(35) Advani, A. S.; Pendergast, A. M. Leuk Res 2002, 26, 713.
(36) O'Dwyer, M. E.; Druker, B. J. Curr Opin Oncol 2000, 12, 594.
(37) Press, M. F.; Lenz, H. J. Drugs 2007, 67, 2045.
(38) Dowell, J. E.; Minna, J. D. Nat Clin Pract Oncol 2006, 3, 170.
(39) Podar, K.; Raab, M. S.; Zhang, J.; McMillin, D.; Breitkreutz, I.; Tai, Y. T.; Lin, B. K.; Munshi, N.; Hideshima, T.; Chauhan, D.; Anderson, K. C. Blood 2007, 109, 1669.
(40) http://www.cancer.gov/cancertopics/factsheet/Therapy/targeted .
(41) Pearson, M. A.; Fabbro, D. Expert Rev Anticancer Ther 2004, 4, 1113.
(42) Fabbro, D.; Garcia-Echeverria, C. Curr Opin Drug Discov Devel 2002, 5, 701.
(43) Cohen, P. Nat Rev Drug Discov 2002, 1, 309.
(44) Ventura, J. J.; Nebreda, A. R. Clin Transl Oncol 2006, 8, 153.
17
(46) Sharma, S. V.; Settleman, J. Genes Dev 2007, 21, 3214.
(47) Stinchcombe, T. E.; Ramalingam, S. S. Lancet Oncol 2010, 11, 500.
(48) O'Hare, T.; Deininger, M. W.; Eide, C. A.; Clackson, T.; Druker, B. J. Clin Cancer Res 2011, 17, 212.
(49) Slupianek, A.; Pytel, D.; Majsterek, I. Postepy Hig Med Dosw (Online) 2007, 61, 819.
(50) Christoffersen, T.; Guren, T. K.; Spindler, K. L.; Dahl, O.; Lonning, P. E.; Gjertsen, B. T. Eur J Pharmacol 2009, 625, 6.
(51) Govindan, R. J Thorac Oncol 2010, 5, S433.
(52) Dancey, J. E.; Chen, H. X. Nat Rev Drug Discov 2006, 5, 649.
(53) Druker, B. J. Oncologist 2004, 9, 357.
(54) Lee, H. Y.; Lee, K. S.; Hwang, H. S.; Lee, J. W.; Ahn, M. J.; Park, K.; Kim, T. S.; Yi, C. A.; Chung, M. J. Korean J Radiol 2010, 11, 618.
(55) Le Tourneau, C. Bull Cancer 2010, 97, 1453.
(56) Nahleh, Z. A. Recent Pat Anticancer Drug Discov 2008, 3, 100.
(57) Wiedmann, M. W.; Caca, K. Curr Cancer Drug Targets 2005, 5, 171.
(58) Judson, I.; Barriuso, J. Br J Surg 2008, 95, 537.
(59) Crown, J.; Pegram, M. Breast Cancer Res Treat 2003, 79 Suppl 1, S11.
18
(61) Zagouri, F.; Bozas, G.; Kafantari, E.; Tsiatas, M.; Nikitas, N.; Dimopoulos, M. A.; Papadimitriou, C. A. Obstet Gynecol Int 2010, 2010, 749579.
(62) Rubin, A. F.; Green, P. Science 2007, 317, 1500.
(63) Getz, G.; Hofling, H.; Mesirov, J. P.; Golub, T. R.; Meyerson, M.; Tibshirani, R.; Lander, E. S. Science 2007, 317, 1500.
(64) Forrest, W. F.; Cavet, G. Science 2007, 317, 1500; author reply 1500.
(65) Sjoblom, T.; Jones, S.; Wood, L. D.; Parsons, D. W.; Lin, J.; Barber, T. D.; Mandelker, D.; Leary, R. J.; Ptak, J.; Silliman, N.; Szabo, S.; Buckhaults, P.; Farrell, C.; Meeh, P.; Markowitz, S. D.; Willis, J.; Dawson, D.; Willson, J. K.; Gazdar, A. F.; Hartigan, J.; Wu, L.; Liu, C.; Parmigiani, G.; Park, B. H.; Bachman, K. E.; Papadopoulos, N.; Vogelstein, B.; Kinzler, K. W.; Velculescu, V. E. Science 2006, 314, 268.
(66) Sherbenou, D. W.; Druker, B. J. J Clin Invest 2007, 117, 2067.
(67) Wang, Y. L.; Bagg, A.; Pear, W.; Nowell, P. C.; Hess, J. L. Genes Chromosomes Cancer 2001, 32, 97.
(68) Radich, J. P.; Oehler, V. J Natl Compr Canc Netw 2007, 5, 497.
(69) Knight, Z. A.; Shokat, K. M. Chem Biol 2005, 12, 621.
(70) Hattori, S.; Iida, N.; Kosako, H. Expert Rev Proteomics 2008, 5, 497.
(71) Sims, C. E.; Allbritton, N. L. Curr Opin Biotechnol 2003, 14, 23.
(72) Chow, S.; Patel, H.; Hedley, D. W. Cytometry 2001, 46, 72.
(73) Jilani, I.; Kantarjian, H.; Gorre, M.; Cortes, J.; Ottmann, O.; Bhalla, K.; Giles, F. J.; Albitar, M. Leuk Res 2008, 32, 643.
19
(75) Papadopoulos, N.; Kinzler, K. W.; Vogelstein, B. Nat Biotechnol 2006, 24, 985.
(76) O'Neill, R. A.; Bhamidipati, A.; Bi, X.; Deb-Basu, D.; Cahill, L.; Ferrante, J.; Gentalen, E.; Glazer, M.; Gossett, J.; Hacker, K.; Kirby, C.; Knittle, J.; Loder, R.; Mastroieni, C.; Maclaren, M.; Mills, T.; Nguyen, U.; Parker, N.; Rice, A.; Roach, D.; Suich, D.; Voehringer, D.; Voss, K.; Yang, J.; Yang, T.; Vander Horn, P. B. Proc Natl Acad Sci U S A 2006, 103, 16153.
(77) Fan, A. C.; Deb-Basu, D.; Orban, M. W.; Gotlib, J. R.; Natkunam, Y.; O'Neill, R.; Padua, R. A.; Xu, L.; Taketa, D.; Shirer, A. E.; Beer, S.; Yee, A. X.; Voehringer, D. W.; Felsher, D. W. Nat Med 2009, 15, 566.
(78) Jorgenson, J. W.; Lukacs, K. D. Clin Chem 1981, 27, 1551.
(79) Ahmed, F. E. Expert Rev Proteomics 2008, 5, 841.
(80) Ahmed, F. E. Expert Rev Proteomics 2009, 6, 171.
(81) Herold, M.; Ross, G. A.; Grimm, R.; Heiger, D. N. Methods Mol Biol 1996, 52, 285.
(82) Turner, E. H.; Cohen, D.; Pugsley, H. R.; Gonzalez Gomez, D.; Whitmore, C. D.; Zhu, C.; Dovichi, N. J. Anal Bioanal Chem 2008, 390, 223.
(83) Cohen, D.; Dickerson, J. A.; Whitmore, C. D.; Turner, E. H.; Palcic, M. M.; Hindsgaul, O.; Dovichi, N. J. Annu Rev Anal Chem (Palo Alto Calif) 2008, 1, 165.
(84) Dovichi, N. J.; Hu, S. Curr Opin Chem Biol 2003, 7, 603.
(85) Cannon, D. M., Jr.; Winograd, N.; Ewing, A. G. Annu Rev Biophys Biomol Struct 2000, 29, 239.
(86) Heien, M. L.; Ewing, A. G. Methods Mol Biol 2009, 544, 153.
20
(88) Zhou, S.; Lin, J.; Du, W.; Zhang, Z.; Luo, Q.; Liu, B. F.; Dai, Y. J Chromatogr B Analyt Technol Biomed Life Sci 2006, 844, 158.
(89) Che, F. Y.; Shao, X. X.; Xu, L. G.; Zeng, R.; Xia, Q. C. Sheng Wu Hua Xue Yu Sheng Wu Wu Li Xue Bao (Shanghai) 1997, 29, 363.
(90) Meredith, G. D.; Sims, C. E.; Soughayer, J. S.; Allbritton, N. L. Nat Biotechnol 2000, 18, 309.
(91) Luzzi, V.; Sims, C. E.; Soughayer, J. S.; Allbritton, N. L. J Biol Chem 1998, 273, 28657.
(92) Lee, C. L.; Linton, J.; Soughayer, J. S.; Sims, C. E.; Allbritton, N. L. Nat Biotechnol 1999, 17, 759.
(93) Sims, C. E.; Meredith, G. D.; Krasieva, T. B.; Berns, M. W.; Tromberg, B. J.; Allbritton, N. L. Anal Chem 1998, 70, 4570.
(94) Li, H.; Sims, C. E.; Kaluzova, M.; Stanbridge, E. J.; Allbritton, N. L. Biochemistry 2004, 43, 1599.
(95) Lee, K. J.; Mwongela, S. M.; Kottegoda, S.; Borland, L.; Nelson, A. R.; Sims, C. E.; Allbritton, N. L. Anal Chem 2008, 80, 1620.
(96) Li, H.; Sims, C. E.; Wu, H. Y.; Allbritton, N. L. Anal Chem 2001, 73, 4625.
(97) Mwongela, S. M.; Lee, K.; Sims, C. E.; Allbritton, N. L. Electrophoresis 2007, 28, 1235.
(98) Soughayer, J. S.; Wang, Y.; Li, H.; Cheung, S. H.; Rossi, F. M.; Stanbridge, E. J.; Sims, C. E.; Allbritton, N. L. Biochemistry 2004, 43, 8528.
(99) Reits, E.; Griekspoor, A.; Neijssen, J.; Groothuis, T.; Jalink, K.; van Veelen, P.; Janssen, H.; Calafat, J.; Drijfhout, J. W.; Neefjes, J. Immunity 2003, 18, 97.
21
(101) Kessler, B. M.; Glas, R.; Ploegh, H. L. Mol Immunol 2002, 39, 171.
(102) Kloetzel, P. M. Nat Immunol 2004, 5, 661.
(103) Saric, T.; Graef, C. I.; Goldberg, A. L. J Biol Chem 2004, 279, 46723.
(104) York, I. A.; Mo, A. X.; Lemerise, K.; Zeng, W.; Shen, Y.; Abraham, C. R.; Saric, T.; Goldberg, A. L.; Rock, K. L. Immunity 2003, 18, 429.
22
Chapter 2: Proposed Design of Peptidase Resistant Reporters Based on the Structural Study of Cytosolic Peptidases
2.1 Introduction
2.1.1 Intracellular Protein Degradation
The degradation of reporters by cytosolic peptidases limits the use of peptide reporters for the direct measurement of kinase activity in an intact single cell.1,2 In order to prevent the degradation of peptide-based reporters in the cytosol, investigating the
characteristics of intracellular peptidases (i.e. the structure and mechanisms of peptidase hydrolysis) is essential.
In the eukaryotic cell, each protein has a unique rate of degradation under specific conditions, a process which is naturally designed for the turnover of normal, unmodified, or damaged proteins. These proteins are degraded to their constituent amino acids, which can then be recycled for protein synthesis within the cell. Since the degradation and synthesis of proteins are obviously energy consuming, it is not surprising that all these processes are highly regulated within the cell.1-5
23
influenced by the surrounding chemical microenvironment.6 2.1.2 Classification of Peptidases
According to the EC system classification, peptidases are members of class 3
enzymes (the hydrolases) and subclass 3.4 (the peptide hydrolases or peptidases). This large family can be divided into endopeptidases and exopeptidases according to the position at which they hydrolyze the peptide chain. Endopeptidases refer to those peptidases acting preferentially in the inner regions of peptide chains, away from the N and C terminus. According to the reactive groups at the active site in the catalysis reaction, they can be categorized into serine, cysteine, aspartic, and metallo proteinases or endopeptidases. The exopeptidases work only near the N or C terminus of polypeptide chains. Exopeptidases acting at a free N terminus and releasing a single amino acid residue are termed
aminopeptidases; dipeptide or dipeptidyl- peptidases are those releasing two amino acid residues; and tripeptide or tripeptidyl- peptidases are those releasing three amino acid
residues. Exopeptidases acting at a free C terminus and liberating a single residue are termed carboxypeptidases, and those exopeptidases only liberating dipeptides at C terminus are termed peptidyl-dipeptidases. An additional exopeptidase called omega peptidase removes post-translationally modified terminal residues such as substituted, cyclized or linked by isopeptide bonds (Figure 2.1). The carboxypeptidases and endopeptidases are divided into sub-classes according to their catalytic mechanisms. Carboxypeptidases include serine-, cysteine- and metallo- type while endopeptidases have the serine-, cysteine-, aspartic- and metallo-type (Figure 2.2).6-11
2.1.3 Cytosolic Peptidases