WELFARE PARTICIPATION AND DEPRESSION AMONG YOUTH AND YOUNG ADULTS IN THE UNITED STATES AND CHINA
Shiyou Wu
A dissertation submitted to the faculty of the University of North Carolina at Chapel Hill in partial fulfillment of the requirements for the degree of Doctor of Philosophy in the School of Social Work
Chapel Hill 2017
Approved by: Mark W. Fraser Mimi V. Chapman Gina A. Chowa Qin Gao
©2017 Shiyou Wu
ABSTRACT
SHIYOU WU: Welfare Participation and Depression Among Youth and Young Adults in the United States and China
(Under the direction of Dr. Mark W. Fraser)
Globally, depression is one of the most common mental disorders among youth and young adults, occurring at similar rates in countries with dissimilar cultures, such as the United States and China. Despite cultural differences, both the United States and China have systems of public welfare that create a social safety net and provide at least a minimal standard of living. Although many studies have documented the prevalence of mental health issues among adult welfare recipients, little empirical research has examined the prevalence of depression among youth and young adults who were raised in welfare recipient families. To address this gap in the knowledge, this dissertation uses welfare participation as a marker of low socioeconomic status with the aim of creating a nuanced understanding of the
relationship between welfare participation and youth depression in the United States and China.
The first paper presents a systematic review of 15 reports that evaluated the relationship of welfare participation with the prevalence of youth depression in the United States. Results from four descriptive studies had mixed findings, whereas the remaining comparison studies consistently showed an association between welfare participation and elevated risk of depression.
showed childhood welfare participation to be positively related to self-reported depression score in young adulthood. However, no significant relationship between childhood welfare participation and clinical diagnoses of depression was observed. Additionally, subgroup analyses (i.e., by poor, near-poor, and non-poor groups and by gender) indicated that the higher depression scores were significant only for the poor group, whereas only the near-poor group had a significantly higher probability of being diagnosed with depression. Moreover, female young adults raised in families that received welfare had significantly higher
depression scores.
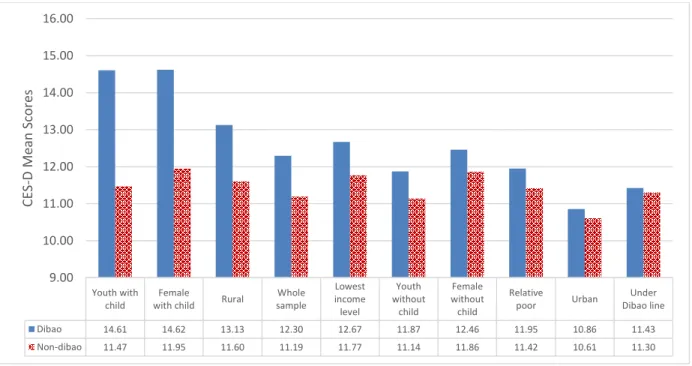
The third paper used data from a national survey conducted in China to examine the relationship between participating the Dibao welfare program and depression among Chinese youth. Results showed that Dibao-recipient youth had significantly higher depression scores compared to non-recipient youth. Moreover, subgroup analyses showed significantly higher depression scores among 4 groups of Dibao-recipient youth: those living in rural areas, those with a child, females with a child, and rural female with a child.
ACKNOWLEDGMENTS
It has been a long journey from August 16, 2012 to June 30, 2017. I spent 1,799 days (43,176 hours) working to finish my PhD study. But, I was not alone and the support, love, and guidance I received from my family, professors, and friends made my journey possible.
I am grateful to have a supportive family—my wife Qi; my parents, Taohong and Bingxiang; my four sisters, Jinhua, Yinhua, Haihua, and Qinhua; my in-laws, Lianqin and Xiaoquan; and my host parents, Nancy and Steve—who gave me continuous support and love during this long journey. When I felt tired and exhausted, my daughters, Kairui and Kaixi, gave me great comfort and inspired me to go on.
I especially want to thank my dissertation chair and mentor, Dr. Mark W. Fraser, for his immeasurable, tireless, and priceless support. Your infinite generosity and unrelenting encouragement not only enabled to me to grow as a researcher but also showed me how to be a mentor, trusted colleague, and a good person.
My journey as a PhD student at the UNC School of Social Work has been a great experience. I received tremendous support not only from my committee members, but also from other faculty at UNC. Dr. Jack Richman, former dean of the School of Social Work, thank you for your commitment to international students, your availability to meet with me throughout my time at UNC, and for your suggestions during my job search. Dean Gary Bowen, thank you for encouraging me during my first PhD course and building my confidence as I took the first steps on this exciting journey. Dr. Lisa Zerden, thank you for our friendship and the many opportunities to work with you. Dr. David Ansong, thank you, my brother, for not only being my teaching mentor and my research mentor but also my spiritual life guide. Dr. DingGeng Chen, thank you for your support and teaching me valuable advanced statistical methods during my PhD study.
Former members of the UNC faculty also made invaluable contributions to my PhD journey and to my development as a researcher. I thank Dr. Shenyang Guo and Dr. Natasha Bowen for their exceptional teaching that made advanced methods accessible and a
cornerstone of my research. Your generous sharing of your knowledge and skills made it possible for me to finish my dissertation research. I also thank Dr. Mathieu Despard, for his support, friendship, and valuable suggestions during my PhD study and job search.
I especially want to express my appreciation to Ms. Diane Wyant. Thank you for our weekly meetings, your humor, and all the magical and smart ideas. As an editor, you not only make my work better, but as a close friend, you always make my life brighter.
Last, Paper II uses data from Add Health, a program project directed by Kathleen Mullan Harris and designed by J. Richard Udry, Peter S. Bearman, and Kathleen Mullan Harris at the University of North Carolina at Chapel Hill, and funded by Grant P01-HD31921 from the Eunice Kennedy Shriver National Institute of Child Health and Human
TABLE OF CONTENTS
LIST OF TABLES ... xi
LIST OF FIGURES ... xii
LIST OF ABBREVIATIONS ... xiii
INTRODUCTION ...1
References: Introduction ...5
PAPER I: WELFARE PARTICIPATION AND DEPRESSION AMONG YOUTH IN THE: UNITED STATES: A SYNTHESIS OF THE EVIDENCE ...7
Introduction ...9
Methods...15
Results ...18
Discussion ...38
References: Paper I ...46
PAPER II: EXPLORING THE RELATIONSHIP BETWEEN WELFARE PARTICIPATION IN CHILDHOOD AND DEPRESSION IN ADULTHOOD IN THE UNITED STATES …….………...………...………….. 51
Introduction ...53
Methods...64
Results ...70
Discussion ...76
PAPER III: EXPLORING THE RELATIONSHIP BETWEEN WELFARE
PARTICIPATION AND DEPRESSION AMONG YOUTH IN CHINA…... 88
Introduction ...90
Methods...102
Results ...110
Discussion ...116
References: Paper III...123
SUMMARY ...128
References: Summary ...134
LIST OF TABLES
Table 1.1 – Summary of Findings from 15 Studies Included in Systematic Review ...21 Table 1.2 – Summary of Depression Measures and Prevalence from 15 Studies ...32 Table 2.1 – Missingness of Variables ...65 Table 2.2 – Weighted Descriptive Statistics for Independent Variables, Add Health,
Wave 1 (1994-1995) ...73 Table 2.3 – Regression Results Using Different Datasets ...74 Table 2.4 – Regression Results Based on Imputed Data with Propensity Score Greedy
Matching ...75 Table 2.5 – Regression Results Based on Imputed Data with Propensity Score Radius
Matching ...76 Table 3.1 – Variable Descriptions of Whole Sample ...106 Table 3.2 – Regression Results of Depression (CES-D) on Whole Sample Using Different
LIST OF FIGURES
Figure 1.1 – PRISMA Flow Diagram of Screening and Selection ...17 Figure 2.1 – U.S. National Poverty and Child Poverty Rates ...57 Figure 2.2 – Prevalence of Major Depressive Episodes and All Other Forms of Mental
Illness by Age Group. ...59 Figure 3.1 – Total Dibao Recipients (by million) ...94 Figure 3.2 – Group Comparison of Average Depression Score Between Dibao and
Non-Dibao Recipients. ...111 Figure 3.3 – Estimation of Dibao Take-up Rate and Mis-targeting Rate by Poverty
LIST OF ABBREVIATIONS
Add Health National Longitudinal Study of Adolescent to Adult Health AFDC Aid for Families and Dependent Children
BSI Brief Symptom Inventory
CBHSQ Center for Behavioral Health Statistics and Quality CDI Children's Depression Inventory
CES-D Center for Epidemiologic Studies Depression scale CFPS China Family Panel Studies
CHIP Children’s Health Insurance Program CMS Centers for Medicare & Medicaid Services
DAWBA Development and Well-Being Assessment Inventory DHHS Department of Health and Human Services
DIS Diagnostic Interview Schedule
DSM Diagnostic and Statistical Manual of Mental Disorders HSCD Hopkins Symptom Checklist Depression
ICD International Classification of Diseases MAR Missing at Random
MDE Major Depressive Episode MHS Military Health System
NLSY National Longitudinal Survey of Youth NSDUH National Survey on Drug Use and Health OLS Ordinary Least Squares
PRISMA Preferred Reporting Items for Systematic Reviews and Meta-Analyses PSM Propensity Score Matching
SES Socioeconomic Status
SLE Systemic Lupus Erythematosus
SNAP Supplemental Nutrition Assistance Program SSI Supplemental Security Income program TANF Temporary Assistance for Needy Families VA Department of Veterans Affairs
INTRODUCTION
WELFARE PARTICIPATION AND DEPRESSION
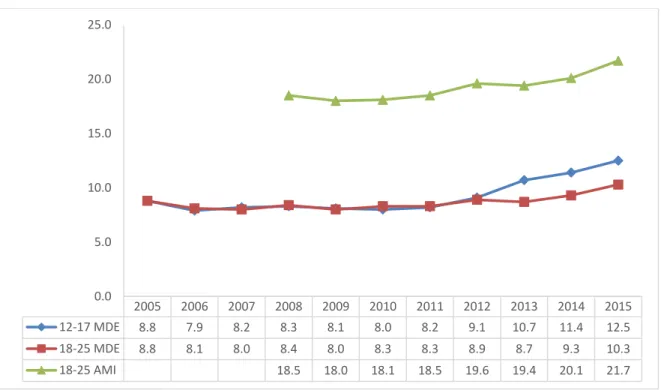
AMONG YOUTH AND YOUNG ADULTS IN THE UNITED STATES AND CHINA Internationally, about 6% of adolescents are affected by depression (Dolle & Schulte-Körne, 2014). Increasingly, depression among the younger population of children, youth, and young adults is becoming a serious public health issue and social problem in many countries. For example, in the United States, nearly 3.6 million youths and young adults (ages 18 to 25 years; about 10.3% of this age sector population), had a major depressive episode within the past year that met the criteria of the Diagnostic and Statistical Manual of Mental Disorders (4th edition; American Psychiatric Association, 1994; Center for Behavioral Health Statistics and Quality, 2016). Similar rates of depression have been reported in China, where the prevalence of depression among children and youth was estimated at 15.4% of the youth population (Li, Chen, Zhao, & Xu, 2016). Depression is a leading cause of youth suicide in China, with suicide ranking as the top reason for premature mortality by injury (Zhang et al., 2010).
Although a large body of research has examined various risks and causes of depression, only recently have researchers begun to examine the links between welfare participation and youth depression. Social science researchers routinely use welfare
participating in public welfare programs, a growing number of studies suggest that welfare participation is related to a variety of negative mental health outcomes (e.g., Auerbach & Beckerman, 2011; Cheng, 2007; Gao, 2017; Gibson et al., 2009; Lehrer, Crittenden & Norr, 2002). For example, about 1 in 4 low-income persons who qualify for Medicaid also suffer from a mental health or behavioral health disorder (Centers for Medicare & Medicaid Services, 2017). Pavetti and colleagues (2010) examined data from the 2003 Medicaid eXtract files of female Medicaid recipients (19 to 64 years) and found these welfare
recipients had an extremely high rate of depression. Specifically, 32% of Medicaid recipients who also qualified for the Supplemental Security Income program (SSI; N = 65,303) and 30% of these who also received income support through the Temporary Assistance for Needy Families (TANF; N = 22,691) reported a mental disorder such as major depression, affective psychoses, or other depressive disorders (e.g., bipolar disorder, psychotic depression, or seasonal affective disorder).
Similarly, research conducted in China with recipients of Dibao showed that welfare recipients reported lower subjective well-being and were more likely than non-recipients to be unhappy about their life situation (Gao, 2017). In addition, Chinese children from Dibao welfare recipient families generally had a higher psychological burden (e.g., feeling pressure or stressed; Han, 2012; Li & Walker, 2016).
However, the literature has primarily focused on the overall population of welfare recipients, and little research has examined the relationship between welfare participation and depression among the younger population. Therefore, to fill this research gap, this
Organization of the Dissertation
This dissertation uses a three-paper format to examine the relationships between welfare participation and depression. The first paper “Welfare Participation and Depression Among Youth in the United States: A Synthesis of the Evidence,” is a systematic review of peer-reviewed journal articles and gray literature published between January 1, 1997 and March 1, 2017. The literature search identified 15 reports (four descriptive studies, 11
comparison studies) relevant to welfare participation and the prevalence of youth depression. The four descriptive studies reported mixed findings regarding the prevalence of depression among youth. However, the remaining comparison studies showed consistent findings that participation in welfare programs was associated with a higher vulnerability for depression.
The second paper, “Exploring the Relationship Between Welfare Participation in Childhood and Depression in Adulthood in the United States” examines the relationship between welfare and young adult depression in the context of the United States. This study used Wave I and Wave IV Add Health data to examine the relationship between participating in welfare programs during childhood (before age 18 years) and experiencing depression during young adulthood (24 to 34 years). The study used propensity score matching to reduce the potential of selection bias. Results showed childhood welfare participation was related to significantly higher depression scores as self-reported by young adults; however, no
statistically significant relationship was found between childhood welfare participation and clinical diagnoses of depression. In addition, results of the subgroup analyses showed that only the lowest income group (i.e., the study’s poor group) had significantly higher
significantly higher depression found for the female subgroup of young adults from welfare participant families.
The third paper, “Exploring the Relationship Between Welfare Participation and Depression Among Youth in China,” examines the welfare-depression relationships in the context of the Chinese Dibao welfare system. This study used survey data from the 2012 China Family Panel Studies to examine the relationship between Dibao participation and occurrence of depression among youth (16 to 24 years) in China. This study used a propensity score matched sample to test the robustness of the main analytic results.
Additionally, nine subgroup analyses were conducted to provide nuanced understanding of the relationship between welfare receipt and youth depression. Results showed that youth from Dibao-recipient families had significantly higher depression scores than their non-recipient counterparts. Results from the subgroup analyses showed that rural Dibao youth, Dibao youth with a child, female Dibao youth with a child, and rural female Dibao youth with a child had significantly higher depression scores.
The combination of the three papers presented in this dissertation make an important contribution to understanding the correlates of participating in welfare programs. Using welfare as a poverty marker can help researchers identify vulnerable, at-risk populations, especially those with elevated risk factors associated with depression. In addition, the studies presented fill important gaps in the depression literature regarding the relationship between welfare participation in childhood and depression in later adolescent and young adult stages. This dissertation also discusses the potential implications of the welfare-depression
REFERENCES: INTRODUCTION
American Psychiatric Association. (1994). Diagnostic and statistical manual of mental disorders (4th ed.). Washington, DC: Author.
Auerbach, C., & Beckerman, N. L. (2011). What social workers in health care should know about lupus: A structural equation model. Health & Social Work, 36, 269–278. doi:10.1093/hsw/36.4.269
Center for Behavioral Health Statistics and Quality. (2016). Key substance use and mental health indicators in the United States: Results from the 2015 National Survey on Drug Use and Health (HHS Publication No. SMA 16-4984, NSDUH Series H-51). Retrieved from http://www.west-info.eu/files/NSDUH-FFR1-2015.pdf
Centers for Medicare & Medicaid Services. (2017). Medicaid & CHIP: Strengthening coverage, improving health. Retrieved from
https://www.medicaid.gov/medicaid/program-information/downloads/ accomplishments-report.pdf
Cheng, T. C. (2007). Impact of work requirements on the psychological well-being of TANF recipients. Health & Social Work, 32, 41–48. doi:10.1093/hsw/32.1.41
Dolle, K., & Schulte-Koerne, G. (2013). Complementary treatment methods for depression in children and adolescents. Praxis der Kinderpsychologie und Kinderpsychiatrie, 63, 237–263.doi:10.13109/prkk.2014.63.3.237
Gao, Q. (2017). Welfare, work, and poverty: Social assistance in China. New York, NY: Oxford University Press.
Gibson, T. B., Lee, T., Vogeli, C. S., Carls, G. S., Sredl, K., Desharnais, S., . . .Shields, A. E. (2009). A four-system comparison of patients with chronic illness: The Military Health System, Veterans Health Administration, Medicaid, and commercial plans. Military Medicine, 174, 936–943. doi:10.7205/MILMED-D-03-7808
Han, K. (Ed.). (2012). Interviews with Minimum Livelihood Guarantee recipients in urban China. Jinan, China: Shandong Renmin Press. [In Chinese].
Lehrer, E., Crittenden, K., & Norr, K. F. (2002). Depression and economic self-sufficiency among inner-city minority mothers. Social Science Research, 31, 285–309.
doi:10.1016/S0049-089X(02)00002-9
Li, J., Chen, X., Zhao, C., & Xu, Y. (2016). Prevalence of depression in Chinese children and adolescents: A meta-analysis. Chinese Journal of Child Health Care, 24, 295-298. [In Chinese].
Pavetti, L., Derr, M. K., Kauff, J. F., & Barrett, A. (2010). Mental disorders and service use among welfare and disability program participants in fee-for-service Medicaid. Psychiatric Services, 61, 495–499. doi:10.1176/ps.2010.61.5.495
PAPER I
WELFARE PARTICIPATION AND DEPRESSION AMONG YOUTH
IN THE UNITED STATES: A SYNTHESIS OF THE EVIDENCE
Welfare Participation and Depression Among Youth in the United States: A Synthesis of the Evidence
Introduction
In most Westernized developed countries, social welfare resources and benefits are primarily controlled by the government, whereas the U.S. social safety network of welfare programs includes federal and private resources (e.g., private agencies as well as social welfare programs managed by government-supported private sector entities; Garfinkel, Rainwater, & Smeeding, 2010; Hacker, 2002). Social welfare programs reflect a nation’s attitudes and sense of responsibility to care for its citizens. Moreover, welfare programs, and particularly health-related welfare programs (e.g., the U.S. Medicaid program), play important roles in the lives of
vulnerable, low-income population. Health care programs are designed to allow the
economically disadvantaged and other vulnerable populations to have access to basic health care. Health care systems take many forms around the world. Many developed countries (e.g., the United Kingdom, Canada, Australia, and most of the North European countries) have
implemented systems of universal access that enable all citizens to access basic medical care. In contrast, U.S. health care is based on a fee-for-services model with payment through a third-party (insurance) or out-of-pocket payment by patients without insurance. Federal health care spending is targeted to low-income persons and older adults. Historically, middle- and working-class Americans relied on health care insurance that was available through their employers (Garfinkel et al., 2010), but the escalating cost of insurance has led many employers to eliminate this benefit. The costs of health care through employer-provided health insurance are
other highly developed nations” (Boston University, n.d.). The U.S. system of health care has led to high rates of uninsured or underinsured people who have to forego or delay needed medical care because they are unable to afford the cost (Baribault & Cloyd, 1999). Since 2010, the Patient Protection and Affordable Care Act was released to increase health insurance coverage and reduce the costs of medical care, yet still about 8.9% U.S. people (24.3 million) have barriers to access health care (U.S. Department of Health and Human Services, 2016). To ensure all people have access to health care while controlling for reasonable, realistic costs is a complex and difficult issue. Each health care system has advantages and disadvantages. Since the inception of the first social welfare programs in America, the debate among researchers and politicians has not stopped regarding the poverty alleviation functions of social welfare programs.
On the one hand, statistical data from Western countries has shown welfare programs such as old-age pensions and unemployment compensation have been effective in helping some of the most vulnerable to maintain a basic standard of living whether they are too old to continue in the workforce or facing temporary unemployment status (Piven & Cloward, 1993). In the United States, health care-related welfare programs such as Medicaid and the Children’s Health Insurance Program (CHIP) provide health insurance to more than 70 million economically disadvantaged or disabled Americans (Centers for Medicare & Medicaid Services [CMS], 2017). A centerpiece of the 2010 Patient Protection and Affordable Care Act (2010) was the expansion of health coverage through Medicaid and CHIP. Although only 31 of 50 states chose to expand Medicaid, this expansion reduced the percentage of uninsured Americans from 16% in 2010 to 8.9% in 2016 (CMS, 2017). However, the Affordable Care Act is in jeopardy, and if the
through the Medicaid expansion will lose their access to health care.
In addition to health care coverage, welfare programs in different countries provide various types of basic living assistance to recipients ranging from cash to job skills training. For example, cash welfare payments are provided by the Chinese Dibao program, which is also called the Minimum Living Standard Program, whereas some U.S. welfare programs provide food and nutrition service (e.g., the U.S. Supplemental Nutrition Assistance Program [SNAP; formerly Food Stamps]), public housing, and job-skills training (e.g., Work First programs). Despite the varied types of welfare programs, many researchers have pointed out the failure of welfare programs to bring sustainable solutions to reducing poverty (DiNitto & Johnson, 2016). For example, in the United States, researchers found that although the U.S. government spent in excess of $1 trillion annually to fund more than 100 welfare programs to fight poverty, the current U.S. poverty rate is one of the highest among developed countries (Organisation for Economic Co-operation and Development, 2017). Indeed, since the 1996 welfare reform efforts, the U.S. poverty rate has not fallen below 11% (Tanner, 2012). In
Mental Health Sequelae of Welfare Participation
Many studies have documented the prevalence of mental health issues (e.g., depression) among welfare recipients, and have examined the relationship between welfare participation and mental health outcomes. This body of research has primarily focused on health care related welfare programs such as the U.S. Medicaid. Notably, about 1 in 4 low-income persons who qualify for Medicaid also suffers from a mental health or behavioral health disorder (CMS, 2017). Overall, Medicaid recipients have significantly higher rates of both schizophrenia and depression than the general population (Berg et al., 2014). Medicaid plays an important role in providing access to mental health services for those who would otherwise be unable to afford treatment. Medicaid is the single largest payer for U.S. mental health treatments, and the Medicaid program is playing an increasing role in providing access to substance-use treatment (CMS, 2017). In addition, Medicaid plays a critical role in maternal and child health by covering half of all U.S. births and helping low-income women access mental health services to help with perinatal maternal depression (CMS, 2017; DiNitto & Johnson, 2016).
disorder such as major depression, affective psychoses, or other depressive disorders (e.g., bipolar disorder, psychotic depression, or seasonal affective disorder).
The prevalence of depression among various groups, including Medicaid recipients, was also the focus of a comparison study (Gibson et al., 2009) conducted with participants (5 to 54 years) with health care insurance from four major U.S. systems: the military health system (MHS; n = 2,963,987), the Department of Veterans Affairs (VA; n = 2,114,739), Medicaid recipients (n = 5,554,974), and employer-sponsored commercial plans (n = 5,212,833). This study found significantly higher rates of severe mental disorders among the Medicaid recipients (10.7%) and VA (10.7%) group as compared with the MHS (2.6%) and commercial plans (2.4%) groups. Gibson et al. (2009) also compared the major depression rates among these four groups and found that VA group had the highest prevalence (10.7%), followed by Medicaid (7.7%), MHS (5.5%), and employer-sponsored commercial plans (4.1%) groups. Auerbach and
Beckerman (2011) conducted a similar group comparison, using cross-sectional data collected from patients with systemic lupus erythematosus (SLE, age range from early 20s to more than 60 years, n = 378), and found that patients’ type of insurance (i.e., Medicaid, Medicare, private insurance, and no insurance) was significantly associated with depression and anxiety.
Specifically, uninsured SLE patients had the highest levels of depression and anxiety, followed by the patients with Medicaid, then patients with private insurance, and last, patients with Medicare coverage.
them eligible to receive Medicaid. What is less clear in the research is the relation of participation in other welfare programs such as TANF with the mental health of recipients.
Cheng’s (2007) study shed light on the relationship between participating in TANF and psychological well-being among parents (M age = 36; n = 19,011). His study found that
compared with parents never enrolled in TANF (n = 17,207), parents who were current or former TANF recipients (n = 1,804) had higher levels of psychological distress. This finding is
consistent with that of Dooley and Prause’s (2002) study, which investigated differences in rates of depression between women participating in the Aid for Families and Dependent Children1 (AFDC; n = 347) and those not participating in AFDC (n = 3,331) . Dooley and Prause found participating in the AFDC welfare program (income assistance) was associated with higher scores on a standardized measure of depression (i.e., Center for Epidemiologic Studies Depression scale [CES-D], Radloff, 1977).
Studies have also shown demographic differences regarding prevalence of mental disorders among welfare recipients. For example, females, especially those of childbearing age or pregnant, comprise a high-risk population for depression (Danziger et al., 2001; Orr et al., 2007). In addition, White welfare recipients reported higher levels of depression than African American recipients (dosReis et al., 2001; Richardson et al., 2003). Moreover, people with low SES were found to have higher risk of mental illness than those with higher SES (Gilman et al., 2002; Hudson, 2005).
Given the rich body of empirical studies in this research area, summarizing the available
evidence on the mental health outcomes among welfare recipients can be helpful to generating a better understanding of the relationship of welfare participation with recipients’ mental health outcomes. Therefore, this author undertook a systematic review to identify and synthesize the findings regarding the relationships between welfare participation and mental health outcomes and prevalence of mental health disorders. Further, to increase the specificity of this review, the author chose to narrow the focus to the population of youth welfare recipients and mental health outcomes of depression or depressive symptoms.
Methods
This systematic review followed the PRISMA (Preferred Reporting Items for Systematic Reviews and Meta-Analyses) guidelines. Before conducting the data search, a systematic review protocol for the current study was developed and published with PROSPERO International (CRD42017056645), which is a prospective register of systematic reviews hosted at the Centre for Reviews and Dissemination at the University of York in the United Kingdom.
Search Terms and Databases
Based on consultation with a health sciences reference librarian, the following search terms were used to identify studies: (“welfare*” OR “welfare participation” OR “welfare use” OR “welfare recipients” OR “receive welfare benefits” OR “AFDC” OR “TANF” OR “Food Stamp” OR "Aid to Families with Dependent Children" or "Temporary Assistance for Needy Families" OR "Medicaid" OR "Supplemental Security Income food and nutrition programs") NOT (“Child welfare”)) AND (“depressi*”)).
identified for this search: ASSIA (Applied Social Sciences Index and Abstracts), PsycINFO, Social Work Abstracts, Social Services Abstracts, Sociological Abstracts, SSCI (Social Sciences Citation Index), CINAHL (Cumulative Index to Nursing and Allied Health Literature), Global Health, and PubMed. In addition, a search of the gray literature and unpublished reports was conducted via Google that used “welfare participation depression youth” as the search term. Criteria for Considering Studies for this Review
To identify studies addressing the associations between welfare participation and depression outcomes among youth, a priori eligibility inclusion and exclusion criteria were developed to guide the screening process. These criteria were related to the type of study, type of participants, and type of welfare program; each of these criteria is discussed below. Search results were first screened by title and abstract, and studies that clearly did not meet any of the following eligibility criteria were removed.
Types of studies. All empirical studies describing the effects or correlations of welfare participation on youth depression or depressive symptoms outcomes, or examining the
relationships between welfare participation and depression among youth were included in this review. This systematic review included studies in English published between January 1, 1997 (i.e., after the 1996 welfare reform) and March 1, 2017.
such as TANF, SNAP, and Medicaid.
Data Extraction and Management
As shown in Figure 1.1, the searches of the nine databases yielded 2,603 studies; after removing duplicate studies, 1,796 articles were retained for a title and abstract review via RefWorks (a Web-based software package for reference management). In addition, the Google search yielded two reports from the gray literature. After the initial review, 1,638 records were excluded using the inclusion and exclusion criteria, and 160 articles were retained for a full-text review. Based on the full-text review, 15 research reports were included in the final systematic review.
Study characteristics were extracted from each identified report and data were managed using Microsoft Excel 2013. The following characteristics were collected: research purpose; setting; name of welfare program; measure used to assess depression; depression prevalence; sample description; sample size; participants’ age, race/ethnicity, and gender; research dataset; number of data collection waves; analytical strategies; and findings about welfare effects on depression or correlation between welfare participation and depression outcomes.
Results
Characteristics of Studies
both rural and urban settings (Cook et al., 2004). Welfare Programs
Of the 17 reviewed reports, four studies reported multiple welfare programs (e.g., Medicaid, SSI, AFDC, or WIC; Bachman et al., 2015; Buckner, Bassuk, Weinreb, & Brooks, 1999; Cook et al., 2004; dosReis et al., 2001). Three studies focused on a general concept of welfare programs (Go, 1998; Knab, Garfinkel, & McLanahan, 2006; Rhee et al., 2005). Two studies examined the relationship of participating in a medical coverage welfare program (e.g., Medicaid) on depression among youth participants (Olfson et al., 2011; Richardson et al., 2003). Similarly, Bachman et al. (2015) studied the association between Medicaid participation and youth depression, but for a specific Medicaid program—the Family Opportunity Act Medicaid Buy-In Program (FOA)—tailored for Louisiana. Notably, only one study examined the
relationship between participating in a public housing program and the mental health of youth (Nebbitt et al., 2014).
Five studies documented a relationship between the either the AFDC or TANF income assistance welfare programs and youth depression. Of these five studies, three studies focused on the AFDC program, which was in operation from 1935 to 1996 when superseded by TANF (Dooley & Prause, 2002; Kalil et al., 2001; Pande, 2014). One study focused on the relationship between TANF and youth depression (Sullivan & DeCoster, 2001), and one study was conducted during the period of welfare reform, and thus, documented the relationship of both the AFDC and TANF programs to youth mental health (Gavin et al., 2011).
Characteristics of Participants
Gavin et al., 2011; [n = 173]; Sullivan & DeCoster, 2001; [n = 127]). As mentioned, this review focused on the mental health outcomes of youth 16 to 24 years old. However, the reviewed studies were inconsistent in the age range used to define youth. As shown in Table 1.1, of these 15 studies, youth was broadly defined as spanning ages 12 to 19 years.
Gender distribution in study samples. Most samples examined in the reviewed studies were composed primarily of female participants. Seven of the 15 studies were gender specific and used female-only samples (e.g., Cook et al., 2004; Dooley & Prause, 2002; Gavin et al., 2011; Kalil et al., 2001; Knab et al., 2006; Pande, 2014; Sullivan & DeCoster, 2001). In the remaining 8 studies, females composed at least half of the study sample.
Table 1.1
Summary of Findings From 15 Studies Included in Systematic Reviewa
Source Study Purpose
- Settings
- Welfare
Program Sample
- Sample Size;
- Gender (% F)
- Race (Total)
- Age
- Data - Waves
Analytic
strategies Findings b
(a) Descriptive Studies (n = 4) 1.
Cook, et al., 2004
To estimate the prevalence of posttraumatic stress disorder and its treatment in economically disadvantaged pregnant women.
- In 5 counties in rural Missouri and the city of St. Louis - Multiple (Pregnant Medicaid-eligible women at WIC [Women, Infants, and Children], SNAP[Supple mental Nutrition Assistance Program], and Medicaid) WIC, SNAP enrollment at any point in their pregnancy, included being pregnant, having (or being eligible for) Medicaid coverage of health services, and being able to speak English. Age ≥13.
- 744; - 100%;
- 57.5% B; 42.5% W;
- M:22; median: 21
- Survey interviews - Cross-sectional; (2/2000-8/2001) Descriptive statistics; T-test; and χ2 regression models
11% met major depression criteria; - Most prevalent comorbid diagnoses was major depressive episode (24 of 57, 42.2%). - Pregnant women with PTSD had 5 times the odds of having a major depressive episode than women without PTSD.
2. dos Reis et al., 2001
To determine extent of mental health service use of Medicaid child sample and if service use or psychotropic medication
treatments differ
- Populous suburban county of a mid-Atlantic state during 1996
- Multiple
The population of continuous and non-continuous Medicaid enrollees younger than 20 years
- 15,507 (301 Foster care; 775 SSI; 14,422 Other Aid);
- Foster care (50%) SSI (64%) Other Aid (65%); - Foster care
- Population- based,12-month service claims and related medication files
Descriptive - Prevalence of depression was 15% in foster care group; 7% in SSI group; and 0.7% in Other Aid grp. - Of Medicaid youth, Whites were 1.9 times more likely to be
2
Source Study Purpose
- Settings
- Welfare
Program Sample
- Sample Size;
- Gender (% F)
- Race (Total)
- Age
- Data - Waves
Analytic
strategies Findings b
children’s Medicaid category of assistance? (Supplementa l Security Income); Other aid [e.g., AFDC (Aid for Families and Dependent Children), WIC]) 19%O); SSI (48%W; 18%B; 34%O) - Other Aid
(22%W; 43%B; 35%O) - 0-19 (15-19:
Foster care 27%; SSI 21%; Other Aid 8%)
- 1-year cross-sectional (1996)
depression than Blacks; but among SSI group, Blacks were 1.7 times more likely to be diagnosed with
depression than Whites.
3. Nebbitt et al., 2014
How do African American youths rate their (a) self-efficacy and (b) depressive symptoms?
- New York City; Washington, DC; St. Louis; Philadelphia - Public housing All African American adolescents residing in public housing
developments in the target cities.
- 782; - 48%; - 100% Black - M: 15.5 (11-20)
- Admin. data from local housing authorities in each city
- One wave: (2006-2008) Descriptive statistics and mean compariso ns
- Overall, the mean depression score of Black adolescents residing in public housing was 17.4 (cutoff depression scores: >=16). - Male (M=18.5) youth reported significantly higher (p <.05) depressive scores than females (M=16.6).
4. Richard-son et al., 2003
To determine the prevalence of depression in a statewide Medicaid youth population, and; To explore whether racial or ethnic disparities exist with respect to diagnosis and
- Washington State
- Medicaid
Youth <19 in families with incomes <200% FPL and were
continuously enrolled in Medicaid from 1997 to Dec 1998.
- 192,441; - 49%;
- 60% W;7% B; 15% H; 33% Others - 5-10: 56%;
11-14: 29%; - 15-18: 15%.
- Medicaid claims data - Cross-sectional (7/1997-12/1998) Descriptive statistics; χ2;
regression models
- 2% Medicaid youth had a depression claim at some time during the study period.
- Depression prevalence increased with age group, 15-18 years group had the highest depression rates, followed by 10-14 years group, and 5-10
2
Source Study Purpose
- Settings
- Welfare
Program Sample
- Sample Size;
- Gender (% F)
- Race (Total)
- Age
- Data - Waves
Analytic
strategies Findings b
depression. - Among the youngest
group (5-10 years), males had 2 times higher depression diagnoses rates than females. This rate was reversed in the oldest group (15-18 year), with females having 2 times higher rate of depression diagnoses than males.
- Compared with White youth, youth from ethnic minority groups (except Native Americans) had lower risk of depression. (b) Comparison Studies (n = 11)
5. Bachma n et al., 2015
To provide information about the characteristics of program enrollees, and the impact of the Family Opportunity Act (FOA), a Medicaid Buy-In program on families of the National Survey of Children with Special Health Care Needs (CSHCN). - Louisiana - Multiple (The FOA Medicaid Buy-In Program; SSI) Parents/legal guardians raising a child with a disability enrolled in the Louisiana FOA Medicaid Buy-In Program; and in SSI group; and CSHCN families with income between 200% and 300% FPL group.
- 52; - 43% - DNR - 0-19 years
- 0-5: 28%; - 6-11: 38%; - 12-19: 34%
- A 9 sections 30-45 min survey of Louisiana Medicaid Buy-In Program based on NS-CSHCN survey questions - One wave (around 2012)
Bivariate analyses; Pearson χ2
- The FOA group is less likely than the SSI group to have difficulty with anxiety or depression; - No statistically
significant differences of depression between FOA group and the 200-300% FPL group.
Source Study Purpose
- Settings
- Welfare
Program Sample
- Sample Size;
- Gender (% F)
- Race (Total)
- Age
- Data - Waves
Analytic
strategies Findings b
6. Buckner et al., 1999
To examine the association between housing status (homeless vs. shelter housed) and
measures of child behavior and self-reported symptoms of depression and anxiety. - Massachusett s - Multiple (AFDC; emergency shelters and transitional housing facilities)
Children age 6 and older who were members of low-income, single-parent, female headed families.
- 228 (80 homeless; 148 newer homeless) - Homeless: 49%;
housed poor: 52%
- Homeless: 26% W; 21% B; 45% H; 8% Others. Housed poor: 36% W; 16% B; 41% H; 7% others.
- Mean(M): 10 for homeless child; 11 for housed poor child (6-18 years). - Data collected from the initial interview - Cross-sectional
T-test; χ2;
hierarchica l
regression analyses
- Homeless children reported higher levels of depressive symptoms than housed children, but these differences were not statistically
significant. For example, 14% homeless whereas 9% housed poor children reported raw CDI scores ≥ 19; The mean raw CDI score was 11 for
homeless whereas was 9 of housed children. - Housing status was not associated with self-reported depression. 7. Dooley & Prause, 2002
1. To replicate the previously reported cross-sectional association between welfare status and well-being (depression); 2. To examine 2 selections and 2 social causation hypotheses of causal direction of welfare association with - U.S. Nationally representativ e - AFDC Female
respondents to the 1992–94 surveys with
data describing depression, alcohol use, and receipt of AFDC
- 3,678; - 100%;
- 19.1% H; 28.3% B; 52.6% Others; - 14-22 - National Longitudinal Survey of Youth (NLSY79) - Wave1: 1992; Wave 2:1994 Bivariate and multivariat e analysis; Regression s
- AFDC recipients reported significantly higher mean levels of depression when compared to the employed and out of the labor force groups; - Entering welfare was associated with increased depression.
Source Study Purpose
- Settings
- Welfare
Program Sample
- Sample Size;
- Gender (% F)
- Race (Total)
- Age
- Data - Waves
Analytic
strategies Findings b
8. Gavin et al., 2011
To examine the prevalence and correlates of elevated depressive symptoms in a 17-year cohort study of 173 women who were unmarried, pregnant adolescents between June 1988 and January 1990.
- Public and private hospital-based prenatal care clinics, public school alternative programs, and social service agencies in three urban counties in Washington State - AFDC/TANF Participants 17 years and younger, married, and planned to carry their pregnancies to term.
- 173; - 100%; - 53% W;28% B;
10% Native; 8% H; 3% Asian; 10% Others;
- Period 1: 14.2-19; Period 2: 17.7-23; Period 3: 19-24; Period 4: 24.3-29; Period 5: 29.6-34.5. - 17-year longitudinal study of adolescent mothers
- 17 waves (analyses based on each period rather than across the 5 periods)
Descriptive statistics; χ2; (un)adjust ed logistic regression analyses
- Receiving public assistance was positively and significantly
associated with elevated depressive symptoms. 9. Go, 1998 To document depressive symptoms in Southeast Asian adolescents and examine possible relation of factors of immigration, acculturation level, family conflict, and peer relations
- 2 middle schools in Sacramento, California - General welfare programs Southeast Asian immigrant adolescents living in CA. - 206; - 62%;
- Hmong: 39.8%; Chinese: 34%; Mien:16.5%; Vietnamese: 5.3%; Lao/Cambodian: 4.4% - 12-16 - Structured group interviews survey data
- One wave
T-test; correlation ; regression and path modeling
- Receiving welfare was significantly correlated with adolescents’ higher depression symptom scores
10. Kalil et al., 2001
To (a) determine the prevalence of depressive symptoms among a sample of
- Maryland
- AFDC
A stratified random sample of 580 mothers who entered the
- 580; - 100%; - 41% W;54% B;
5% Others; - Face-to-face interview survey Descriptive and multivariat e analyses
- Overall, mean CES-D score of 17.88. About 52% of the AFDC young mothers are at risk for
Source Study Purpose
- Settings
- Welfare
Program Sample
- Sample Size;
- Gender (% F)
- Race (Total)
- Age
- Data - Waves
Analytic
strategies Findings b
recipients at the time of their initial entrance onto the welfare rolls and (b) identify risk and protective factors related to depressive symptoms among the women.
rolls for the first time as payees during a 5-month period in 1987.
18 years) sectional
(1987)
indicating high
prevalence of depressive symptoms in this random sample of first-time welfare recipients relative to the general population.
11. Knab et al., 2006
To examine the effect of welfare and child support policies on maternal health outcomes
- 20 large U.S. cities - Post-reform welfare and child support policies (general welfare programs ) Married and unmarried mothers were interviewed around the time of a child’s birth, with follow-up
interviews occurring around the child’s first and third birthdays. - 2,536; - 100%; - DNR; - 18-34 -Fragile Families and Child Wellbeing Study -Baselne:1998 Endline:2000 ANOVA; Regression s; Instrument al variable
- Mothers who received welfare in the last year report worse overall health, higher rates of depression and anxiety, and greater levels of food insecurity.
12. Olfson et al., 2011
To examine the prevalence and demographic and clinical
characteristics of children
diagnosed with tic disorders in large privately and publicly insured populations. - California, Florida, New York, Texas, Illinois, Georgia, and Ohio - Medicaid Children diagnosed with Tourette disorder, chronic motor or vocal tic disorder, and other tic disorders in public and private insurance plans over the course of a 1-year period.
- Total: 26,369,655 (Publicly insured: 10247827 Privately insured: 16121828); - Publicly insured:
49%; privately insured: 49%) - Publicly insured:
35% W; 29% B; 29% H; 8% Others. Privately
- Service and pharmacy claims were examined from the Market Scan Research Databases (2000-2007) and a seven-state CROSSTAB procedure in SUDAAN 9.0; regression models; Separate χ2; Tukey
multiple compariso ns
- Compared with privately insured youth, children under Medicaid diagnosed with Tourette disorder had higher rates of depression (14.6% versus 9.8%)
Source Study Purpose
- Settings
- Welfare
Program Sample
- Sample Size;
- Gender (% F)
- Race (Total)
- Age
- Data - Waves
Analytic
strategies Findings b
- 4-18:Publicly insured (57% between 12-18); Privately insured (66% between 12-18) Analytic Extract File (2001-2004) - 2000-2007 combined data 13. Pande, 2014
To examine the spillover effect of welfare program on the family,
particularly children of the participating mothers.
- 16 locations in 10 states across U.S.
- AFDC
16 to 22 years old mothers’ who had first given birth at 19 or younger, were not pregnant when they entered the program, had dropped out of high school and were receiving cash welfare assistance.
- 5,309 (1735 for BBCS; 1785 for BPI; 1789 for PBI); - 100%; - 25% H and
others; 55% B - M: 19 (16-22)
- New Chance project - Baseline:19 89; 18-month follow- up;42-month follow-up;
T-test; χ2;
Intent to treat; Treatment on the treated; Regression ; pathway analysis
- BPI anxious-ness/ depress-sion significant negatively affected by mothers’ welfare partici-pation;
- Mothers in welfare program were more likely to be depressed.
- Treatment group mothers had higher (but not statistically
significant) depression scores than control group mothers’ at both 18- and 42-month follow-up. 14.
Rhee et al., 2005
Reveal patterns of physical symptoms using a clustering approach and to examine relationships between the identified patterns and psychosocial factors.
- U.S. sample, nationally representativ e - General welfare programs Adolescents from the core sample who participated in both Waves I and II.
- 9,140; - 52%;
- 64% W; 19% B; 12% H; 5% Others; - M: 15.6
- Add Health
- Wave 1 (94-95);
- Wave 2 (1996)
Cluster analyses; χ2, ANOVA,
regression models
- Youth whose parents received welfare had 3 times greater rate of being in extreme symptom group; Over 30% of welfare
adolescents were either HS or ES.
- Adolescents from families receiving welfare
Source Study Purpose
- Settings
- Welfare
Program Sample
- Sample Size;
- Gender (% F)
- Race (Total)
- Age
- Data - Waves
Analytic
strategies Findings b
The odds of being in the unstable subgroup increased substantially with an increase in depressive symptoms. 15. Sullivan & DeCoste r, 2001
To analyze the effects of employment and TANF aid on well- being over time.
- Georgia
- TANF
A stratified random sampling Georgia TANF recipients, single, Black female reporting as head-of-household, with a high-school education (GED/ diploma), and two children.
- 127; - 100%; - 100% Black - M: 27
- 185-item survey
- Wave1: 1999; Wave 2:2000-2001 Bivariate and multivariat e analysis
- People off TANF at Time 2 experienced a decline in depression;
- Those with well-paying jobs had significantly lower depression scores over time.
Note. a - Sources: Study purpose, sample descriptions, and findings are extracted directly and with minor editorial modifications from original reports. b - Findings column summarizes study findings on the relationship of welfare participation to either youth depression or prevalence of depression among welfare recipients
Abbreviations: AFDC = Aid to Families with Dependent Children. TANF = Temporary Assistance for Needy Families. FPL = federal poverty level. PTSD= posttraumatic stress disorder.
2
Depression Measures
Shown in Table 1.2, with the exception of one study, the studies included in this review assessed depression using a standardized scale with demonstrated reliability and validity to detect elevated depressive symptoms. The one exception was the Bachman et al. (2015) study, which assessed depression using a single question directed to parents regarding their child’s depression: “Does your child have difficulty with feeling anxious or depressed?”
(2004).
As shown in Table 1.2, four studies did not report specific measures of depression; the type of missing information included the number of scale items, response scales, score range, reliability (alpha), and cut-off values for the severe depression scale (Cook et al., 2004; dosReis et al., 2001; Olfson et al., 2011; Sullivan & DeCoster, 2001). Rather than including the measure details, the authors of each of these studies referred readers to publication citation of the original work that introduced the measure.
Characteristics of Research Data and Analytical Strategies
Shown in Table 1.1, a majority of the 15 studies (n = 8) conducted cross-sectional research, and collected or analyzed one wave of data (e.g., Bachman et al., 2015; Cook et al., 2004; Nebbitt et al., 2014). One longitudinal study collected 17 waves of annual data over the 17-year study period (Gavin et al., 2011), and six studies collected two waves of data to examine the relationship between welfare participation and depression among youth over time (e.g., Knab et al., 2006;Pande, 2014; Sullivan & DeCoster, 2001). Two studies used nationally representative datasets: Dooley and Prause (2002) used data from the National Longitudinal Survey of Youth (NLSY79), and Rhee and colleagues (2005) used data from the National Longitudinal Study of Adolescent to Adult Health (Add Health). Four studies used administrative data or Medicaid claims data (dosReis et al., 2001; Nebbitt et al., 2014; Olfson et al., 2011; Richardson et al., 2003).
Depression Prevalence of Youth on Welfare Programs: Mixed Findings from
Descriptive Studies
CES-D 20-item scale score (M = 17.4; SCES-D = 9.8; range: 0-51) of African American adolescents (11 to 20 years; n = 778) residing in public housing. The average depression scores of this group was higher than the conventional 16-point cut-point value of the CES-D, indicating a
diagnosis of major depressive disorder (Dooley & Prause, 2002).
The remaining three descriptive studies reported rates of depression among the sampled youth (Cook et al., 2004; dosReis et al., 2001; Richardson et al., 2003). For example, Cook et al. (2004) collected data from 744 young women (age: M = 21 years; median = 21 years) who were pregnant and eligible for one or more welfare programs offered in Missouri (Medicaid; Women, Infants, and Children [WIC]; and SNAP). These researchers found that 11% of the young women met the diagnostic criteria for major depression.
Table 1.2
Summary of Depression Measures and Prevalence from 15 Studies
- Source & Publ. Date
- Publication Depression Measure (Original Citation) No. of Items Res-ponse Scales Score Rang e Reli-abilit y (a)
Severe Depressive Cut-off Values
Depression Prevalence %/ M (SD)
(a) Descriptive Studies (n = 4) - Cook, et al., 2004
- Obstetrics & Gynecology
Diagnostic
Interview Schedule for the DSM-IV
(Robins et al., 2003)
DNR DNR DNR DNR DNR DNR 11%
- dosReis et al., 2001 - American Journal of Public Health International Classification of Diseases, Ninth Revision, Clinical Modification (ICD-9-CM; WHO, 1979)
DNR DNR DNR DNR DNR DNR 1.3%
- Foster care: 15%
- SSI: 7%
- Other Aid: 0.7%
- Nebbitt et al., 2014 - Social Work
CES-D-20 (Radloff, 1977)
20 4-point 0: rarely or none of the time to 3: most of the time.
0-60 0.88 Higher scores indicating greater depression.
17.4 (9.8)
- Richardson et al., 2003
- Archives of Pediatrics & Adolescent Medicine
ICD-9 (WHO;1977) 9-code fields
Yes/No DNR 0-9 DNR >=1 2%
(b) Comparison Studies (n = 11) - Bachman et al.,
2015
- Maternal and Child Health Journal
Single question: Does your child have difficulty with feeling anxious or depressed?
1 3-point A lot of difficulty; A little difficulty; No difficulty.
DNR DNR DNR A lot of difficult:
- FOA:20% - SSI:34.2% - 200-300% FPL: 15.2%;
A little of difficult:
- FOA:24% - SSI:38.2% - 200-300% FPL: 28.3%
- Source & Publ. Date - Publication Depression Measure (Original Citation) No. of Items Res-ponse Scales Score Rang e Reli-abilit y (a)
Severe Depressive Cut-off Values
Depression Prevalence %/ M (SD)
- Buckner et al., 1999 - Developmental Psychology Children's Depression Inventory (CDI; Beck & Beamesderfer, 1974; Kovacs, 1985)
27 3-point 0: an absence of symptoms; 1: mild symptoms; 2: definite symptoms.
0-54 0.81 >=19 10.6% (CDI
score>=19);
- Homeless: 13.8% - Housed poor:
8.8%)
- Dooley & Prause, 2002
- American Journal of Community Psychology CES-D-20 (Radloff, 1977); CES-D-7 20; 7
0-3 0: rarely or none of the time to 3 = most of the time. 0-60; 0-21 .88; .81 >=16; DNR 25% (CES-D>=16)
- On AFDC: 43.8%
- Off AFDC: 23.8%
- Gavin et al., 2011 - Women & Health
Brief Symptom Inventory (BSI) depression
subscale (Derogatis, 1993); a brief version of the Symptom Checklist 90-R (SCL-90-R) (Derogatis, 1975)
6 5-point 0: not at all to 4: extremely.
0-24 DNR >=12; or PROMIS T-score>=63
P1: 19.8%
P2: 35.2%
P3: 33.5%
P4: 34.6%
P5: 35.2%
- Go, 1998 - Doctoral dissertation- UC Davis
CES-D-11 (Radloff, 1977; Kohout et al., 1993)
11 3-point 1=never; 2=sometimes; 3=often.
11-33 0.72 DNR M=20.02 (3.31)
- Male: 19.17(3.43)
- Female:
20.55(3.13) - Kalil et al., 2001
- American Journal of Community
Psychology
CES-D-20 (Radloff, 1977)
20 4-point 1: rarely or none of the time to 4: most of the time.
0-60(re code d)
0.88 Higher scores indicating greater depression.
17.88 (11.41)
- Knab et al., 2006 - Working Paper- Princeton University
Composite International Diagnostic Interview Short Form or CIDI-SF (Walters et al.
7 Yes/No Whether or not having feelings of dysphoria or anhedonia in the past year lasting for two weeks or more and if the symptoms lasted most of the day and
DNR DNR DNR 24.5%
(depression/anxious)
- Source & Publ. Date - Publication Depression Measure (Original Citation) No. of Items Res-ponse Scales Score Rang e Reli-abilit y (a)
Severe Depressive Cut-off Values
Depression Prevalence %/ M (SD)
during the two-week period.
- Olfson et al., 2011 - Journal of the American Academy of Child & Adolescent Psychiatry ICD-9-CM (WHO,1979) 8-code fields
DNR DNR DNR DNR DNR All youth without Tic
Disorders: 3.1%; With Tourette disorder: 14.6%; With chronic motor or vocal tics: 8.5%; With other tics: 8.3% - Pande, 2014
- Working paper-Social Science Research Network
CES-D-20 20 4-point 0: rarely or none of the time to 3: most of the time.
0-60 DNR DNR M=17.99 (10.21)
- Treatment: 17.78
- Control: 18.4 Month 18:
- Treatment: 15.79 - Control: 15.56 Month 42:
- Treatment: 15.62
- Control: 14.92 - Rhee et al., 2005
- Psychosomatic Medicine
CES-D-19 (Radloff, 1977)
19 4-point 0: complete absence of the symptom to 3: most or all of the time during the past week.
0-57 0.87 Higher scores indicating greater depression.
DNR
- Sullivan & DeCoster, 2001
- Journal of Family Social Work The Hopkins Symptom Checklist Depression Subscale (HSCD; Derrogatis, Lipman, & Covi, 1973).
DNR DNR DNR DNR DNR DNR Time 1:
- On Welfare:
37.81(10.8)
- Off Welfare:
39.13(9.53) Time 2:
- On Welfare:
36.08(13.76) - Off Welfare:
43.43(14.03) Note: DNR= Did not report.
of depression among foster care group, 7% for the SSI group, and 0.7% for the other type of aid group. Thus, descriptive research on recipients participating in different types of welfare programs and in different locations yielded a wide range of depression rates.
Some of the research also examined other factors among welfare recipient youth such as race/ethnicity. Overall, White youth receiving welfare benefits had higher rates of
depression than their other racial/ethnic counterparts. For example, dosReis et al. (2001) found that in a sample of youth enrolled in Medicaid, White youth were 1.9 times more likely to be diagnosed with depression than African American youth; however, among youth
receiving SSI benefits, African American youth were 1.7 times more likely to be diagnosed with depression than White youth. Similarly, Richardson et al. (2003) found that as compared with White youth, the youth from racial/ethnic minority groups (except for Native
Americans) had lower rates of depression. Further, they found that female Native American youth (ages 15 to 18 years) had the highest prevalence of depression (9.4%), whereas male Asian/Pacific Islander youth (ages 5 to 10 years) had the lowest prevalence of depression (0.03%). However, Nebbitt et al. (2014) found an opposite direction of gender differences on depression. They found male African American adolescents reported significantly higher (p < .05) depression score (M = 18.5) than females (M = 16.6).
with females between 15 and 18 years having twice the rate of depression of same age males. Generally, these four descriptive studies provided mixed findings. Prevalence of depression among youth on social welfare programs varied across studies based a range of individual and program characteristics, including sample size, specific welfare programs in which youth participated, geographic location, gender, and racial/ethnic minority status. Relationship Between Welfare Participation and Depression
Eleven studies conducted comparison research (e.g., welfare participation vs. non-welfare participation, or among different non-welfare programs) to examine the relationship between welfare participation and depression among youth. Overall, the reviewed comparison studies reported consistent findings that participating welfare programs was associated with higher risk for depression.
Six of the 11 studies focused on young mothers. For example, Dooley and Prause (2002) focused on the female respondents (14 to 22 years; n = 3,678) of the National Longitudinal Survey of Youth (NLSY79) survey, and found that women receiving AFDC benefits had significantly higher levels of depression as compared with women who were employed or out of the labor force. Gavin et al. (2011) used data from a 17-year longitudinal study of young mothers (starting age 14 years; n = 173), and found that receiving welfare benefits was positively and significantly associated with higher levels of depressive
consistent with those showing an association between young mothers’ (18 to 34 years; n = 2,536) welfare participation and higher levels of depression. Pande (2014) also found similar results that young mothers (16 to 22 years; n = 5,309) who participated in AFDC program were more likely to be depressed. Moreover, Sullivan and DeCoster (2001) tracked 127 young African American single-mothers who were currently or past welfare recipients (M age = 27 years) from 1990 to 2000/2001, and found that the mothers not currently enrolled in a welfare program had 2 times lower levels of depression than the mothers receiving welfare benefits. Overall, these six studies reported consistent findings of evidence that young mothers participating in welfare programs had higher levels of depression.
For other studies focused on the general youth population, results showed that youth enrolled in Medicaid and diagnosed with Tourette’s disorder had higher rates of depression as compared with youth with the same medical condition and enrolled in private insurance (Olfson et al., 2011). In addition, Rhee et al. (2005) found that youth (M = 15.6 years; n = 9,140) whose parents received welfare benefits had higher risks of having depressive
symptoms as compare with their counterparts from non-welfare households. Similar findings were reported in studies that examined a group of U.S. immigrants. For example, Go (1998) conducted a research on a group of Southeast Asian immigrant adolescents (12 to 16 years; N = 206) living in California, and found participation in welfare programs was significantly associated with higher depression scores.
showed that youth from low-income, single-parent, female headed families participating in housing related welfare programs had lower rates of depression. Specifically, Buckner et al. found youth who participated in housing programs, such as government-run emergency shelters and transitional housing facilities, and had high rates of participating in cash transfer programs (e.g., AFDC), had lower rates of depression as compared with homeless youth. However, the differences were not statistically significant, indicating housing status was not associated with self-reported depression.
Discussion
One of the primary roles of government is to promote the well-being of citizens by providing social welfare programs to address social problems such as poverty, inequity, and disparity. However, participation in social welfare programs could be a double-edged-sword. While welfare programs may increase income, secure basic human needs for survival (e.g., health care and housing), it appears that receiving welfare benefits from the government is associated with elevated mental health risk for depression or other disorders.
Results from the four descriptive studies are mixed. The reported depression rates varied by sample size, so that the studies with larger sample sizes reported lower depression rates (< 2%; e.g., dosReis et al., 2001; Richardson et al. 2003), whereas the studies with smaller sample sizes reported either higher rates (> 11%; e.g., Cook et al., 2004) or greater proportions of youth above normative levels of depression scores (Dooley & Prause, 2002). Such mixed findings indicate that depression prevalence varies according to welfare program recipient group. In future depression research on welfare recipients, conducting subgroup analyses might yield results that are more precise.
levels of depression than youth in other racial/ethnic subgroups (dosReis et al., 2001). However, studies found Native American (Richardson et al., 2003) and African American (Nebbitt et al., 2014) youth had higher rates of depression rates than other racial/ethnic subgroups. These findings are consistent with epidemiological depression prevalence among U.S. adolescents, where other racial groups (including Native Americans adolescents) had the highest depression rates (15.6%), followed by White (13.4%), Hispanic (12.6%), Asian (9.7%) and Black (9.0%) adolescent groups (Center for Behavioral Health Statistics and Quality [CBHSQ], 2016). Similarly,these findings areconsistent with findings from epidemiological surveys, which suggest that adolescent females have a higher risk of
depression compared to males (CBHSQ, 2016). This review also observed similar depression prevalence results according to gender for youth from welfare recipient families (Richardson et al. 2003). Given that female youth groups have a higher risk of depression, developing gender-specific screening and treatment programs for young women who participate in welfare programs is strongly recommended.