Endotracheal tube mucus as a source of airway mucus for rheological study
XMatthew R. Markovetz,1Durai B. Subramani,1William J. Kissner,1Cameron B. Morrison,1 Ian C. Garbarine,1Andrew Ghio,2Kathryn A. Ramsey,1Harendra Arora,3,4Priya Kumar,3,4
David B. Nix,5Tadahiro Kumagai,5Thomas M. Krunkosky,6Duncan C. Krause,6Giorgia Radicioni,1 Neil E. Alexis,7Mehmet Kesimer,1,8Michael Tiemeyer,5Richard C. Boucher,1Camille Ehre,1and David B. Hill1,9
1Marsico Lung Institute, University of North Carolina, Chapel Hill, North Carolina;2National Health and Environmental
Effects Research Laboratory, United States Environmental Protection Agency, Research Triangle Park, North Carolina; 3Department of Anesthesiology, University of North Carolina, Chapel Hill, North Carolina;4Outcomes Research Consortium,
Cleveland, Ohio;5Complex Carbohydrate Research Center, University of Georgia, Athens, Georgia;6Department of Microbiology, University of Georgia, Athens, Georgia;7Center for Environmental Medicine, Asthma, and Lung Biology, University of North Carolina, Chapel Hill, North Carolina;8Department of Pathology and Laboratory Medicine, University of North Carolina, Chapel Hill, North Carolina; and9Department of Physics and Astronomy, University of North Carolina, Chapel Hill, North Carolina
Submitted 17 June 2019; accepted in final form 1 August 2019
Markovetz MR, Subramani DB, Kissner WJ, Morrison CB, Garbarine IC, Ghio A, Ramsey KA, Arora H, Kumar P, Nix DB, Kumagai T, Krunkosky TM, Krause DC, Radicioni G, Alexis NE, Kesimer M, Tiemeyer M, Boucher RC, Ehre C, Hill DB. Endotra-cheal tube mucus as a source of airway mucus for rheological study.
Am J Physiol Lung Cell Mol Physiol317: L498 –L509, 2019. First published August 7, 2019; doi:10.1152/ajplung.00238.2019.—Muco-obstructive lung diseases (MOLDs), like cystic fibrosis and chronic obstructive pulmonary disease, affect a spectrum of subjects globally. In MOLDs, the airway mucus becomes hyperconcentrated, increasing osmotic and viscoelastic moduli and impairing mucus clearance. MOLD research requires relevant sources of healthy airway mucus for experimental manipulation and analysis. Mucus collected from endo-tracheal tubes (ETT) may represent such a source with benefits, e.g., in vivo production, over canonical sample types such as sputum or human bronchial epithelial (HBE) mucus. Ionic and biochemical compositions of ETT mucus from healthy human subjects were characterized and a stock of pooled ETT samples generated. Pooled ETT mucus exhibited concentration-dependent rheologic properties that agreed across spatial scales with reported individual ETT samples and HBE mucus. We suggest that the practical benefits compared with other sample types make ETT mucus potentially useful for MOLD research.
cystic fibrosis; muco-obstructive lung disease; mucus; mucus bio-chemistry; mucus biophysics
INTRODUCTION
The airway surface liquid (ASL) is a protective bilayer composed of the mucus layer and the periciliary layer (PCL) (7). MUC5B and MUC5AC are the primary secreted mucins in airway mucus and, with ⬎1,000 other proteins, provide the mucus layer with its characteristic viscoelastic proper-ties (23, 45). The PCL consists of grafted (tethered) poly-meric mucins and other glycoproteins that are bound to and
lubricate the cilia as they coordinately beat to propel the mucus from the lung (7, 8).
In health, the mucus and periciliary layer are coordinately hydrated to maintain efficient mucus clearance (7). Ciliary beat in health in a well-hydrated PCL environment is unrestricted by friction or negative osmotic interactions with the mucus layer. However, in muco-obstructive lung diseases (MOLDs) such as chronic obstructive pulmonary disease and cystic fibrosis (CF), the mucus layer becomes hyperconcentrated (i.e., isotonically dehydrated) (16, 19, 22, 32). The hyperconcen-trated mucus (i.e., ⬎4% solids) has increased osmotic and viscoelastic moduli that slow clearance and produce mucus stasis (2, 6). Static mucus is proinflammatory and the site of bacterial infection, which generates a positive-feedback mech-anism that further increases mucus secretion/concentration in the form of increased MUC5AC-to-MUC5B ratios (22) and increased DNA content (10). Despite the need for physiolog-ically relevant, healthy reference mucus, it is difficult to gen-erate sufficient material (mucus) to study intact mucus or the components of mucus function in health or dysfunction in disease.
Currently, human airway mucus is sourced from induced sputum (IS) in healthy subjects (2, 10, 21), spontaneous spu-tum from subjects with disease, or from human bronchial epithelial (HBE) cell culture surfaces (7, 19). Both “normal” and disease-associated sputum have strengths and weaknesses as sample types. Sputum induction in healthy subjects is relatively low-risk and minimally invasive but has two limita-tions. First, induction dilutes mucus and, since rheology is highly dependent on concentration (19), may perturb measured viscoelastic properties. Second, induction requires a trained health care team to perform the procedure and prepare the sample. In diseased patients, e.g., CF, sputum can be obtained in large volumes (~5 mL) and often without induction (i.e., “spontaneously”) (1, 5, 13). In certain diseased samples, spu-tum is subject to rapid proteolytic degradation of the mucin polymer network and polymer-dependent mechanical proper-ties (21). Infection and inflammation also increase DNA con-Address for reprint requests and other correspondence: D. B. Hill, Marsico
centrations in diseased sputum (10), which, by its stiff nature (~10 times stiffer than mucins) (40, 42), may significantly alter mucus rheological properties. CF sputum also has poor test-retest reliability in rheological assessments (37).
HBE cell culture is an effective way to obtain sterile, “healthy” airway mucus that is relatively free of proteolytic activity, DNA, or other contamination. Furthermore, it is tun-able to various concentrations, allowing for the study of con-centration-dependent viscoelastic effects (19). However, HBE mucus does not contain the vascular compartment contribu-tions to mucus and is labor intensive to obtain, requiring the care of a full-time laboratory technician to produce ~10 mL of 2% solids mucus from 120 cultures of 1 million cells per month.
In this study we investigated whether mucus obtained from the tips of endotracheal tubes (ETT) from normal subjects, without a history of lung disease or smoking, undergoing elective surgical procedures might be a practical source of mucus for biophysical studies and biochemistry. ETT mucus can be obtained in relatively large volumes (~0.6 mL per ET tube) as a by-product of outpatient surgery and, consequently, is readily available, and is not additionally invasive as a collection technique. While reports have appeared on ETT mucus (44), concerns about mucus dehydration due to evapo-ration (hypertonic dehydevapo-ration) during intubation and surgery were not fully addressed. Herein, we describe the feasibility of collecting native airway mucus from ETT and compare its rheological and biochemical properties to those of HBE mucus, induced healthy sputum, and spontaneous CF sputum.
METHODS
Endotracheal tube collection and mucus recovery. ETTs were collected by members of the Department of Anesthesiology at the University of North Carolina (UNC) Hospital in Chapel Hill as approved by the UNC Institutional Review Board (protocol no. 11-0413). The tips (approximately the last 10 cm) of the ETTs were removed upon completion of surgical procedures. The tips were placed in a 50-mL conical tube, set on ice for transport to the UNC Marsico Lung Institute, and centrifuged at 400 g upon delivery to harvest the mucus. Each tip yielded ~600L of mucus (see Table 1 and Supplemental Table S1; all Supplemental material is available at
https://doi.org/10.5281/zenodo.3351590). Samples were used imme-diately or snap-frozen and stored at⫺80°C to reduce proteolysis.
Collection of HBE mucus, induced healthy sputum, and spontane-ous CF sputum. HBE mucus was harvested from cell cultures and pooled as previously described (17). Briefly, HBE cells were grown on 1-cm2 Transwell inserts until confluent and mucus producing. Mature cultures were washed with phosphate-buffered saline (PBS), and washings were aspirated to remove surface debris and mucus. Mucus was dialyzed to a high-concentration working stock and frozen for later use. Healthy induced (38) and CF (18) sputum samples were collected under the approval of the University of North Carolina Institutional Review Board protocol no. 15-2431 and prepared for characterization and analysis as outlined previously (18). Demo-graphic information for each sample type is available in the respective references above.
Measurement of mucus Na⫹and K⫹concentrations.Evaporative water loss from ETT mucus can occur during intubation, even with ventilation with nearly 100% humidified air, and during transport to the laboratory. Because salt concentrations in normal mucus are isotonic with plasma, salt concentration can be used as an index of mucus evaporative water loss (25). Additionally, mucus in healthy induced sputum (IS) samples can be relatively dilute compared with the airways due to salivary contamination. Because saliva has a very low salt content (9), measuring Na⫹and K⫹concentrations can be used to estimate relative dilution of airway mucus during induction. Accordingly, 50-L aliquots of each ETT and IS sample were used for determination of Na⫹ and K⫹ concentrations. Mucus samples were diluted into an equal volume of 6 N HCl-10% trichloroacetic acid and maintained at 70°C for 24 h (Optima, Fisher, Pittsburgh, PA). Following centrifugation, Na⫹and K⫹concentrations were measured in the supernatant by inductive-coupled plasma optical emission spectrometry (Optima 4300 DV, PerkinElmer, Norwalk, CT). Quality assurance checks were obtained using a second multielement standard (SPEX CertiPrep, Metuchen, NJ). A multielement standard (VHG Laboratories, Manchester, NH) was used for the calibration curve.
Pooling and dilution of mucus for rheological characterization across concentrations.A “stock” ETT mucus (Table 2) was generated by pooling 150 L aliquots from the 15 isotonic ETT samples described in Table 1. The 15 samples were thawed, combined (vol-ume ⫽2.25 mL), and mixed by trituration in the presence of protease inhibitors (0.5 tablet; Roche Diagnostics, Mannheim, Germany) to prevent sample degradation. The stock was then mixed overnight on a rotator at 4°C. Aliquots of the pooled stock (4.6% solids) were removed, diluted, and mixed overnight at 4°C in PBS to generate 2%, 3%, and 4% solids samples.
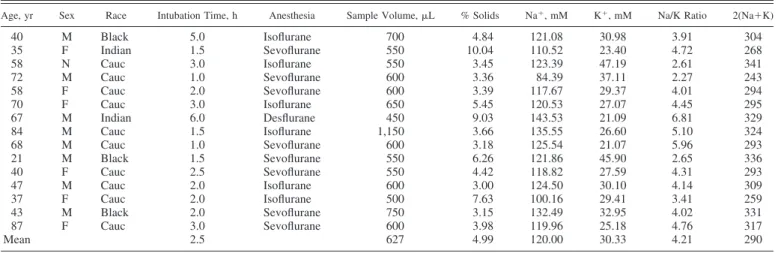
Table 1. Patient and sample characteristics for isotonic ETT mucus samples
Age, yr Sex Race Intubation Time, h Anesthesia Sample Volume,L % Solids Na⫹, mM K⫹, mM Na/K Ratio 2(Na⫹K)
40 M Black 5.0 Isoflurane 700 4.84 121.08 30.98 3.91 304
35 F Indian 1.5 Sevoflurane 550 10.04 110.52 23.40 4.72 268
58 N Cauc 3.0 Isoflurane 550 3.45 123.39 47.19 2.61 341
72 M Cauc 1.0 Sevoflurane 600 3.36 84.39 37.11 2.27 243
58 F Cauc 2.0 Sevoflurane 600 3.39 117.67 29.37 4.01 294
70 F Cauc 3.0 Isoflurane 650 5.45 120.53 27.07 4.45 295
67 M Indian 6.0 Desflurane 450 9.03 143.53 21.09 6.81 329
84 M Cauc 1.5 Isoflurane 1,150 3.66 135.55 26.60 5.10 324
68 M Cauc 1.0 Sevoflurane 600 3.18 125.54 21.07 5.96 293
21 M Black 1.5 Sevoflurane 550 6.26 121.86 45.90 2.65 336
40 F Cauc 2.5 Sevoflurane 550 4.42 118.82 27.59 4.31 293
47 M Cauc 2.0 Isoflurane 600 3.00 124.50 30.10 4.14 309
37 F Cauc 2.0 Isoflurane 500 7.63 100.16 29.41 3.41 259
43 M Black 2.0 Sevoflurane 750 3.15 132.49 32.95 4.02 331
87 F Cauc 3.0 Sevoflurane 600 3.98 119.96 25.18 4.76 317
Mean 2.5 627 4.99 120.00 30.33 4.21 290
Determination of mucin concentrations in ETT and HBE mucus and sputum. A portion of the stock was reserved for biochemical characterization of mucus concentration (% solids), mucin and protein concentrations, mucin molecular weight (MW), and mucin radius of gyration (Rg) (16). In brief, ETT mucus samples were first solubilized 1:1 in 6 M guanidinium HCl (hereinafter GuHCl; Fisher Scientific, Fairlawn, NJ) and, subsequently, diluted 1:200 in 200 mM sodium chloride with 10 mM EDTA and 0.01% sodium azide (hereinafter called light-scattering buffer, i.e., LSB) to suit instrument sensitivities. The concentration and conformation of mucins, e.g., MW and Rg, were determined by gel permeation chromatography in series with multiangle laser light scattering (MALLS) and differential refractom-etry. A 500L sample was added to a Sepharose CL-2B column (GE Health Care Life Sciences) and eluted with LSB at a flow rate of 0.5 mL/min. Effluents were passed through an in-line multiangle laser photometer (DAWN Heleos, Wyatt Technology) coupled to a refrac-tometer (Trex, Wyatt Technology) to measure light scattering and sample concentration, respectively. The mass of mucins injected into the system was determined by differential refractometry, while mucin MW andRgwere determined by best fit of scattering data at multiple angles to a second-order Berry model. Those values are given in Table 2.
HBE cells were prepared and cultured at an air-liquid interface, as previously described (26). The mucin and protein compositions of % solids concentration-matched mucus harvested from HBE cultures were also measured. In parallel, a second, concentration-matched ETT pool was prepared from the same 15 ETT samples for comparison with HBE by MALLS, as described above. Total protein concentra-tions in ETT and HBE samples were determined by MALLS using a desalting column (GE Healthcare Life Sciences) with otherwise iden-tical methods, as described above (33).
Individual protein constituents of the ETT and HBE mucus were determined by mass spectrometry as outlined in the Supplementary Methods (available at https://doi.org/10.5281/zenodo.3351590). Briefly, 100L of the pooled ETT sample were denatured in 6 M GuHCl and digested for assessment by mass spectrometry in a Dionex ultimate 3000 RSLCnano system coupled to a hybrid quadrupole Orbitrap mass spectrometer with a nanospray source (Q-Exactive, Thermo Fisher, Bremen, Germany). Proteins were identified by searching against the most current human database (Proteome Discover 1.4) and quantified using Scaffold version 4 (Proteome Software) and the normalized total precursor intensity.
Analysis of O-glycosylation of ETT mucin, sputum, and HBE cells.
At 43 days in culture, HBE cells were washed with isotonic medium and harvested by scraping. After pelleting, the cells were stored frozen at⫺80°C until analyzed. Frozen cell pellets were thawed, homoge-nized in ice-cold water, and extracted with organic solvents to remove lipids and generate a lipid-free protein preparation for subsequent glycan analysis, as previously described (3, 4). Briefly, O-linked glycans were released from glycoprotein preparations by reductive
-elimination, yielding intact, reduced structures. Following cleanup, the released O-linked glycans were permethylated and analyzed by nanospray ionization multidimensional mass spectrometry (NSI-MSn)
using instruments with linear and orbital ion trap capabilities (LTQ-Orbi, Thermo Fisher). Three biological replicates of cells cultured from the same donor were analyzed. Graphical representations of monosaccharide residues are presented in accordance with the broadly accepted Symbolic Nomenclature for Glycans, andO-linked glycan analysis was performed in keeping with the MIRAGE guidelines for glycomic studies (46, 49).
Rheology via cone-and-plate rheometer. Characterization of the bulk viscoelasticity of ETT mucus at designated concentrations was performed via cone (20 mm diameter, 1° deflection) and plate rhe-ometry. Forty microliters of mucus was loaded onto the Peltier plate of a DHR-3 rheometer (TA Instruments, New Castle, DE). Oscillatory shear testing was performed over a range of small strain magnitudes (0.02–10% strain) to determine the linear viscoelastic regimen (LVR) for the elastic (G=) and viscous (G⬙) moduli. In the LVR,G=andG⬙
are independent of shear strain, allowing for the frequency depen-dence of the viscoelastic moduli to be assessed across a range of 0.1–10 radians/s (18). This methodology was used for all mucus types studied, with at least three technical replicates per sample type.
Particle-tracking microrheology.While bulk rheological measure-ments of G= and G⬙ characterize the macroscopic properties of the mucus gel, particle-tracking microrheology (PTMR) assesses the mechanical properties of mucus at the length scale of its constituent biopolymers (27, 44). In brief, the thermally driven motion of 1- m-diameter carboxylated FluoSpheres (Thermo Fisher, Fremont, CA), henceforth referred to as “beads,” was tracked to determine the viscoelastic properties of the gel. Bead motion was recorded for 30 s at a rate of 60 frames/s using a⫻40 air objective on a Nikon Eclipse TE2000U microscope. Individual bead trajectories were measured automatically using a custom Python program that uses TrackPy (https://doi.org/10.5281/zenodo.34028) for bead localization and track-ing. Bead motion was converted to mean squared displacement (MSD) and complex viscosity (*) values in accordance with the mathemat-ics described previously (19, 31).
Statistical methods. All statistical analyses were performed in Matlab (2017, MathWorks, Natick, MA). Differences in measured values or trends were deemed statistically significant where P ⬍
␣ ⫽0.05. Differences between sample means were assessed byt-test using the ttest2 function in Matlab, and differences in trends were assessed by two-way ANOVA using the Matlab function anova2.
RESULTS
Selection and characterization of ETT samples for Na⫹, K⫹, and solids concentrations. A total of 77 samples were pro-cessed for % solids (see below), and dominant cation (Na⫹⫹ K⫹) concentration measurements were made (Supplemental Table S1). The samples on average were evaporatively con-centrated (i.e., exhibited raised total Na⫹ and K⫹ concentra-tions relative to plasma), on average, by ~1.5-fold (see Sup-plemental Table S1). Isotonic ETT samples, i.e., samples with minimal evaporative water loss, were identified by selecting samples with a Na⫹ ⫹ K⫹ value within 10% of the plasma value. All 15 isotonic samples identified were from nonsmok-ers without lung disease. Samples that were not within the normal range of tonicity could theoretically be restored to isotonicity. However, the effects of evaporative hyperconcen-tration on mucus properties/organization and their reversibility with dilution are unknown, so attempts to dilute samples were not undertaken.
The composition of minimal evaporative loss, i.e., isotonic, ETT mucus was compared with % solids and Na⫹ and K⫹ concentrations of all collected ETT samples. Consistent with selection criteria, differences were present in Na⫹ (Fig. 1A) and K⫹(Fig. 1B) concentrations between isotonic and whole-Table 2. Characteristics of pooled endotracheal tube mucus
stock used for rheology
Characteristic Pooled Value
Sample volume,L 2,250
% Solids 4.6
[Na⫹⫹K⫹]mucus/[Na⫹⫹K⫹]plasma 1.01
Mucins,g/mL 3,720
Molecular mass, kDa 2.42⫻109
Rg, nm 443.0
set samples (P ⬍0.001). Average sample volumes (Fig. 1C) and % solids values (Fig. 1D) were not significantly different between the isotonic samples and the entire set.
Table 1 provides a detailed summary of the patient demo-graphics and composition of the isotonic samples. Mucus from these 15 subjects was collected with an average individual ETT sample volume of 647L. The mean ETT solids concentration (4.99%) is in excellent agreement with values reported from
tracheostomies by Matthews et al. (34) (i.e., 5.2%) and is in reasonable agreement with values for ETT mucus studied by Schuster et al. (44) (6.9%). The average Na⫹ concentration was 120.00⫾13.60 mM and K⫹concentration was 30.86⫾ 7.86 mM.
Determination of pooled stock composition. The 2.25 mL ETT stock pool had a % solids concentration of 4.6%, [Na⫹⫹ K⫹]/[plasma Na⫹ ⫹ K⫹] ratio of ~1, and total mucins con-centration of 3.72 mg/ml (see Table 2). The average molecular mass of the ETT mucin complexes measured by gel filtration chromatography and MALLS was 2.42⫻109Da with a radius
of gyration (Rg) of 443.0 nm. These values are similar to those
for mucin complexes in CF sputum, with an average % solids of 5.27⫾1.44%, a molecular mass of 2.4⫾0.57⫻ 109Da,
andRgof 362⫾28 nm (n⫽10). However, when mucins were
isolated by density gradient separation (36) in the presence of a strong chaotropic agent, i.e., 6 M GuHCl, the molecular mass of ETT mucus fell to 0.34⫻109Da and 0.28⫻109Da for CF
sputum.Rgin these samples also decreased to 294 nm and 234
nm for ETT and CF sputum, respectively. These values were compared with the molecular mass of mucins isolated by density gradient from HBE cell culture, where molecular mass was 0.11 ⫻109Da andR
gwas 176 nm. Together, these data
indicate that mucus derived from both ETT and CF sputum in vivo contains mucins assembled into complexes larger than those formed by cell cultures.
Proteomic analyses using mass spectrometry were employed to identify the other biomacromolecular constituents of ETT mucus. The top-20 protein species by intensity from the ETT mucus pool are listed in Table 3. Both MUC5B and MUC5AC were detected, in addition to other airway-secreted proteins, such as lactotransferrin, deleted in malignant brain tumor 1 protein, immunoglobulins, club cell secretory protein, protein S100, and annexin from airway epithelium (14). Additionally serum albumin and serotransferrin were present, indicating that some serum leak into these samples occurred.
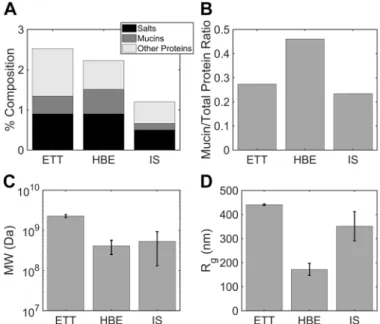
Immunohistochemical staining of ETT mucus confirmed the presence of mucins MUC5AC and MUC5B and identified Fig. 1. Characteristics of all prospective endotracheal tube (ETT) mucus
samples (All) and of those selected for being nearly isotonic (Iso).AandB: there were significantly lower (**P⬍0.001) Na⫹(A) and K⫹(B) concentra-tions in the isotonic subset (Na⫹: 120.0 mM, K⫹: 30.3 mM) relative to the average of all samples (Na⫹: 197.9 mM, K⫹: 52.9 mM), indicating that some dehydration usually occurs during intubation. We also note that K⫹ concen-tration in the isotonic samples was slightly increased above the 25 mM physiological value (†P⬍0.05).C: there was no discernable difference in sample volume between the whole set of samples (581L) and the isotonic subset (627L).D: there was also no difference in % solids between the whole set and isotonic subset.
Table 3. Top-20 proteins by intensity as detected by mass spectrometry in pooled endotracheal tube mucus
Species Accession No. Alternate ID Molecular Mass, kDa Intensity
Serum albumin ALBU_HUMAN ALB 69 2.02E⫹12
Lactotransferrin TRFL_HUMAN LTF 78 8.64E⫹11
Lysozyme C LYSC_HUMAN LYZ 17 5.83E⫹11
Immunoglobulin heavy constant-␣1 IGHA1_HUMAN IGHA1 38 5.36E⫹11
Immunoglobulin heavy constant-␣2 A0A0G2JMB2_HUMAN IGHA2 37 4.79E⫹11
Mucin-5B MUC5B_HUMAN MUC5B 596 4.38E⫹11
Immunoglobulin heavy constant-␣2 IGHA2_HUMAN IGHA2 37 3.44E⫹11
Immunoglobulin-constant IGKC_HUMAN IGKC 12 2.80E⫹11
CCSP (uteroglobin) UTER_HUMAN SCGB1A1 10 2.34E⫹11
Protein S100-A9 S10A9_HUMAN S100A9 13 2.25E⫹11
Deleted in malignant brain tumors 1 protein DMBT1_HUMAN DMBT1 261 1.64E⫹11
Polymeric immunoglobulin receptor PIGR_HUMAN PIGR 83 1.56E⫹11
Mucin-5AC MUC5A_HUMAN MUC5AC 586 1.39E⫹11
Actin, cytoplasmic 1 ACTB_HUMAN (⫹1) ACTB 42 1.29E⫹11
BPI fold-containing family B member 1 BPIB1_HUMAN BPIFB1 52 1.21E⫹11
Serotransferrin TRFE_HUMAN TF 77 1.15E⫹11
Immunoglobulin-constant 3 IGLC3_HUMAN IGLC3 11 8.79E⫹10
Immunoglobulin heavy constant-␥1 A0A0A0MS08_HUMAN (⫹1) IGHG1 44 8.67E⫹10
Immunoglobulin-like polypeptide 5 A0A0B4J231_HUMAN (⫹2) IGLL5 23 8.31E⫹10
Annexin A1 ANXA1_HUMAN ANXA1 39 8.30E⫹10
associated cell types (Supplemental Fig. S1). A combination of differential interference contrast imaging and DNA staining revealed the presence of a number of cell types, including polymorphonuclear neutrophils, ciliated epithelial cells, and macrophages (Supplemental Fig. S1, A andB). MUC5B ap-peared to be the dominant mucin compared with MUC5AC (Supplemental Fig. S1, C–F), which is in line with the mass spectrometry results outlined in Table 3 and previous reports (22). Staining for fibrin (Supplemental Fig. S2B) was positive, despite limited detection of fibrin or fibrinogen by mass spec-trometry. A glandular source for at least some of the mucus/ mucin in ETT samples was confirmed by staining for proline-rich 4 (PRR4) protein (Supplemental Fig. S2C).
Bulk rheology of pooled ETT mucus. We sought to deter-mine whether pooled ETT mucus exhibited rheologic proper-ties similar to those reported previously for respiratory mucus (44). We measured the LVR of the pooled stock over a span of 0.2–10% strain for six separate 40-L volumes of the pooled sample (Fig. 2,top). From those data, we selected 1% strain to assess the frequency-dependent viscoelastic moduli. Histori-cally, a frequency of 1 Hz has been used to compare values of viscoelastic moduli, because 1 Hz is representative of muco-ciliary clearance (MCC) mechanics (21, 44). We determined that G=was always in excess of G⬙over the range of frequen-cies tested (Fig. 2, bottom). Further, we determined the G⬙ -to-G=ratio at 1 Hz, i.e., tan(␦), and report a value of 0.29. This value agrees well with previously reported values and sugges-tions that mucus obtained from the trachea is a cross-linked gel (44).
Microrheology of ETT mucus. Thermally driven bead mo-tion was recorded in two dimensions for 30 s, generating representative trajectories, as shown in Fig. 3A. Of the four mucus concentrations prepared by PBS dilution of the pool, only the beads in the 2% solids samples explored a space exceeding their diameter over the course of video recording. The time series of their displacements were converted into MSDs. The ensemble mean log10(MSD) for each concentration
is shown in Fig. 3B, which illustrates the concentration depen-dence of bead motion and, hence, concentration dependepen-dence of mucus viscoelasticity. MSD can be related to the lag time of recorded motion () via the fractional Brownian relation MSD⫽D␣␣, where 0⬍ ␣ ⬍1 is the subdiffusive exponent
in the case of constrained thermal motion, as seen in entangled, elastic, and cross-linked gel systems (19, 28, 29). Only in purely viscid, dissipative fluids is ␣ ⫽1, and then D␣⫽4D,
whereDis the diffusion coefficient of the bead in its medium. The exponent ␣ can be calculated as the slope of the curve log10(MSD) vs. log10() for each sample, as shown in Fig. 3B.
The exponent values are␣ ⫽0.55, 0.45, 0.25, and 0.14 for 2%, 3%, 4%, and 4.6% solid samples, respectively. These data indicate that all samples exhibited restricted, subdiffusive mo-tion and that particle momo-tion was increasingly restricted with increasing concentration.
Comparison of bulk and microrheological measurements. ETT mucus is believed to be isotropic but not homogeneous (44). While beads may, therefore, reliably report the viscoelas-Fig. 2. Viscoelastic moduli of pooled 4.6% endotracheal tube (ETT) mucus.
Top: strain-dependent viscoelastic moduli at 1 radian/s over a range of 0.22–10.0% strain, which was determined to be the linear viscoelastic region.
Bottom: frequency-dependent viscoelastic moduli at 1% strain over a range of 0.016 –1.6 Hz (0.1–10 radians).G=is in excess ofG⬙over all frequencies, characteristic of a cross-linked gel.
ticity of their local environment, they may not sense the viscoelasticity of the sample at all spatial scales or locales (47). Conversely, bulk measurements may not capture the local variations in mesh size and cross-linking density at the mucin-polymer length scale. To test the features of each measurement technique, we compared PTMR with bulk measurements. Fig-ure 4 illustrates this comparison using the complex viscosity
* (Pa·s) at 1 Hz as a combined measure of both the viscosity and the elasticity of ETT mucus over a range of mucus concentrations selected for analysis. Mean bulk rheological measurements of * are shown as colored circles (means ⫾ SE; Fig. 4,top). Microrheological measurements are shown as probability density estimates of * for the ensemble of all beads in a given sample. These estimates were generated using the Matlab (2018, MathWorks) function ksdensity.
Mean values of mucus complex viscosity as obtained from both methodologies are in good general agreement. The much wider variability of * observed via PTMR indicates that the beads are able to probe the random microstructural variations of the samples. That the two methodologies generally agree indicates that the size of the PTMR bead, i.e., slightly larger than the mesh size, accurately sampled the heterogeneous microstructure of the mucus gel that imparts the macroscopic viscoelasticity of the gel.
Biochemical comparison of ETT mucus, HBE mucus, and normal induced sputum. HBE mucus is an in vitro model for studying the biophysics and biochemistry of airway mucus (18, 19). However, questions have been raised regarding its simi-larity to native airway mucus and, therefore, its suitability as a model system. We prepared a stock of HBE mucus for com-parison with a second pool of ETT mucus from the same 15 subjects and measured the protein composition of ETT and HBE mucus using MALLS. These measurements were also
compared with the reported average values from 15 induced sputum (IS) samples collected from healthy subjects as part of a previous study (38). In general, measurements of the second ETT pool agreed well with the first pool results presented in Table 2. Mucin concentration was 4.44 mg/ml in the ETT pool and and 6.12 mg/ml in the HBE mucus pool (Fig. 5A), are similar to those reported by Matsui and colleagues in HBE mucus (33) and Schuster et al. in ETT mucus (44). Average mucin concentration was 1.64 mg/ml in the IS samples (Fig. 5A).
Total nonmucin protein concentration was 11.8 mg/ml in ETT mucus and 7.16 mg/ml in HBE mucus as calculated from refractometry using a desalting column. A desalting column was not used on IS samples as part of their analysis during the previous study (38). Therefore, the value of total nonmucin protein in IS samples was estimated as average solids content [1.2% solids, as previously reported (38)] minus mucin content (0.164%) and salt content, which was estimated from induc-tively coupled plasma atomic emission spectroscopy (ICP-OES) measurements of Na⫹ and K⫹ concentrations. Briefly, salt content was calculated from the following relationship:
关
salt兴
IS⫽关
Na ⫹兴
IS⫹
关
K⫹兴
IS关
Na⫹兴
ASL⫹关
K⫹兴
ASL⫻关
salt兴
ASL⫽65.2 mM⫹15.6 mM
120 mM⫹25 mM ⫻0.9%⫽0.5%
Accordingly, nonmucin protein concentration was deter-mined to be 0.53%, or 5.3 mg/ml, for IS. The total nonmucin protein concentrations for each sample type are illustrated in light gray in Fig. 5A. Figure 5Bshows that ETT mucus had a Fig. 4. Comparison of endotracheal tube (ETT) mucus bulk (macro) rheology
to particle-tracking microrheology (PTMR). Bulk rheological measurements (dots, means⫾SE) of complex viscosity (*) agree well with the central tendencies of the PTMR ensemble distributions (filled regions) of* in all mucus concentrations. PTMR * distributions are represented as kernel-smoothed estimates of the probability density. The ordinate value chosen for bulk measurements was arbitrary.
Fig. 5. Mucin and protein composition in endotracheal tube (ETT), induced sputum (IS), and human bronchial endothelial (HBE) mucus via multiangle laser light scattering (MALLS).A: total solids composition of ETT, IS, and HBE mucus as % salts (0.9% ETT vs. 0.9% HBE vs. 0.5% IS), mucins (0.44% ETT vs. 0.61% HBE vs. 0.164% IS), and other proteins (1.18% ETT vs. 0.72% HBE vs. 0.53% IS).B: mucin-to-other protein ratio in ETT (0.27), IS (0.23), and HBE (0.46).C: molecular mass of mucins in ETT (2.28⫻109Da), IS
(5.31⫻108Da), and HBE (4.10⫻108Da).D: radius of gyration (R g) of
mucin-to-total protein ratio of 0.27 that is roughly twofold lower than the 0.46 of HBE mucus. In contrast, IS had a mucin-to-total protein ratio of 0.23, or roughly equal to that of ETT.
The molecular mass and size of ETT samples analyzed by MALLS without prior density gradient centrifugation were also compared with values for IS and HBE. The molecular mass of the mucus peak components of ETT samples (2.28⫻ 109⫾0.2⫻109Da, means ⫾SD of both pools) was roughly
four to five times greater than that of IS (5.3⫾4.0⫻108Da,
n⫽15 historical samples) or HBE (4.1⫾1.6⫻108Da,n⫽
8 historical samples) (Fig. 5C). This difference was associa-ted with an increase in radius of gyration for ETT mucus (440.9⫾2.9 nm) vs. IS (351.7⫾60.4 nm) or HBE (171.9⫾ 25.2 nm) mucus (Fig. 5D).
Taken together, these findings indicate that the concentra-tions of mucin in ETT and HBE mucus are roughly similar. However, the total protein content is higher in ETT mucus, and the mucin percentage of total protein lower, reflecting addition of serum and, likely, general airway epithelial proteins in ETT samples. Sputum induction is known to dilute samples (16) and is associated with salivary contam-ination, which may explain the relatively low mucin con-centrations in the IS samples. That the relative proportion of mucins among total proteins is preserved by correcting for salivary dilution based on salt concentration indicates that salivary contamination likely occurred.
Glycosylation of ETT, HBE, and CF sputum samples. Gly-cosylation of the mucin VNTR regions can be a key determi-nant of mucin properties. We compared the O-linked glycan profiles of ETT mucus (n⫽3) with the profiles of HBE (n⫽ 3) and IS (n⫽3). Among the most abundantO-linked glycans, 13 nonsulfated and 8 sulfated structures were shared across the three sample types. These structures, as well as less abundant glycans that were detectable but not quantifiable, demonstrated the expected heterogeneity arising from normal human genetic variation in the fucosyltransferase encoded at the secretor (sec) locus. This heterogeneity was detected as increased addition of fucose (Fuc) to glycans harvested from sec⫹/⫹individuals and
increased addition of sialic acid (NeuAc) in sec⫺/⫺individuals.
Glycans harvested from sec⫹/⫺individuals exhibit
intermedi-ate relative abundances of NeuAc and Fuc addition (35). Samples of ETT and IS mucus were obtained from all three secretor genotypes, and HBE cells were prepared in three biological replicates from sec⫺/⫺subjects. The relative
abun-dance of nonsulfated glycans was compared across samples by hierarchical clustering (49) and demonstrated that sec⫺/⫺
sta-tus segregated the glycan profiles of ETT, sputum, and HBE away from the other two genotypes (Fig. 6, left). Thus, non-sulfated glycan profiles distinguished the secretor status of the donor more than the source of the material (ETT, IS, HBE). However, for sulfated glycans, ETT and HBE profiles segre-gated away from healthy IS samples regardless of secretor status, and hierarchical clustering of sulfated glycans failed to detect differences between HBE cells and ETT mucus (Fig. 6, right); sulfated glycan profiles indicated greater similarity between ETT mucus and HBE cells than between HBE/ETT mucus and IS. Furthermore, this difference was observed independent of the secretor status of the donor (24, 30, 43). The major factor driving the clustering of IS away from HBE/ETT was the reduced structural complexity of the sulfated glycans
in IS compared with HBE/ETT. The relative abundance of a single glycan (sulfated glycan #5) dominates the IS profile compared with the greater diversity of sulfated structures detected in HBE and ETT (Fig. 6, right). In HBE and ETT, sulfated glycan #5 is also highly abundant but shares the status of highest relative abundance with sulfated glycan #3, the sialylated form of sulfated glycan #5. Reduced relative abun-dance of sialylated glycans in IS was also detected in the nonsulfated glycans (Fig. 6, left). The three most abundant sialylated, nonsulfated glycans (nonsulfated structures #5, 6, and 7, Fig. 6,left) accounted for 34⫾13, 48⫾8, and 77⫾2% (means ⫾ SE) of the total nonsulfated glycan profile for IS, ETT, and HBE, respectively. Thus, in comparison to induced sputum, ETT and HBE mucus is characterized by a higher relative abundance of sialylated and sulfosialylated glycans.
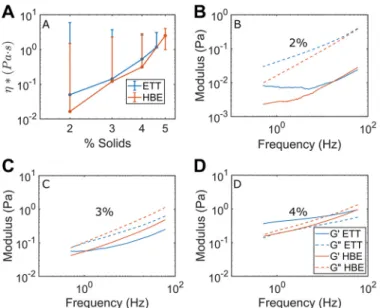
Biophysical comparison of ETT mucus with HBE mucus. Because increased mucus concentration (i.e., isotonic dehydra-tion) is a primary pathophysiologic variable in MOLDs, such as CF (2, 7, 18, 19, 33), we sought to determine whether the concentration dependence of mucus viscoelasticity was similar in ETT and HBE mucus. Hill and colleagues (19) previously performed a concentration-dependent microrheological analy-sis of HBE mucus over a range of concentrations similar to those utilized in the present study. Figure 7A demonstrates close agreement for* in ETT (blue curves) and HBE (orange curves) mucus across this range of concentrations. Two-way ANOVA revealed that concentration had a significant effect on changing*, while sample type did not. Additionally, a nearly identical scaling behavior as seen in ETT and HBE mucus was found in sputum samples from individual patients with CF (Supplemental Fig. S3).
Frequency responses as measured by PTMR in ETT vs. HBE mucus illustrated that while agreement was not perfect between sample types at 2% (Fig. 7B), 3% (Fig. 7C), and 4% (Fig. 7D), it was better than within concentrations for each sample type, as determined at 1 Hz by two-way ANOVA (P⬍ 0.05 for % solids vs.P⫽not significant for sample type). Put simply, concentration had more influence than sample origin on viscoelastic properties. This conclusion was also borne out at 0.1 and 10 Hz (see Supplemental Fig. S4). These findings indicate that both sample types may be useful for studying the viscoelastic mechanics of healthy airway mucus across a range of concentrations. Notably, the loss modulus G⬙ was greater than G=in all samples except 4% solids ETT, in line with data Hill and colleagues had previously reported in HBE regarding a sol-gel transition occurring near that concentration (19).
DISCUSSION
volume generated from 1 mo of harvesting HBE mucus from
⬎100 HBE cultures (on 1 cm2 inserts). Human bronchial
epithelial cells have been a gold standard for mucus produc-tion, because HBE cultures recapitulate many of the compo-nents of the MCC mechanism in airways, including secretory cell mucus production and coordinated, mucomotive ciliary beat. For this reason, despite the labor-intensive requirement to produce small mucus volumes, HBE cultures have been widely used to study MOLDs (17, 19, 20, 33). However, questions remain as to whether the absence of gland mucus and the normal plasma proteins that passively permeate into mucus limit HBE mucus as being representative of in vivo airway mucus. Induced sputum from healthy subjects is minimally invasive, but inhalation of hypertonic saline (HS) for induction is time/medical personnel-consuming. Notably, HS induction may dilute mucus by ~25% (15), and salivary contamination generates a second form of dilution.
In addition to the relative ease of obtaining ETT mucus, ETT mucus is attractive as a source of mucus because it is an “in vivo”-produced airway mucus. ETT mucus can also be ob-tained in relatively large (⬎0.6 mL/ETT; Fig. 1A) volumes
multiple times per week as a by-product of surgeries performed on subjects without respiratory disease. These sample volumes would be sufficient to use with methods that require larger aliquots [e.g.,⬎3L for flame photometry (25)] to accurately assess ion concentration for those without access to ICP-OES equipment. Typical ETT samples, on average, were composed of ~5.6⫾2.8% solids (Fig. 1,bottom right) and exhibited Na⫹ and K⫹ concentrations that were ~1.5-fold greater than ASL and plasma values (Fig. 1, bottom left). This hypertonicity is likely explained by evaporative water loss during mechanical ventilation. However, 15 of 77 samples exhibited sums of cations, i.e., Na⫹and K⫹, that were within 10% of plasma Na⫹ and K⫹ and, hence, were isotonic with minimal evaporative water loss (Table 1). We pooled these samples for studies of ETT mucus to avoid potential artifacts associated with samples that experienced evaporation and would require water dilution to restore isotonicity (Table 2). Furthermore, salt concentration has been shown to have a significant effect on the biophysical behavior of mucin gels (47), underscoring the utility of a sample type with physiological electrolyte composition. Fig. 6. Hierarchical clustering ofO-linked glycan profiles of endotracheal tube (ETT) mucin, sputum (S), and human bronchial epithelial (HBE) cells.Left: nonsulfatedO-linked glycans were harvested and analyzed by nanospray ionization multidimensional mass spectrometry (NSI-MSn) in positive-ion mode. The 13 highest-abundanceO-linked glycans detected in ETT mucus (ETT), sputum (S) from healthy subjects, and human bronchial epithelial cells cultured at an air-liquid interface (HBE) were quantified as the percentage of the signal intensity that each individual glycan contributed to the total signal intensity for all 13 glycans (percentage of total profile). Based on the total glycan profile, donors of the indicated samples were characterized as sec⫹/⫹, sec⫹/⫺, or sec⫺/⫺for the
fucosyltransferase activity encoded at the human secretor (sec) locus. Hierarchical clustering was performed to assess the closest similarities across the samples. Sec⫺/⫺samples segregated together, regardless of their source (ETT, S, or HBE), indicating that secretor status outweighs sample source as a determinant of
Cone-and-plate rheometry revealed that mucus from the pooled ETT stock exhibited viscoelastic properties that were virtually identical to the average of previously reported indi-vidually tested ETT samples (41, 44). Figure 2 illustrates that the pooled sample behaved as a viscoelastic, cross-linked gel, and computation of tan(␦) at 1 Hz (0.29) revealed viscous and elastic properties close to tan(␦)⫽0.3 reported by Schuster et al. (44) and tan(␦)⫽0.33 reported by Rubin et al. (41) for ETT mucus. This data set suggests that pooling ETT mucus into large volumes did not alter the bulk rheological behavior of native mucus and offers the advantage of providing for larger working volumes of airway mucus for well-controlled mac-rorheological analyses.
PTMR is useful in the analysis of entangled and cross-linked gels, because it can reveal the viscous and elastic properties of the gel at the scale of its polymer network (48). Hindered (i.e., non-Brownian, subdiffusive) bead motion is related to the elasticity of the gel, while diffusion is reflective of the dissi-pative properties of the interstitial liquid within the mesh. These two elements can be visualized in Fig. 3A, where, at 2% solids concentrations, the polystyrene beads were able to move beyond their own diameter over the time course of the exper-iment. At 3% solids concentration, bead motion was “caged” to an area within its own diameter. At higher solids concentra-tions, bead motion was severely constrained. This caging is
also illustrated in Fig. 3B, where the base-10 logarithm of the mean squared displacements of bead motion are plotted against the logarithm of lag time,. In purely viscid liquids, the slope of the log-transformed curve is␣ ⫽1. As elastic interactions between beads and mucus increase, the slope decreases as bead motion became more restricted. The concentration-dependent decrease in MSD in Fig. 3Bis reflective of the concentration-dependent increase in mucus gel stiffness that contributes to failure of MCC in MOLDs.
PTMR is also an important methodology for the study of the biophysical properties of mucus, because it is able to capture the innate heterogeneity of the fluid on the length scale of its molecular constituents. By evaluating the rheology explored by an ensemble of beads in a sample type, the “rheological topology” of a sample can be determined, sometimes revealing emergent behaviors compared with bulk measurements. Figure 4 illustrates this feature, where the mean viscoelastic character of the mucus was similar for bulk and PTMR measurements. However, the PTMR measurements were more heterogeneous. In particular, the probability density estimate of the 2% solids ensemble reveals rheologies across nearly 3 logs of* and a clear bimodality. However, the central tendency of the ensem-ble PTMR data was in agreement with bulk mean values, suggesting that bulk rheological measurements provide a coarse-grain survey of the biophysical properties of a sample. The bimodality of the 2% sample is notable for the similarity of its higher-viscosity mode to the distribution of the 3% sample. As these samples were obtained via serial dilution, it may be that the two modes represent a snapshot of a transition between phases. Georgiades and colleagues (12) reported that the transition between entanglement and overlap in porcine gastric and duodenal mucus was between 2% and 3% solids, respectively. It may be that our samples were not fully mixed into the PBS diluent to form a uniform phase.
Relevant biochemical characterizations of ETT mucus are the absolute mucin concentration and the ratio of mucin to “other” biologic molecule composition and how those values compare with HBE mucus and IS from normal subjects. Figure 5A illustrates the total solids content of ETT, IS, and HBE mucus. Mucin complexes comprised slightly more than 0.5% of both ETT and HBE samples, with ETT mucin complexes measured at 4.44 mg/ml and HBE mucins at 6.12 mg/ml, while IS samples had lower mucin concentrations of 1.64 mg/ml. Differences were also observed in the quantity of nonmucin proteins in the samples. ETT mucus (11.8 mg/ml) had abso-lutely more nonmucin protein material than IS (5.35 mg/ml) and HBE mucus (7.16 mg/ml).
Figure 5B illustrates the differences in mucin-to-other pro-tein ratios between ETT, IS, and HBE samples. The proteomics data identified the source of increased nonmucin proteins in ETT versus HBE as serum leak proteins (albumin) and airway epithelial proteins that may be glandular in origin. Thus, ETTs may sample a broader variety of proteins that normally are part of mucus in vivo than HBE cells. The relatively similar proportions of mucin and nonmucin proteins may be explained, at least in part, by the dilution of both mucins and nonmucin protein by HS induction. The possible contribution of salivary contamination to IS mucin/nonmucin protein concentrations is unknown. The data also indicate that rough comparisons of mucin concentrations between in vivo samples and/or HBE samples based on % solids may be inaccurate.
Fig. 7. Comparison of particle-tracking microrheology measurements of vis-coelasticity in endotracheal tube (ETT, blue) and human bronchial endothelial (HBE, orange) mucus.A: complex viscosity (*) in ETT and HBE mucus. Slopes of lines of best fit for HBE and ETT excluding 2% werem⫽5.2 and
We also performed MALLS with pooled ETT mucus for comparison with HBE and IS samples with nominally identical % solids content. Figure 5,CandD, illustrates that the starkest difference between ETT mucus, IS, and HBE mucus was in the size of their mucin complexes. ETT mucins formed enormous complexes with molecular mass of 2.28 GDa (Fig. 5C) andRg
of 440.9 nm (Fig. 5D), respectively. In contrast, HBE mucins formed smaller complexes with molecular mass of 410.0 MDa andRgof 171.9 nm. IS was associated with smaller complexes
but similar Rg. When mucins from all sample types were
exposed to isopycnic centrifugation, molecular mass of ETT mucus fell and was similar to values reported for IS and HBE mucus, with molecular mass of 338 MDa. The large complexes found in ETT mucus before chaotropic, isopycnic isolation may be formed due to the presence of mucin interactions with globular proteins, aggregation of mucins with inhaled particles, or large submucosal gland extrusions (11) not found in HBE cultures. Furthermore, because the IS samples appeared to suffer from salivary contamination, as evidenced by dilute ion concentrations relative to ASL values, the IS molecular mass and Rg values may reflect a component of salivary mucin
complexes that have been reported to have molecular mass of roughly 10 – 40 MDa and proportionate Rg values (39).
To-gether, these data indicate that studies of large-molecular-weight macromolecular forms of mucins may be best per-formed in ETT samples.
The hydrophilic nature and anionic charge of the glycans attached to mucins contribute significantly to the physicochem-ical properties of mucus. Our glycomics analysis demonstrated that ETT and HBE mucus were more similar to each other than to IS from healthy individuals (Fig. 6). TheO-linked glycans of ETT and HBE, in comparison to IS, exhibited greater relative abundance of nonsulfated sialylated glycans and of sulfated sialylated glycans. These glycomic signatures may reflect in-teresting, but currently uncharacterized, differential expression of specific sulfo- and sialyltransferases in the secretory epithe-lia from which the mucus is derived. Alternatively, sputum glycans may be susceptible to desialylation by host salivary or microbial sialidases that do not have access to O-linked gly-cans harvested through ETT or are not present in the aseptic environment of HBE cultures. Our observation that the major O-linked glycans of ETT mucus were more similar to HBE mucin glycans than IS glycans suggests that IS may not appropriately reflect the characteristics of airway mucus and, to the extent that glycosylation influences mucus function, may not be a representative sample type for study of the physico-chemical properties of airway mucus.
Using PTMR, we were able to compare the rheology of ETT mucus with HBE mucus. Figure 7A illustrates that the com-posite viscoelasticity (as*) was similar for each sample type and that each displayed a similar dependence on concentration. Viscosity has a power law dependence on concentration that can be calculated from the slope (m) of the curve log10(*) vs.
log10(c). Our reported values for HBE (m⫽5.2) and ETT
mucus above 2% solids (m⫽4.9) agree well with values reported by Georgiades et al. in porcine duodenal mucus under entanglement regimens (12). If concerns regarding the phase (i.e., overlap vs. entanglement) implications of the bimodality in 2% ETT mucus are disregarded, adding its reported viscos-ity to the fit yields m⫽3.74, which agrees with the values reported by Georgiades et al. for porcine gastric mucus, where
m⫽3.92. Additionally, the behavior of these pooled samples agreed well with data from individual CF sputum samples (Supplemental Fig. S3).
We also used PTMR to compare the frequency responses of ETT and HBE mucus. Values for G= and G⬙ were in good agreement for both sample types at 2% solids concentration, particularly at higher frequencies (Fig. 7B). Generally good agreement was also found between ETT and HBE mucus at 3% solids (Fig. 7C). In all 2% and 3% measurements, G⬙exceeded G=, which is characteristic of a viscoelastic sol (19). At 4% solids, G= and G⬙ were similar in ETT mucus, as has been reported previously by Hill and colleagues (19). In contrast to previous and current (Fig. 7A) HBE data, G=exceeded G⬙ in ETT mucus of 4% solids concentration. This behavior is characteristic of a viscoelastic gel, implying that between 3% and 4% solids, ETT mucus undergoes a sol-gel transition, whereas HBE mucus undergoes a similar transition at just above 4% solids (19). Despite this difference between the two sample types, ETT samples provide a source of native airway mucus that has both sol and gel phases and viscoelastic behavior similar to other mucus types.
In conclusion, this study describes extended biochemical and biophysical analyses of native human airway mucus ob-tained from endotracheal tubes (ETTs). We selected and com-bined mucus obtained only from ETTs with salt concentrations similar to those found in the airway surface liquid, i.e., with minimal evaporative water loss. A large volume of pooled ETT mucus samples behaved rheologically similarly to previous reports of individual ETT samples. The pooled samples were tunable with respect to mucus concentration while maintaining physiological (isotonic) Na⫹and K⫹concentrations. Our bio-physical measurements agreed well with previous studies in other mucus types, including mucus obtained from HBE cell cultures in this and previous work, where sample volumes can be prohibitively small. ETT mucus may have a broader repre-sentation of endogenous nonmucin organic molecules that may contribute to mucin organization in vivo. In summary, ETT mucus is a viable source of large volumes of native, tunable airway mucus for the study of muco-obstructive airway dis-eases.
ACKNOWLEDGMENTS
The authors thank Dr. Brian Button for help in measuring individual sample % solids content and Stephanie Livengood for assistance with MALLS.
GRANTS
This work was funded by Cystic Fibrosis Foundation Grants SUBRAM17I0, MARKOV18F0, EHRE16XX0, Hill16XX0, and Bouche15R0, National Institute of Allergy and Infectious Diseases Grant AI-110098, and National Institute of Diabetes and Digestive and Kidney Diseases Grant P30DK065988.
DISCLOSURES
No conflicts of interest, financial or otherwise, are declared by the authors.
AUTHOR CONTRIBUTIONS
M.R.M., D.B.S., W.J.K., C.B.M., I.C.G., K.A.R., H.A., P.A.K., N.E.A., M.K., M.T., R.C.B., C.E., and D.B.H. edited and revised manuscript; M.R.M., D.B.S., W.J.K., C.B.M., I.C.G., A.L.G., K.A.R., H.A., P.A.K., D.B.N., T.K., T.M.K., D.C.K., G.R., N.E.A., M.K., M.T., R.C.B., C.E., and D.B.H. approved final version of manuscript.
REFERENCES
1. Alexis NE, Wells H, Siperly E, Goldstein B, Henderson AG, Peden DB. Baseline sputum parameters in normals, asthmatics, COPD, atopics, smok-ers and ex-smoksmok-ers (Abstract).J Allergy Clin Immunol137: AB208, 2016. doi:10.1016/j.jaci.2015.12.1121.
2. Anderson WH, Coakley RD, Button B, Henderson AG, Zeman KL, Alexis NE, Peden DB, Lazarowski ER, Davis CW, Bailey S, Fuller F, Almond M, Qaqish B, Bordonali E, Rubinstein M, Bennett WD, Kesimer M, Boucher RC. The relationship of mucus concentration (hydration) to mucus osmotic pressure and transport in chronic bronchitis.
Am J Respir Crit Care Med 192: 182–190, 2015. doi:10.1164/rccm. 201412-2230OC.
3. Aoki K, Perlman M, Lim JM, Cantu R, Wells L, Tiemeyer M. Dynamic developmental elaboration ofN-linked glycan complexity in the
Drosophila melanogasterembryo.J Biol Chem282: 9127–9142, 2007. doi:10.1074/jbc.M606711200.
4. Aoki K, Porterfield M, Lee SS, Dong B, Nguyen K, McGlamry KH, Tiemeyer M.The diversity ofO-linked glycans expressed during Dro-sophila melanogasterdevelopment reflects stage- and tissue-specific re-quirements for cell signaling. J Biol Chem 283: 30385–30400, 2008. doi:10.1074/jbc.M804925200.
5. Bhowmik A, Seemungal TA, Sapsford RJ, Devalia JL, Wedzicha JA. Comparison of spontaneous and induced sputum for investigation of airway inflammation in chronic obstructive pulmonary disease.Thorax53: 953–956, 1998. doi:10.1136/thx.53.11.953.
6. Button B, Anderson WH, Boucher RC.Mucus hyperconcentration as a unifying aspect of the chronic bronchitic phenotype.Ann Am Thorac Soc
13,Suppl2: S156 –S162, 2016. doi:10.1513/AnnalsATS.201507-455KV. 7. Button B, Cai LH, Ehre C, Kesimer M, Hill DB, Sheehan JK, Boucher RC, Rubinstein M. A periciliary brush promotes the lung health by separating the mucus layer from airway epithelia.Science337: 937–941, 2012. doi:10.1126/science.1223012.
8. Casalino-Matsuda SM, Monzón ME, Forteza RM.Epidermal growth factor receptor activation by epidermal growth factor mediates oxidant-induced goblet cell metaplasia in human airway epithelium.Am J Respir Cell Mol Biol34: 581–591, 2006. doi:10.1165/rcmb.2005-0386OC. 9. Dawes C.Circadian rhythms in human salivary flow rate and composition.
J Physiol220: 529 –545, 1972. doi:10.1113/jphysiol.1972.sp009721. 10. Duncan GA, Jung J, Joseph A, Thaxton AL, West NE, Boyle MP,
Hanes J, Suk JS.Microstructural alterations of sputum in cystic fibrosis lung disease.JCI Insight1: e88198, 2016. doi:10.1172/jci.insight.88198. 11. Ermund A, Meiss LN, Rodriguez-Pineiro AM, Bähr A, Nilsson HE, Trillo-Muyo S, Ridley C, Thornton DJ, Wine JJ, Hebert H, Klymiuk N, Hansson GC. The normal trachea is cleaned by MUC5B mucin bundles from the submucosal glands coated with the MUC5AC mucin.
Biochem Biophys Res Commun492: 331–337, 2017. doi:10.1016/j.bbrc. 2017.08.113.
12. Georgiades P, Pudney PDA, Thornton DJ, Waigh TA.Particle tracking microrheology of purified gastrointestinal mucins.Biopolymers101: 366 – 377, 2014. doi:10.1002/bip.22372.
13. Gershman NH, Wong HH, Liu JT, Mahlmeister MJ, Fahy JV. Comparison of two methods of collecting induced sputum in asthmatic subjects.Eur Respir J9: 2448 –2453, 1996. doi:10.1183/09031936.96. 09122448.
14. Fischer AJ, Goss KL, Scheetz TE, Wohlford-Lenane CL, Snyder JM, McCray PB Jr.Differential gene expression in human conducting airway surface epithelia and submucosal glands.Am J Respir Cell Mol Biol40: 189 –199, 2009. doi:10.1165/rcmb.2008-0240OC.
15. Henderson AG, Anderson WH, Ceppe A, Coakley RD, Button B, Alexis NE, Peden DB, Lazarowski ER, Davis CW, Fuller F, Almond M, Qaqish B, Kesimer M, Boucher RC.Mucus hydration in subjects with stable chronic bronchitis: a comparison of spontaneous and induced sputum.COPD15: 572–580, 2018. doi:10.1080/15412555.2019.1566892. 16. Henderson AG, Ehre C, Button B, Abdullah LH, Cai LH, Leigh MW, DeMaria GC, Matsui H, Donaldson SH, Davis CW, Sheehan JK, Boucher RC, Kesimer M.Cystic fibrosis airway secretions exhibit mucin hyperconcentration and increased osmotic pressure.J Clin Invest 124: 3047–3060, 2014. doi:10.1172/JCI73469.
17. Hill DB, Button B. Establishment of respiratory air-liquid interface cultures and their use in studying mucin production, secretion, and function. In:Mucins: Methods and Protocols, edited by McGuckin MA, Thornton DJ. New York: Springer, 2012, p. 245–258.
18. Hill DB, Long RF, Kissner WJ, Atieh E, Garbarine IC, Markovetz MR, Fontana NC, Christy M, Habibpour M, Tarran R, Forest MG, Boucher RC, Button B.Pathological mucus and impaired mucus clear-ance in cystic fibrosis patients result from increased concentration, not altered pH. Eur Respir J 52: 1801297, 2018. doi:10.1183/13993003. 01297-2018.
19. Hill DB, Vasquez PA, Mellnik J, McKinley SA, Vose A, Mu F, Henderson AG, Donaldson SH, Alexis NE, Boucher RC, Forest MG. A biophysical basis for mucus solids concentration as a candidate bio-marker for airways disease.PLoS One9: e87681, 2014. [Erratum inPLoS One9(5): e97980, 2014.] doi:10.1371/journal.pone.0087681.
20. Holmén JM, Karlsson NG, Abdullah LH, Randell SH, Sheehan JK, Hansson GC, Davis CW. Mucins and their O-glycans from human bronchial epithelial cell cultures.Am J Physiol Lung Cell Mol Physiol287: L824 –L834, 2004. doi:10.1152/ajplung.00108.2004.
21. Innes AL, Carrington SD, Thornton DJ, Kirkham S, Rousseau K, Dougherty RH, Raymond WW, Caughey GH, Muller SJ, Fahy JV.Ex vivo sputum analysis reveals impairment of protease-dependent mucus degradation by plasma proteins in acute asthma.Am J Respir Crit Care Med180: 203–210, 2009. doi:10.1164/rccm.200807-1056OC.
22. Kesimer M, Ford AA, Ceppe A, Radicioni G, Cao R, Davis CW, Doerschuk CM, Alexis NE, Anderson WH, Henderson AG, Barr RG, Bleecker ER, Christenson SA, Cooper CB, Han MK, Hansel NN, Hastie AT, Hoffman EA, Kanner RE, Martinez F, Paine R III, Woodruff PG, O’Neal WK, Boucher RC.Airway mucin concentration as a marker of chronic bronchitis. N Engl J Med377: 911–922, 2017. doi:10.1056/NEJMoa1701632.
23. Kesimer M, Kirkham S, Pickles RJ, Henderson AG, Alexis NE, Demaria G, Knight D, Thornton DJ, Sheehan JK.Tracheobronchial air-liquid interface cell culture: a model for innate mucosal defense of the upper airways? Am J Physiol Lung Cell Mol Physiol 296: L92–L100, 2009. doi:10.1152/ajplung.90388.2008.
24. Kiwamoto T, Katoh T, Evans CM, Janssen WJ, Brummet ME, Hudson SA, Zhu Z, Tiemeyer M, Bochner BS. Endogenous airway mucins carry glycans that bind Siglec-F and induce eosinophil apoptosis.
J Allergy Clin Immunol 135: 1329 –1340.e9, 2015. doi:10.1016/j.jaci. 2014.10.027.
25. Knowles MR, Robinson JM, Wood RE, Pue CA, Mentz WM, Wager GC, Gatzy JT, Boucher RC.Ion composition of airway surface liquid of patients with cystic fibrosis as compared with normal and disease-control subjects.J Clin Invest100: 2588 –2595, 1997. doi:10.1172/JCI119802. 26. Krunkosky TM, Jordan JL, Chambers E, Krause DC.Mycoplasma
pneumoniae host-pathogen studies in an air-liquid culture of differentiated human airway epithelial cells.Microb Pathog42: 98 –103, 2007. doi:10. 1016/j.micpath.2006.11.003.
27. Lai SK, Wang YY, Wirtz D, Hanes J.Micro- and macrorheology of mucus.Adv Drug Deliv Rev61: 86 –100, 2009. doi:10.1016/j.addr.2008. 09.012.
28. Larsen TH, Furst EM.Microrheology of the liquid-solid transition during gelation.Phys Rev Lett100: 146001, 2008. doi:10.1103/PhysRevLett.100. 146001.
29. Lysy M, Pillai NS, Hill DB, Forest MG, Mellnik JW, Vasquez PA, McKinley SA.Model comparison for single particle tracking in biological fluids (Abstract).J Am Stat Assoc111: 1413–1426, 2017. doi:10.1080/ 01621459.2016.1158716.
30. Macauley MS, Crocker PR, Paulson JC.Siglec-mediated regulation of immune cell function in disease.Nat Rev Immunol14: 653–666, 2014. doi:10.1038/nri3737.
31. Mason TG.Estimating the viscoelastic moduli of complex fluids using the generalized Stokes-Einstein equation. Rheol Acta 39: 371–378, 2000. doi:10.1007/s003970000094.
32. Matsui H, Grubb BR, Tarran R, Randell SH, Gatzy JT, Davis CW, Boucher RC.Evidence for periciliary liquid layer depletion, not abnormal ion composition, in the pathogenesis of cystic fibrosis airways disease.
Cell95: 1005–1015, 1998. doi:10.1016/S0092-8674(00)81724-9. 33. Matsui H, Wagner VE, Hill DB, Schwab UE, Rogers TD, Button B,
Taylor RM II, Superfine R, Rubinstein M, Iglewski BH, Boucher RC. A physical linkage between cystic fibrosis airway surface dehydration and
34. Matthews LW, Spector S, Lemm J, Potter JL.Studies on pulmonary secretions. I. The over-all chemical composition of pulmonary secretions from patients with cystic fibrosis, bronchiectasis, and laryngectomy.Am Rev Respir Dis88: 199 –204, 1963.
35. Porterfield M, Zhao P, Han H, Cunningham J, Aoki K, Von Hoff DD, Demeure MJ, Pierce JM, Tiemeyer M, Wells L. Discrimination be-tween adenocarcinoma and normal pancreatic ductal fluid by proteomic and glycomic analysis.J Proteome Res13: 395–407, 2014. doi:10.1021/ pr400422g.
36. Radicioni G, Cao R, Carpenter J, Ford AA, Wang T, Li L, Kesimer M.The innate immune properties of airway mucosal surfaces are regu-lated by dynamic interactions between mucins and interacting proteins: the mucin interactome.Mucosal Immunol9: 1442–1454, 2016. doi:10.1038/ mi.2016.27.
37. Radtke T, Böni L, Bohnacker P, Fischer P, Benden C, Dressel H.The many ways sputum flows. Dealing with high within-subject variability in cystic fibrosis sputum rheology.Respir Physiol Neurobiol254: 36 –39, 2018. doi:10.1016/j.resp.2018.04.006.
38. Ramsey K, Radicioni G, Hill D, Ehre C, Button B, Alexis NE, Knowles M, Donaldson S, Kesimer M, McGuckin M, Boucher R. Airways Mucus Pathogenesis in Patients with Non-Cystic Fibrosis Bronchiectasis and Primary Ciliary Dyskinesia. Dallas, TX: American Thoracic Society, 2018, p. PA5049.
39. Raynal BDE, Hardingham TE, Thornton DJ, Sheehan JK. Concen-trated solutions of salivary MUC5B mucin do not replicate the gel-forming properties of saliva.Biochem J362: 289 –296, 2002. doi:10. 1042/bj3620289.
40. Round AN, Rigby NM, Garcia de la Torre A, Macierzanka A, Mills ENC, Mackie AR.Lamellar structures of MUC2-rich mucin: a potential role in governing the barrier and lubricating functions of intestinal mucus.
Biomacromolecules13: 3253–3261, 2012. doi:10.1021/bm301024x. 41. Rubin BK, Ramirez O, Zayas JG, Finegan B, King M.Collection and
analysis of respiratory mucus from subjects without lung disease.Am Rev Respir Dis141: 1040 –1043, 1990. doi:10.1164/ajrccm/141.4_Pt_1.1040.
42. Rubinstein M, Colby RH.Polymer Physics. Oxford, UK: Oxford Univ. Press, 2003.
43. Schnaar RL.Glycobiology simplified: diverse roles of glycan recog-nition in inflammation.J Leukoc Biol99: 825–838, 2016. doi:10.1189/ jlb.3RI0116-021R.
44. Schuster BS, Suk JS, Woodworth GF, Hanes J.Nanoparticle diffusion in respiratory mucus from humans without lung disease.Biomaterials34: 3439 –3446, 2013. doi:10.1016/j.biomaterials.2013.01.064.
45. Thornton DJ, Rousseau K, McGuckin MA.Structure and function of the polymeric mucins in airways mucus.Annu Rev Physiol70: 459 –486, 2008. doi:10.1146/annurev.physiol.70.113006.100702.
46. Varki A, Cummings RD, Aebi M, Packer NH, Seeberger PH, Esko JD, Stanley P, Hart G, Darvill A, Kinoshita T, Prestegard JJ, Schnaar RL, Freeze HH, Marth JD, Bertozzi CR, Etzler ME, Frank M, Vliegent-hart JFG, Lütteke T, Perez S, Bolton E, Rudd P, Paulson J, Kanehisa M, Toukach P, Aoki-Kinoshita KF, Dell A, Narimatsu H, York W, Taniguchi N, Kornfeld S.Symbol nomenclature for graphical represen-tations of glycans. Glycobiology 25: 1323–1324, 2015. doi:10.1093/ glycob/cwv091.
47. Wagner CE, Turner BS, Rubinstein M, McKinley GH, Ribbeck K. A rheological study of the association and dynamics of MUC5AC gels.
Biomacromolecules 18: 3654 –3664, 2017. doi:10.1021/acs.biomac. 7b00809.
48. Waigh TA.Advances in the microrheology of complex fluids.Rep Prog Phys79: 074601, 2016. doi:10.1088/0034-4885/79/7/074601.