www.ijemst.com
Constructed-Response as an Alternative
to Interviews in Conceptual Change
Studies: Students’ Explanations of Force
Sharon Price Schleigh1, Douglas B. Clark2, Muhsin Menekse3
1 East Carolina University 2
Vanderbilt University
3 University of Pittsburgh
To cite this article:
Schleigh, S.P., Clark, D.B., & Menekse, M. (2015). Constructed-response as an alternative
to interviews in conceptual change studies: Students’ explanations of force.
International
Journal of Education in Mathematics, Science and Technology, 3
(1), 14-36.
This article may be used for research, teaching, and private study purposes.
Any substantial or systematic reproduction, redistribution, reselling, loan, sub-licensing,
systematic supply, or distribution in any form to anyone is expressly forbidden.
Authors alone are responsible for the contents of their articles. The journal owns the
copyright of the articles.
Volume 3, Number 1, January 2015, Page 14-36
ISSN: 2147-611X
Constructed-Response as an Alternative to Interviews in Conceptual
Change Studies: Students’ Explanations of Force
Sharon Price Schleigh1*, Douglas B. Clark1, Muhsin Menekse3 1East Carolina University
2
Vanderbilt University
3University of Pittsburgh
Abstract
Although interview formats support rich data collection in conceptual change studies, interview formats limit sample sizes. This study explores the possibility of using constructed-response formats as an alternative or supplement for collecting similarly rich data across larger pools of subjects in conceptual change studies. While research in physics education has successfully employed a variety of constructed-response formats to explore important questions, less research has explored the comparability and interchangeability of the data collected through constructed-response and interview formats. The current study compares analyses of data collected using both constructed-response and interview formats across a common pool of subjects. At its core, the current study explores the degree to which the data sets collected through the constructed-response and interview formats support similar inferences when coded with the rubrics from a recent series of studies on knowledge structure coherence. The results suggest that larger samples of students can be analyzed using the constructed-response format for this type of study. Future research is recommended to explore minor but significant differences that were detected in terms of tertiary variables that contribute to the focal outcome variables.
Key words: Conceptual change, Assessment, Science education.
Introduction
Like the traditional sciences, educational research must have commonly identified and accepted tools of measure that can be recognized as both valid and reliable if the work in educational research is to be taken seriously as a science (Scriven, 2001). The difficulty is that measurements of knowledge are not always as clear and consistent as the measurements in some other scientific disciplines; partly because what people learn and how they learn is dynamic and sometimes unpredictable (Rennie, 2007; National Research Council, 2005). For that reason, measurements of knowledge often appear more arbitrary than measurements conducted in other disciplines of science.
Many cognitive studies have evaluated students’ understandings of science and examined their misconceptions in recent years, but less research has focused on developing and evaluating valid and reliable instruments that measure students' scientific knowledge (Nehm & Schonfeld, 2008; Treagust & Duit, 2009). Despite the growing concerns in the assessment and evaluation community, attention to the instruments and methods of data collection related to measurement of knowledge and conceptual understanding are not addressed in studies that attempt to generate generalizability (Nehm et al., 2010). Conceptual development studies usually rely on data collected through the traditional written tests and occasional think-aloud protocols (Treagust & Duit, 2009), while conceptual change studies often utilize multiple choice designed concept inventories for data collection (e.g., Halloun & Hestenes, 1985; Hestenes et al., 2011; Steif & Hansen, 2013; Miller et al., 2011) or interview formats (e.g., Clark, D’Angelo, & Schleigh, 2011; Davis, 2001; Posner & Gertzog, 1982; diSessa, 2006; Rioedan, 2012).
A concept inventory designed as a multiple choice assessment format is certainly easier to administer and to score, allowing much larger populations of participants in the studies to be evaluated for conceptual understanding. However, interviews can often support richer data collection, and have been shown to uncover
*
deep-seated misconceptions that might not have otherwise been detected through multiple-choice formats (Schneps, Sadler, Woll, & Crouse, 1989). The fine grain size of conceptual ideas and structures can be difficult to explore with multiple choice assessments (Nehm and Ha, 2011). However, interviews are harder to score reliably and are much more labor and time intensive to administer and score. The sample sizes of such studies are often small as a result, which creates challenges for estimating the broad generalizability of the findings to larger populations (Bryman, 2008). The nature of the coding makes the measurement difficult in terms of reliability, which further impedes opportunities to identify and generalize results (Nehm et al., 2010).
Research in science education and physics education has successfully employed a variety of constructed-response formats to explore important questions (e.g., Heckler, 2010; Vokos, Shaffer, Ambrose, & McDermott, 2000). There have been few studies that explore the comparability and interchangeability of the data collected between multiple choice and interview formats in science education research, and even fewer that have compared the results between constructed-response and interview assessment formats in science education research. The current study explores the possibility of using constructed-response formats as an alternative or supplement for interview across larger pools of subjects. More specifically, this study compares analyses of data collected using both constructed-response and interview formats across a common pool of subjects.
The instruments are based on the methods employed in a recent series of conceptual change studies exploring knowledge structure coherence by Ioannides and Vosniadou (2002), diSessa, Gillespie, and Esterly (2004), Clark, Schleigh, D'Angelo, Ozdemir, Menekse, et al. (2008), and Özdemir & Clark (2009). The current study compares the inferences supported by analyses of data collected through constructed-response and interview formats in terms of overall similarity, in terms of possible biases, and in terms of implications for the recent series of conceptual change studies on knowledge structure coherence. Thus the study aims to enhance our understanding of constructed-response formats for conceptual change research generally as well as to enhance our understanding of the ongoing series of studies exploring students’ knowledge structure coherence.
Importance and Focus of the Current Study
There remains a need to design valid and reliable assessments that can identify and evaluate the conceptual understandings of various populations; that can be administered to larger populations in a more cost effective manner; and can be used to develop generalizable claims about conceptual knowledge. Current conceptual change studies that have relied on the interview format of assessment leave room for speculation. Do the findings of a study, for example, only apply to students at the school from which the interview participants were drawn? Do the findings apply more broadly to regional or even national scales? Less cost-intensive methods for data collection would allow researchers to address these questions if the methods could collect data that were rich and unbiased enough for the purposes of the research. The current study explores the potential of a constructed-response format to fill such a role. A recent series of studies exploring knowledge structure coherence provides a good example of the need for a less cost-intensive constructed-response format for data collection. The current study collects data using both the interview format from these studies as well as a parallel constructed-response format across a shared subject pool in a counter-balanced design. The original series of studies thus provides a context for exploring the questions and methods at the heart of the current study in terms of data collection formats.
Comparability of Interview and Constructed-Response Formats for Conceptual Change Research
assessment, the students’ understanding can be discriminated between high and low integration ability more effectively than a multiple-choice assessment (Lee, Liu, & Linn, 2011).
As previously mentioned, many empirical cognitive change studies have focused on interview formats to explore how students think about concepts in science (e.g., Clark et al., 2008, 2011; diSessa et al., 2004; Özdemir, 2009; Ioannides & Vosniadou, 2002; McCloskey, 1983; Schleigh, 2009). Interviews are also often used in research to examine how people understand social cultural issues and relationships, or to assess language development (van Lier, 1989). In these applications, it is well known that the use of the interview as an instrument is problematic in confirming validity or reliability because of the influence of the interviewer (Desimone & Le Floch, 2004; Holbrook, Green & Krosnick, 2003). Ioannides and Vosniadou (2002), diSessa et al. (2004), Özdemir. & Clark, (2009), and Clark, D’Angelo, & Schleigh, (2011) do not purposefully focus on social norms, relationships, language development, or other politically-loaded or socially-loaded questions. Rather, the questions are about interpreting physics phenomena in the context of force and motion. In these studies, interviews elicit student knowledge by asking questions to clarify initial or confusing responses. It is possible, however, that the interviewer might unintentionally impact interviewee responses even in this relatively less emotionally-charged context (Fontana & Frey 2000; Silverman, 2000, 2006; Harris & Brown, 2010). Essentially, the interviewer might potentially influence the responses of the interviewee by inadvertently creating a social relationship based on factors such as class, status, power differential, or gender with the interviewee (Lenski & Leggett, 1960). Previous unexamined assumptions along the lines that science is culture-free have proven problematic and naïve (e.g., Calabrese Barton, 2002; García, & Lee, 2008; Lee, 2003) and thus warrant closer examination in the current context.
Written assessments may offer an alternative to the interview assessments. Written surveys designed as constructed responses can parallel verbal structured interviews in allowing an exchange of communication among two or more people with intent to find an answer to a specific question (Fleming, 1986) while potentially lessening the direct impact of the interviewer (Oei & Zwart, 1986). Although stereotype threat is a serious issue across all manner of data collection and assessment (e.g., Steele, 2010), potential biases in written assessments are potentially less subject to administrator influences than interviews (Desimone & Le Floch, 2004).
Different forms of assessments can be made comparable if the scoring criteria remain the same and the scoring is applied in the same manner even if the actual tasks or interactions are changed (Baldwin, Fowles, & Livingston, 2005). Similar to interview assessments and unlike multiple choice assessments, a constructed response assessment allows participants to include evidence, arrange arguments, take purposeful action to address a problem (Wiggins, 1989), and allow responses to include reasoned analysis (Popham & Popham, 2005). Using preselected responses from which to compare or develop scoring criteria and using the same scorers for the different formats of the assessments helps to make the scoring of constructed-response assessments more consistent and therefore more reliable in terms of inter-rater reliability. To develop a strong score-equating approach and to confirm that the two different formats are comparable requires data that link test takers’ performances on the different assessment formats. One method of design is the administration of two forms of assessments to the same test takers, arranging for half of the participants to complete one format first while the other half completes the second format first (a counter-balanced design). In this design of assessment comparability, the results have been found to be highly accurate without requiring large numbers of participants if the assessments are scored with the same criteria, by the same scorers, in the same manner (Baldwin, Fowles, & Livingston, 2005). In considering the comparability of the assessments it is also important to identify the influence of students’ preference of assessment formats (Baldwin, Fowles, & Livingston, 2005).
A constructed-response format might thus provide many affordances and seems promising for multiple reasons. Constructed-response assessments (largely) remove the interviewer from the interpersonal interactions. Constructed-response assessments also facilitate administration to large groups at the same time, do not require special training for implementation, reduce transcription requirements, and simplify Institutional Review Board (IRB) concerns. Constructed-response assessments could significantly augment current research on knowledge structure coherence and conceptual understandings if they can collect data that is functionally similar to that collected in the interview format (i.e., if application of the intended coding rubrics to both data sets support similar findings).
simplifying the amount of reading and writing a student has to do (e.g., including “yes or no” responses that can be circled). However, the simplification in itself can add to the bias when the responses are scored. Subjectivity is eminent when a question is left blank or the response is too short (Brown & Hudson, 1998). Speaking is a faster form of communication (as is listening) while reading is slower. Writing is the slowest form of communication (Chafe, 1982). This difference between data collection formats could influence the results through multiple pathways. Students would have more time, for example, to synthesize their ideas and to consider their answers when writing. In addition, students may use more effort in their responses on a constructed-response assessment if they perceive that format as being an "official" assessment because written formats are more common in schools than interviews (Hickson, Reed, & Sander, 2010; Tang, 1992). Alternatively, students may be unwilling or unmotivated to provide detailed enough answers in the written format, interfering with researchers' ability to comprehensively code their ideas and knowledge (Harlen & Crick, 2002).
The purpose of exploring the constructed-response format as an alternative in the current study is not just to produce and elicit responses; the purpose involves identifying students' reasoning in enough depth to allow coding of the data through the same rubrics and methods intended for use with the interview data in the original series of studies. This means that the instruments need to be comparable enough such that the data collected by each format will support the same inferences through the application of the coding rubrics, even though the very natures of the modes of data collection involve distinctions that can make direct comparison difficult (Gray & Sharp, 2001). If the two formats in the current study result in the collection and coding of data that provide similar results, this study would provide support of a method with which to collect data from larger sample populations, allowing for more robust investigations into conceptual change and knowledge structure studies.
Overview of the Series of Knowledge Structure Coherence Studies Upon Which the Current Study Builds
Ioannides and Vosniadou (2002) conducted the foundational study in Greece that gave rise to a series of quasi-replication studies exploring the consistency of the force meanings that students of different ages express in their explanations across contexts. Ioannides and Vosniadou employed an interview format to collect their data. Ioannides and Vosniadou’s goal was to explore the fundamental debate in the conceptual change literature regarding the degree to which students’ scientific understandings are coherent, unified schemes of theory-like character (e.g., Carey, 2000; Gopnik & Schulz, 2004;) versus ecologies of quasi-independent elements (e.g., Clark, 2006; diSessa, 1983, 1993; Linn, 2006).
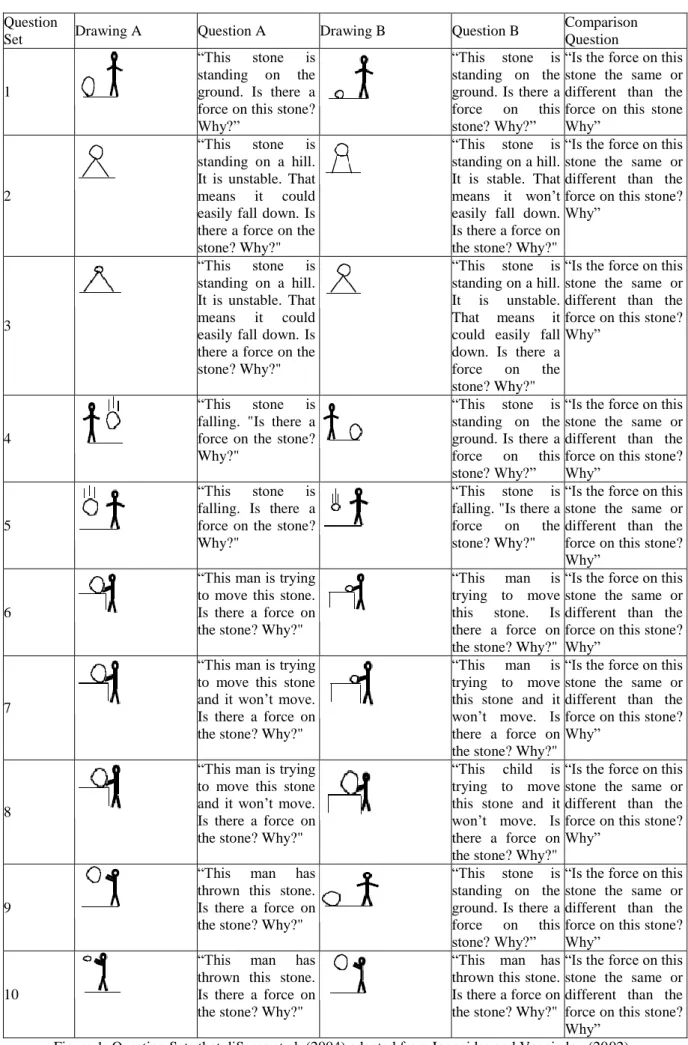
Ioannides and Vosniadou encouraged diSessa to conduct a similar study in the United States. diSessa et al. (2004) condensed and reorganized Ioannides and Vosniadou's (2002) question sets into ten question sets that each involved two simple yes/no questions and one comparison question (Fig 1) administered in an interview format. The questions involved the same figures used by Ioannides and Vosniadou, but reorganized the question sets so that each set included a comparison question. As with Ioannides and Vosniadou, the simple questions directly asked whether or not there is a force on a specified stone in each of the pictures. The comparison question was asked if the student’s explanations indicated the existence of forces in both pictures to elicit the student’s ideas about a comparison of the forces between the stones in both pictures. In addition to reorganizing and condensing the question sets, diSessa et al. also revised the coding approach in a manner that they felt they could apply more reliably.
Question
Set Drawing A Question A Drawing B Question B
Comparison Question
1
“This stone is standing on the ground. Is there a force on this stone? Why?”
“This stone is standing on the ground. Is there a force on this stone? Why?”
“Is the force on this stone the same or different than the force on this stone Why”
2
“This stone is standing on a hill. It is unstable. That means it could easily fall down. Is there a force on the stone? Why?"
“This stone is standing on a hill. It is stable. That means it won’t easily fall down. Is there a force on the stone? Why?"
“Is the force on this stone the same or different than the force on this stone? Why”
3
“This stone is standing on a hill. It is unstable. That means it could easily fall down. Is there a force on the stone? Why?"
“This stone is standing on a hill. It is unstable. That means it could easily fall down. Is there a force on the stone? Why?"
“Is the force on this stone the same or different than the force on this stone? Why”
4
“This stone is falling. "Is there a force on the stone? Why?"
“This stone is standing on the ground. Is there a force on this stone? Why?”
“Is the force on this stone the same or different than the force on this stone? Why”
5
“This stone is falling. Is there a force on the stone? Why?"
“This stone is falling. "Is there a force on the stone? Why?"
“Is the force on this stone the same or different than the force on this stone? Why”
6
“This man is trying to move this stone. Is there a force on the stone? Why?"
“This man is trying to move this stone. Is there a force on the stone? Why?"
“Is the force on this stone the same or different than the force on this stone? Why”
7
“This man is trying to move this stone and it won’t move. Is there a force on the stone? Why?"
“This man is trying to move this stone and it won’t move. Is there a force on the stone? Why?"
“Is the force on this stone the same or different than the force on this stone? Why”
8
“This man is trying to move this stone and it won’t move. Is there a force on the stone? Why?"
“This child is trying to move this stone and it won’t move. Is there a force on the stone? Why?"
“Is the force on this stone the same or different than the force on this stone? Why”
9
“This man has thrown this stone. Is there a force on the stone? Why?"
“This stone is standing on the ground. Is there a force on this stone? Why?”
“Is the force on this stone the same or different than the force on this stone? Why”
10
“This man has thrown this stone. Is there a force on the stone? Why?"
“This man has thrown this stone. Is there a force on the stone? Why?"
“Is the force on this stone the same or different than the force on this stone? Why”
Clark, D’Angelo, & Schleigh (2011) further explored the potential contributions of differences in coding schemes and differences in sample student populations from five countries (Mexico, China, the Philippines, the U.S., and a new cohort from a different city in Turkey) using the same grade levels, consolidated question sets, and coding schemes. Selecting student samples from multiple countries was deemed important to explore because (a) semantic and cultural differences have been shown to impact students’ thinking about specific science concepts (Inagaki & Hatano, 2002) and (b) other differences in educational systems and schools might also likely contribute to differences in outcomes between student populations. Clark, D’Angelo & Schleigh (2011) demonstrated that differences in coding schemes seemed unlikely to account for the differences in the findings of the original studies. The analyses did however demonstrate some differences in terms of consistency and meanings that might result from language, culture, or educational systems.
Influenced by this ongoing series of studies and other research, current iterations of framework-theory and knowledge-in-pieces perspectives have evolved to share similarities in their explicit prediction of fragmentation and coherence (Brown & Hammer, 2008; Clark, D’Angelo, & Schleigh, 2011; Clark & Linn, 2013; Vosniadou, 2013). The distinctions between current framework-theory and knowledge-in-pieces perspectives now focus on (a) the specific nature of the knowledge elements that apply high magnitudes of influence on other elements in the conceptual ecologies and (b) the processes through which stabilities evolve and change across conceptual ecologies.
The variations in findings and small sample sizes across the previous studies, however, complicate these efforts toward developing a shared model because (a) the researchers have been working with data sets that support different conclusions and (b) the models need to be able to account for these variations in findings in terms of the factors and mechanisms that contribute to increased or decreased levels of consistency exhibited by students in their explanations of force. Thus it remains important to better understand the sources of the variation observed (a) across studies, (b) across countries, and (c) across U.S. samples across studies. The prior studies compared students in different countries, but were each conducted within a single city in each country, often within a single school. Are there indeed differences at the relatively national levels (such as country, language, or national educational system) or are the differences the result of more local variables (such as differences at the level of local school systems or even individual schools)?
Furthermore, Clark, D’Angelo, & Schleigh (2011) also suggested that differences unconsciously introduced by the interviewers themselves may have contributed to the differences in terms of the epistemic resources cued by the framing of the interviews (cf., Rosenberg, Hammer, & Phelan, 2006). Clark, D’Angelo & Schleigh (2011) therefore suggested examination of alternatives for data collection in future studies in terms of (a) the pragmatic limitations that accompany interview assessment formats in terms of sample size and (b) the potential unintentional impacts of the interviewers in the data collection process.
Potential for Biases Across Different Forms of Assessment
In addition to the potential for different formats to affect the overall inferences drawn from the collected data, there is also the potential for bias. The literature is filled with studies and reviews exploring how specific groups compare in various assessments. It is well known that a given assessment format may assess subjects differently across segments of the sampled population (NRC, 2005). Prominent divisions from an educational perspective include daily experiences, gender, race, language proficiencies, culture, and socio-economic background. It is often assumed that the assessments have somehow filtered those who know from those who don’t know when in fact it may be the inherent biases of the assessments that create the differentiation (Gray & Sharp, 2001; Moskal & Leydons, 2000).
claim that girls think differently than boys (e.g., Halpern, Benbow, Geary, Gur, Hyde & Gernsbacher, 2007). Leading educational and equity researchers argue that this is not evidence of biological differences but an indication of the impact of cultural influences, the design of the tests, biases in assessment formats, and the opportunities for learning and engagement (e.g., Calabrese Barton, 2002; Linn & Hyde, 1989; Shakeshaft, 1995). The current study could shed some light on some of the concerns for gender bias in assessments as a result of the assessment format and the assessment preference. This could be evaluated by examining the interactions that boys and girls have in terms of their explanations in both the written and the verbal assessment formats, their interactions with the assessment formats in terms of completing the tasks, and their expressed preferences for the assessment formats.
In terms of format-preference biases, the current study examines the potential relationship between students' preferences for assessment formats and how the students are measured by the formats. Students’ perceptions about the classroom environment, including the means and methods of assessing them, should be taken into account when conducting research in what students know and what they learn (Fraser, 2007; Harlen & Crick, 2002; Wiggins et al., 2005). If a student responds differentially across assessments, it may be because the student prefers one assessment format over another (Parmenter, 2009). Related to this, students’ perceptions of different formats can also influence the nature of the data collected. Students like their point of view and their opinions to count in an assessment. Tang (1992) conducted a study comparing how students performed between interview and constructed-response formats. In her study, Tang examined students' perceptions of different formats and how those perceptions influenced their responses. Tang reported an association between different perceptions of tests and assignment demands and the adoption of different preparation and response strategies. Students perceived, for example, that one form of assessment called for deeper responses than another form. The interview format was perceived as requiring students to answer more deeply in contrast to the constructed-response assessment, which was perceived as a surface assessment, where students could use rote recall and reproduction of information responses to answer the questions. Hickson et al. (2010) similarly found that students prepared for assessments with different degrees of effort based on their perception of the assessment format. These studies suggest that assessment formats may involve inherent biases based on students’ perceptions of the assessment format. We therefore check our data for such biases, although we acknowledge that our sample size is only sufficient to detect biases with large effect sizes.
Summary of Research Questions for the Current Study
Our research explores four primary questions regarding constructed-response and interview formats for data collection in conceptual change studies. This investigation is focused on the knowledge structure coherence studies that provide the context for the current study.
1. Do the data sets collected through the constructed-response and interview formats support similar inferences when coded using the rubrics developed by diSessa et al. (2004)?
2. Do the inferences drawn from the data sets suggest potential gender differences or biases within or across the formats in terms of consistency or force meanings?
3. Do the inferences drawn from the data sets suggest potential format preference differences or biases within or across the formats in terms of consistency or force meanings?
4. What are the implications of the analyses for our understanding of knowledge structure coherence more generally?
If the findings in terms of these questions are encouraging, future research could build upon these findings to refine the constructed-response format and examine it in terms of other sources of potential bias. Such a process could vet the constructed-response format as a companion format to support and triangulate the interview format's depth with the increased potential breadth of administration enabled by the constructed-response format. A coordinated approach for enabling both depth and breadth in data collection would support conceptual change research across larger groups of students, and thus allow more thorough examination and disentanglement of the role of complex characteristics such as a national educational system, culture, language, and socio-economic status from more local variables.
Method
collection, and procedures for data analysis. When we refer to the original series of studies in the following sections, we refer to Ioannides and Vosniadou (2002), diSessa et al. (2004), Özdemir & Clark (2009), and Clark, D’Angelo & Schleigh (2011).
Subjects
A total of 47 students (25 girls and 22 boys) participated in this study. Two students were dropped from the data sample, however, because they completed only one of the two formats. Students came from the same public school in a large urban city in the southwestern U.S. The students were between 13 and 15 years of age, and were from three different sections of an introductory science course (Science Investigation Class) with the same teacher. These classes were neither remedial nor honors. This age group was chosen because (a) older students in the previous studies were mostly placed in the “gravity and other” meaning category (which would provide little variation in coding between students to explore comparisons between formats) and (b) younger students would be limited in their ability to express their ideas in writing (which would limit data collection). All students were native English speakers in light of the literacy requirements involved with the constructed-response format and the focus of the previous studies on native speakers from each country to facilitate comparisons across countries. The total enrollment for the school from which the students attended is approximately three thousand. The Department of Education reports the student body demographics as 43% White students, 40% Hispanic students, 8% African American students, 7% of Asian/Pacific Islanders, and 1% American Indian/Alaskan students, with 26% of the school population eligible for the free or reduced lunch program.
Procedures for data collection
Both the interview format (Figure 1) and the constructed-response format (Figure 2) were administered to all students in a counter-balanced design. Half of the boys and half of the girls completed the interview format first and then completed the constructed-response format second. The other half of the boys and the other half of the girls completed the constructed-response format first and the interview format second. Students were randomly selected to determine which format they would complete first. Prior to administering the formats, students were told as a class that they would be completing two formats that would allow them an opportunity to demonstrate their understanding of forces in two different ways (formats). The formats were administered on different days over a three-week period. After students completed one form, they were given the second format to complete approximately one week later. The time it took to complete each format was recorded. After completing both formats, students were asked which format they preferred and why.
1. Set 1- A big stone on the ground vs. a small stone standing on the ground. A. This stone is standing on the ground. Is there a force on this stone? Yes or No
Explain why you think there is/is not a force.
If there is a force, where does the force come from or what kind of force is it?
B. This stone is standing on the ground. Is there a force on this stone? YES or NO
Explain why you think there is/is not a force.
If there is a force, where does the force come from or what kind of force is it?
C. If either stone in A or B do not have a force, skip this question.
If both stones have a force, compare the forces on the stones. Do they have the same type of force? Do they have the same amount of force? If not, which one has more? Explain your answers.
Interview format. The interviews were all videotaped and included the same ten question sets (Figure 1) employed by diSessa et al. (2004), Clark et al. (2008), Schleigh (2009), Özdemir & Clark (2009), and Clark, D’Angelo & Schleigh (2011) that diSessa et al. distilled from Ioannides and Vosniadou's (2002) larger set of questions. For each question set:
1. The student was first asked if there was a force on the stone in the first image. 2. The student was then asked to explain his/her answer.
3. The student was then asked if there was a force on the stone in the second image. 4. The student was then asked to explain his/her answer.
5. If a student responded that there were forces on the stones in both images, the student was then asked to compare the forces (by amounts, types, or both depending on the response to the 1st – 4th questions in the question set).
When students’ responses were contradictory or did not make sense, questions were repeated and students' explanations were probed to ensure that the interviewer understood the responses. The order of the question sets was the same for all students. Students were allowed to take their time and expand on their answers. Individual interviews typically lasted 15 minutes with some lasting up to 60 minutes. The total time for each student was recorded for each assessment format.
Constructed-response format. The constructed-response format involved a paper and pencil instrument addressing the same ten question sets (e.g. Figure 2). Students were given an initial introduction and instructions on how to proceed. They were told that each question would ask them to circle “yes” or “no” about whether there was a force involved in each image and that they should then explain why there was or was not a force. The students were told that they should answer section C (comparing the forces between A and B) only if they answered “yes” in both sections A and B–otherwise they could skip section C. Once instructions were given, the time was recorded when each student began working on the constructed-response format and again when each student completed this format. There were no further interactions with the students while they completed the constructed-response format.
Procedures for data analysis
This section details the procedures for the quantitative analysis in terms of coding schemes, inter-rater reliability, coding responses, and coding procedures.
Coding Scheme. The current study employs the coding scheme used by diSessa et al. (2004), Clark et al. (2008, 2014) Clark, D’Angelo, & Schleigh ( 2011), and Özdemir & Clark (2009) that diSessa et al. distilled from Ioannides and Vosniadou's (2002) coding scheme. Clark, D’Angelo & Schleigh (2011) employed the coding schemes of both Ioannides and Vosniadou and diSessa et al. to determine the degree to which the choice of coding scheme might impact the levels of consistency attributed to students in the original studies. Clark et al. found that the two coding schemes resulted in very similar coding of students. The current study, therefore, chose to employ only the diSessa et al. coding scheme to streamline the coding process.
The coding scheme was designed to identify the possible underlying meanings of force intended by the students in their explanations in terms of seven meanings of force from Ioannides and Vosniadou (2002). It is important to note that the current study adopted this framework to allow comparison across studies. This decision obviously involves tradeoffs. On the one hand, creating a new coding scheme could allow us to adjust for any shortcomings of the original coding schemes. On the other hand, however, by adopting the coding scheme we facilitate comparisons across multiple studies. For the purposes of the current study, we chose the latter route and adopted the existing coding scheme and force meanings. These seven force meanings are as follows:
1. Internal force: Students’ responses indicate that there is a force related to the size or weight of an object rather than an object’s motion or an outside agent.
2. Internal force affected by movement: Students’ responses indicate that there is a force related to the size and weight of an object as well as the motion of the object.
3. Internal force and acquired force: Students’ responses indicate that there is a force related to the size and weight and that the objects acquired additional force when they were moved or the objects had a force because of motion and the amount of force was related to the size or weight.
5. Acquired force and force of push/pull: Students’ responses include the meaning for the acquired force and indicate that even if the object wasn’t moving there is still a force if an agent is pushing or pulling the object.
6. Force of push/pull: Students’ responses indicate that there is a force on an object only if there is an agent pushing or pulling the object regardless of whether there is motion or not. Students that include gravity as the agent were not coded in this category.
7. Force of gravity and other forces: Students that use the term gravity, describe a closely acceptable definition or application of gravity, or include a force from the ground are coded in this category. This is a modification from the previous studies as students were expected to confirm an understanding of the concept to some degree or to use the term in order to be coded for this category.
The coding scheme involves applying a set of "if/then" logic rules exemplified for Question Set 1 in Table 1. The scheme, designed by diSessa et al. (2004), includes all Ioannides and Vosniadou’s meanings and specific codes. More specifically, the diSessa et al. scheme compared students’ responses to expected patterns for the force meanings at the “coarse quantitative” level by comparing combinations of the existence, absence, and relative sizes of forces on each object. In addition, potential exemptions based on the inclusion of specific sources of force expressed by the students were considered in determining how to code the students’ responses. A complete overview of the coding procedure is outlined in Clark, D’Angelo & Schleigh (2011).
For example, let us assume a student answered, "There is a force on the stone [in the first image] because it is big and heavy," and "there is no force on the stone [in the second image] because it is little." The student would not be asked the comparison question because he or she did not specify a force on both stones. This student would be coded in the rubric as matching for each of the first three meanings: internal, internal/movement, and internal/acquired.
As another example, assume that a student answered, "There is a force on the stone [in the first image] because gravity pulls it down," and "there is a force on the stone [in the second image] because gravity pulls it down." The student would then be asked the comparison question. Let us assume that the student answered, “there is a bigger force of gravity [on the first stone] because it has more mass." The student would be coded as matching for gravity and other because of the second set of rules listed for gravity and other in the rubric. The student would not be coded as matching for internal, internal/movement, and internal/acquired because the student included "gravity" in the explanation even though the basic answer of "force on both stones but greater force on the big stone" would otherwise qualify the student as matching for these other three meanings.
Coding and Inter-rater Reliability. The coding consisted of marking the data cells for each question for each possible force meaning as "yes" or "no" in terms of whether or not the coding scheme specified that meaning as a match for the student's explanation for that question set. This involved marking a total of seventy cells for each student for each format (ten question sets multiplied by seven possible force meanings per question set for each format). As discussed above, students could be coded as potentially matching more than one meaning for each question.
After coding all of the ten question sets for a student, the number of times that the student matched for each of the seven force meanings was counted across the 10 question sets (for a total of 0 to 10 matches per force meaning). The force meaning for which a student most frequently matched was recorded as the student’s best-match meaning. Sometimes this meant having a best-best-match meaning that best-matched on as few as three question sets or as many as all ten question sets. In addition, students could be coded for more than one best-match meaning. If the highest number of matches tied for more than one meaning category, then the student was coded for all of those meanings and was identified as having multiple best-match meanings.
We next coded the students in terms of consistency with which they expressed the same force meaning across question sets. If a student's best-match meaning matched across all ten question sets, that student was coded as "fully consistent." If a student's best-match meaning matched across at least eight of the ten question sets, that student was coded as “consistent with allowance.”
The first author coded all of the assessments for all students. The coding was conducted using the written forms for the constructed-response format and the videotapes for the interview format. To establish inter-rater reliability, another coder from the Clark, D’Angelo & Schleigh (2011) study coded 20% of the students for both formats. The inter-rater reliability for the two coders was calculated on the percentage of matched coding cells for each format for each student. The agreement rate for the interview format was 96% and the inter-rater reliability for the constructed-response format was 95%.
Result and Discussion
Following is our analysis of the four core research questions for this study. We also discuss the limitations of the current study, future directions for research, and the implications for research on conceptual change. Table 2 provides a useful summary of the five dependent variables in the analyses.
Question 1: Overall Comparison of Formats In Terms of Consistency and Meanings
Do the data sets collected through the constructed-response and interview formats support similar inferences when coded using the rubrics developed by diSessa et al. (2004)?
Table 2. Summary of Dependent Variables (Coding Terms) Used in Analysis.
Fully Consistent Code: A focal outcome variable for consistency highlighting whether or not a student matched for the same force meaning on all 10 questions set (e.g., if a student matched for “internal” on all ten question sets, that student was coded as ‘fully consistent”. Note that the specific force meaning does not matter. Only that the student matched the same meaning for all ten question sets.
Consistent With Allowance Code: A focal outcome variable for consistency highlighting whether or not a student matched for the same force meaning on at least 8 of the 10 questions sets (e.g., if a student matched for “push-pull” on 8, 9, or 10 of the question sets, that student was coded as “consistent with allowance”). Note that the specific force meaning does not matter. Only that the student matched the same meaning for eight, nine, or ten of the question sets.
Best-Match Score: The tertiary variable underlying the fully consistent and consistent with allowance codes. Best-match score is a measure of consistency highlighting the number of question sets the student matched for a best match meaning (e.g., “7”).
Best-Match Meaning: The focal outcome variable for expressed force meanings. A student's best-match meaning is the force meaning category for which that student matched for the most question sets (e.g., push-pull). Note that the best match meaning for a given student may have a best match score that is lower than the threshold for being coded as consistent.
Multiple Best-Match Meaning: The focal outcome variable for expressed force meanings. A student's best-match meaning is “tied” in more than one force meaning category for which that student matched for the most question sets (e.g., a student that has the highest equal matches in push-pull, acquired push-pull, and internal would be coded for best-match meanings in all three meaning categories). Note that the best match meaning for a given student may have a best match score that is lower than the threshold for being coded as consistent.
Force-Meaning Scores: The tertiary variables underlying the determination of match meaning and best-match score. The force meaning scores for a student are the numbers of question sets (between 0-10) for which a student matched for each of the seven force meanings (e.g., “7, 8, 4, 2, 2, 1, 6”). This array of seven numbers therefore represents the student’s number of matches for each of the seven force meanings and is used for analyses comparing students’ matches across the seven meanings.
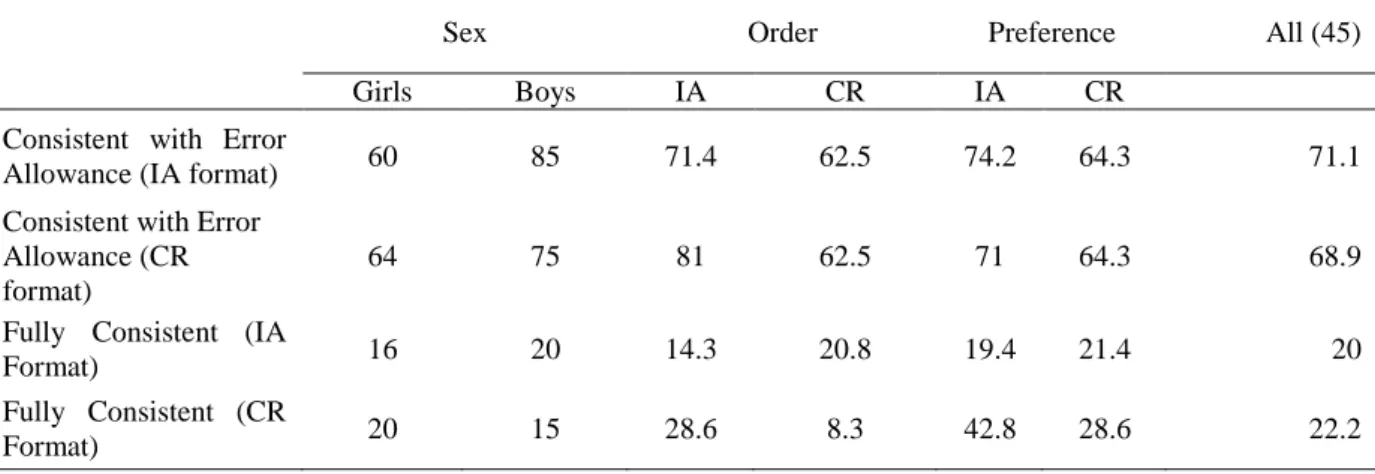
Student's Consistency of Force Meanings. These analyses explore the degree to which the data sets, collected through the two formats, code students similarly in terms of the consistency of the force meanings that students express. As previously discussed, high consistency in expressing a force meaning is considered partial evidence for a coherent (although potentially non-normative) understanding of force (Ioannides & Vosniadou, 2002). Table 3 provides a summary of the percentages of students coded as consistent for both fully consistent and consistent with allowance criteria in the current study. Table 3 also provides a breakdown of the number of students coded as consistent by gender and format preference in both assessment formats. The results of the current study show that 20% of the students in the interview format were coded as fully consistent while 22% of the students were coded for fully consistent in the constructed-response format. A Yates chi-squared contingency analysis shows that this difference is not significant. Using the “consistent with allowance” criterion, 71% of the students overall were coded as being consistent in the interview format, and 69% of the students were coded as being consistent in the constructed-response format. A chi-squared contingency analysis shows that this difference is not significant. These findings suggest (a) that the two assessments assess similar levels of consistency for this student population for both consistency criteria and (b) that these students demonstrate relatively low levels of consistency using the “full consistency” criterion.
Table 3. Percentages of students who are consistent with allowance or fully consistent for each format by gender, order of administration, format preference, and overall.
Sex Order Preference All (45)
Girls Boys IA CR IA CR
Consistent with Error
Allowance (IA format) 60 85 71.4 62.5 74.2 64.3 71.1
Consistent with Error Allowance (CR format)
64 75 81 62.5 71 64.3 68.9
Fully Consistent (IA
Format) 16 20 14.3 20.8 19.4 21.4 20
Fully Consistent (CR
Format) 20 15 28.6 8.3 42.8 28.6 22.2
Finally, to compare consistency at a more granular level, we conducted a one-way within subjects ANOVA with the factor being format and the dependent variable being best-match score. While the consistency codes are the focal variables in terms of consistency, best-match score is the tertiary variable on which those codes are based, as described in Table 2 and the Methods section. Table 4 presents the means and standard deviations for best match scores for interview and constructed responses by gender and preferences. The results for this ANOVA also indicate no significant main effect for test format in terms of the best-match score underlying consistency coding.
Table 4. Means and Standard Deviations for Best match Scores for interview responses across force categories and the interaction of these categories with the students’ gender and format preference.
Sex Preference Mean Std. Deviation
Interview best match score
Male
Constructed 9.20 .83
Interview 8.60 1.55
Total 8.75 1.41
Female
Constructed 7.33 2.24
Interview 8.06 1.18
Total 7.80 1.63
Total
Constructed 8.00 2.04
Interview 8.32 1.38
Total 8.22 1.59
Constructed best match score
Male
Constructed 9.60 .55
Interview 7.93 1.67
Total 8.35 1.63
Female
Constructed 7.33 1.87
Interview 8.43 1.67
Total 8.04 1.79
Total
Constructed 8.14 1.87
Interview 8.19 1.66
Total 8.18 1.71
Students' Force Meanings. We now analyze the results, examining possible differences in terms of the best-match meanings across the two formats (i.e., the force meaning that best-matched the largest number of questions for a given student, coded as that student’s “best-match” meaning).
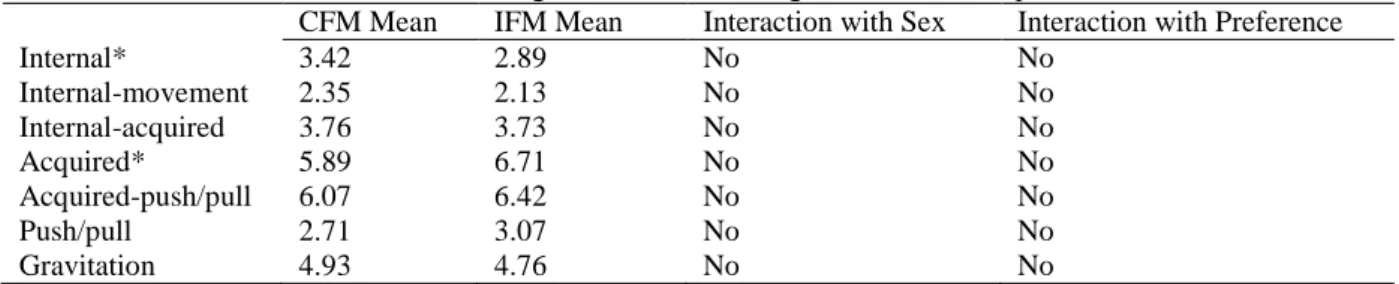
best-match meaning agreement between formats. To explore for possible differences in force meanings at a more granular level than best-match meaning, we next examined each student's force-meaning scores for each force meaning, independent of whether or not that force meaning was the student's best-match force meaning. While best-match meaning is the focal outcome variable in terms of student's apparent meanings of force, force-meaning scores are the tertiary variables that contribute to the determination of best-match force-meaning as described in Table 2 and the Methods section. Seven separate mixed design ANOVAs were conducted with test format as the within-subjects factor to evaluate the differences between the formats across force categories. Table 5 summarizes the results of these seven separate mixed design ANOVAs. Essentially, there are main effects for two of the seven meanings in terms of test format. The main effect of test format was significant for the internal force meaning with a mean force-meaning score of 3.4 for the constructed-response format and 2.9 for the interview format, F(1, 41) = 5.67 p = .02, η2 = .121. The main effect of test format was also significant for the acquired force meaning with a mean force-meaning score of 5.9 for the constructed-response format and 6.7 for the interview format, F(1, 41) = 5.62 p = .02, η2 = .12. The mixed design ANOVAs for the other five meanings did not demonstrate a main effect for format.
Table 5. Means for force meaning scores for constructed and interview responses across force categories and the interaction of these categories with students’ gender and format preference.
CFM Mean IFM Mean Interaction with Sex Interaction with Preference
Internal* 3.42 2.89 No No
Internal-movement 2.35 2.13 No No
Internal-acquired 3.76 3.73 No No
Acquired* 5.89 6.71 No No
Acquired-push/pull 6.07 6.42 No No
Push/pull 2.71 3.07 No No
Gravitation 4.93 4.76 No No
* donates significant main effect for the comparison between test formats for the particular force meanings category.
Finally, we conducted analyses to determine whether or not one format or the other elicited more information in a manner that resulted in students being coded for more meanings across the ten questions. It is possible, for example, that the interview format elicited more ideas from students across the questions, which in turn would result in the students being coded for a larger number of possible force meanings for those questions. At the highest level, we checked for this in terms of differences in the number of students displaying multiple best-match meanings in one format or the other. As discussed, it is possible for more than one force meaning to "tie" as a student's best-match meanings. The current study includes fifteen occasions of multiple best-match meanings out of a possible ninety (i.e., forty-five students multiplied by two formats each). Ten of these were in the interview format and five were in the constructed-response format. Based on the results of a McNemar test of dependent proportions, these percentages were not significantly different from each other. To further check the possibility of one format eliciting more information in a manner that resulted in students being coded for more meanings across the ten questions, we compared the total number of possible meanings that students were coded for in each format. The maximum number of meanings for which a student could be coded for any question is 7 (the number of force meaning categories) multiplied by 10 (the number of questions) for a total possible of 70. The average total number of meanings elicited by the constructed-response format is 29.13 while the average total number of meanings elicited by the interview format was 20.71. This difference is not statistically significant. Thus, for the purposes of the coding schemes employed across the series of studies, there is not a statistically significant difference in the amount of information elicited between the two formats.
Summary of Overall Comparison of Formats. In terms of coding students for consistency of force meanings, the data sets collected through the constructed-response and interview formats support similar inferences when coded using the rubrics developed by diSessa, et al. (2004). There were no significant differences demonstrated between the two formats in terms of the fully consistent or consistent with allowance criteria, and there were no significant differences between formats in terms of the underlying best-match scores. There was also no significant effect for the order in which students completed the format on consistency. Thus, the formats appear to collect data that supports the same inferences regarding consistency of force meanings when coded using the rubrics developed by diSessa et al. (2004).
each student by each format. There were, however, significant differences for two of the seven force meanings (acquired and internal) in terms of the raw force-meaning scores collected for each student (the tertiary variables that contribute to the focal outcome variable). These differences are not large, however, and these differences have minimal effect in terms of overall coding of students. Only the force-meaning score for a student's best-match meaning (the student’s best-best-match score) is used to determine consistency or best-best-match meaning across the studies. Thus, while there are some differences that should be explored in future research, the data sets collected through the constructed-response and interview formats support similar inferences overall in terms of the best-match force meanings attributed to students when coded using the rubrics developed by diSessa et al. (2004).
Question 2:Comparison of Formats by Gender In Terms of Consistency and Meanings
Do the inferences drawn from the data sets suggest potential gender differences or biases within or across the formats in terms of consistency or force meanings?
Students’ Consistency of Force Meanings. These analyses explore the degree to which the data sets collected through the two formats code students similarly by gender in terms of the consistency of the force meanings that students express. As discussed in the literature review, there may be some effect on how the population of students is coded for consistency in knowledge structure coherence in terms of gender. The possibility of the impact of gender on knowledge structure coherence was analyzed with both the fully consistent and the consistent with allowance criterion levels using contingency 2x2 chi-squared analyses.
In terms of the fully consistent criterion, there were four girls (16%) coded as being fully consistent in the interview format and five girls (20%) in the constructed-response format, compared to the four boys (20%) who were coded fully consistent in the interview format and the three boys (15%) in the constructed-response format. A contingency chi-squared analysis shows that these differences are not significant. In terms of the consistent with allowance criterion, 15 girls (60%) were coded as being consistent with allowance in the interview format and 16 girls (64%) were coded as consistent with allowance in the constructed-response format, compared to the 17 boys (85%) who were coded as consistent with allowance in the interview format and the 15 boys (75%) who were coded as consistent with allowance in the constructed-response format.
Two-way contingency table analyses were conducted in order to evaluate whether students’ consistency varies by gender. Gender and full consistency scores were not significantly related for scores based on the constructed response format or the interview format. Gender and consistency with allowance codes were also not significantly related for scores based on the constructed response format or the interview format.
We then conducted a mixed design ANOVA for the best-match scores underlying the consistency codes with gender as a between-subjects factor and format as the within-subjects factor. While there was no main effect for test format (as described in the analyses of Question 1), there was a significant main effect for gender, F(1, 41) = 5.64 p = .02, η2 = .121, indicating that, overall, girls’ best-match scores were slightly lower on average. Finally, the interaction between test format and gender was not significant.
Students' Force Meanings. Our next analyses explore the degree to which the data sets from each format code students similarly in terms of students' best-match force meanings. These differences were not significant by gender. Lastly, we checked for differences in terms of multiple best-match meanings. The current study includes eleven girls coded for multiple best-match meanings and four boys. Two-way contingency table analyses showed, however, that gender and multiple best-match meanings were not significantly related for either the constructed-response format or the interview format.
We then analyzed the force-meaning scores underlying the best-match meanings. The mixed design ANOVAs analyzing the individual force-meaning scores for each force-meaning category demonstrate that there was a main effect of gender for the acquired/push-pull meaning, F(1, 41) = 6.75 p = .01, η2 = .14, but not for the other six force meanings. There were no significant interactions between gender and assessment format for any of the force meanings.
measures (i.e., the best-match score underlying the consistency codes and the acquired/push-pull force-meaning score underlying best-match meaning). The difference in terms of the acquired/push-pull force-meaning score is likely not of large import because (a) there were no significant differences for any of the other six force meanings, and (b) differences in a force-meaning score only affect best-match meaning if that force-meaning score is the highest of the seven force-meaning scores for that student. The difference in best-match score is more important, however, because it feeds directly into determination of the consistency codes. Thus, while the absence of a significant overall main effect for the consistency codes in terms of gender is the main finding, the main effect for gender in terms of the best-match score underlying the consistency codes merits further exploration in future research to determine the sources of these differences.
Question 3: Comparing Format Preference In Terms of Consistency and Meanings
Do the inferences drawn from the data sets suggest potential format preference differences or biases within or across the formats in terms of consistency or force meanings?
Students’ Consistency of Force Meanings. These analyses explore the degree to which the data sets collected through the two formats code students similarly in terms of the consistency of the force meanings that students express. Two-way contingency table analyses were conducted in order to evaluate whether students’ consistency varies across students’ preferences toward test format. The two variables were “consistent with allowance” codes and students’ format preferences (constructed-response versus interview). Format preference and fully-consistent codes were not significantly related for scores for the constructed-response format or for the interview format. Preference and consistent-with-allowance codes were also not significantly related for scores for the constructed-response format or for the interview format. Finally, the interactions were also not significant.
We next analyzed possible relationships between students’ consistency and format preference at the more granular level of the match scores underlying the consistency codes. A mixed design ANOVA for best-match scores was conducted with format preference as a between-subjects factor and assessment format as the within-subjects factor. There was no significant main effect for preference in terms of best-match score, and the interactions between assessment format and format preferences were not significant.
Students' Force Meanings. In terms of best-match meanings, there was not a significant main effect of format preference on best-match meanings, nor was there a significant interaction of format preference and assessment format in terms of best-match meanings. At the more granular level of the force-meaning scores underlying the best-match meanings, the mixed design ANOVAs analyzing the individual force-meaning scores for each force meaning category demonstrated that there were no main effects for format preference for any of the individual force-meaning scores. Similarly, there were no significant intersections between test format and format preference in terms of any of the individual force-meaning scores.
Summary of Overall Comparison by Format Preference. Overall, there were no significant main effects or interactions involving format preference in terms of consistency or force meanings. We therefore conclude that the data sets collected through the constructed-response and interview formats support similar inferences when coded using the rubrics developed by diSessa et al. (2004) independent of students’ format preferences.
Question 4: Implications for the Broader Discussion of Students Understandings of Force Knowledge Structure Coherence
What are the implications of the analyses in terms of the original series of studies on knowledge structure coherence and students' understanding of force?
While the primary focus of the current study involves exploring the potential of the constructed-response format as a supplement to interview formats in conceptual change research in this field, the findings of the current study in terms of students' consistency and best-match meanings are also of interest with regard to our understanding of the findings and variations across the original series of studies. The theoretical perspectives on conceptual change and knowledge structure coherence have evolved over this time period such that the original authors have come to share substantial similarities in theoretical perspectives on the underlying conceptual change processes (e.g., Clark & Linn, 2013; Vosniadou, 2013). Interesting questions remain, however, regarding the sources of the differences observed across countries and studies.
of Ioannides and Vosniadou (2002) for students in this age range. Although the primary purpose of the current study was not to determine if students were consistent, the results suggest that students from this age group are mostly not consistent in terms of a full consistency criterion. Using the consistent with allowance criterion added by diSessa et al., we again see similar results to diSessa et al. (2004), Özdemir & Clark (2009), and Clark, D’Angelo & Schleigh (2011). The current study thus adds further support to elemental perspectives on knowledge structure coherence.
In terms of best-match meanings, each of the empirical studies included in Table 6 has analyzed how students from the middle school and high school age groups code for force meanings for studies conducted in the United States including diSessa et al. (2004), Clark, D’Angelo & Schleigh (2011), and the current study. It should also be noted that the percentages of students in a given study could add up to more than 100% across the best-match meanings because some students were coded for multiple-best-match meanings as previously discussed. One interesting comparison is that only the diSessa et al. (2004) study has the students from the 15 year age group with the best-matched meanings in only one force meaning: gravity and other. All other empirical studies have a range of best-match meanings for the middle school and high school age groups. The shaded cells in Table 6 represent the force meaning that had the highest percentage of students coded for best-match meanings in each study/group.
Table 6. Frequencies of Force meanings across the studies for middle and high school students in the United States. Shaded cells are the highest frequency in each study/group for a best-match force meaning.
Empirical Studies
Data Set
Force Meaning Categories 1
Int
2 Int/m
ove 3 Int/a
cq
4 Acquir
ed 5 Acq/ p-p
6
Push-pull
7 Gravi ty and
other
diSessa et al. (2004)
Middle School (Mean age 12.6)
0 0 0 16.7 0 16.7 66.7
High School
(Mean Age 16) 0 0 0 0 0 0 100
Clark et al. (2011)
Middle School (Mean Age 13.7)
0 0 16.7 16.7 58.3 0 33.3
High School
(Mean Age 16.6) 0 0 0 11.1 11.1 0 77.8
Current Study Entering High School
(Mean Age 14.5)
Interview Format 4.4 4.4 6.7 53 35.6 4.4 20
Constructed
Response Format 15.6 2.2 2.2 46.7 28.9 2.2 17.8