ISSN:1991-8178
Australian Journal of Basic and Applied Sciences
Journal home page: www.ajbasweb.com
Corresponding Authors: Haslinda Zabiri, Universiti Teknologi Petronas, Chemical Engineering Department, 32610, Bandar Seri Iskandar, Tronoh, Perak, Malaysia.
Tel: +605-3687625; Fax: +605-3656176; E-mail: [email protected]
Variable Influence Analysis of an In-Situ Catalytic Adsorption (ICA) Steam
Gasification using Multivariate PLS
S. Yusup, H. Zabiri, M.M. Suliman and Z. Khan
Chemical Engineering Department, Universiti Teknologi Petronas, 32610 Bandar Seri Iskandar, Perak Darul Ridzuan, Malaysia.
A R T I C L E I N F O A B S T R A C T Article history:
Received 10 October 2015 Accepted 30 November 2015 Available online 31 December 2015
Keywords:
Hydrogen production, multivariate data analysis, PLS
In this paper, multivariate data analysis based on Partial least squares projection to Latent Structure (PLS) is utilized as an alternative approach to study the process variables-output responses relationship on a published data from an In-situ catalytic adsorption steam gasification pilot plant for H2 production. Performance comparison between the multivariate PLS analysis is compared with the reported data in literature obtained using RSM, ANOVA analysis and three dimensional surface plots. Results show promising capability of the multivariate PLS approach in allowing the variables-responses relationship to be studied simultaneously.
© 2015 AENSI Publisher All rights reserved. To Cite This Article: S. Yusup, H. Zabiri, M.M. Suliman and Z. Khan., Variable Influence Analysis of an In-Situ Catalytic Adsorption (ICA) Steam Gasification using Multivariate PLS. Aust. J. Basic & Appl. Sci., 9(37): 85-89, 2015
INTRODUCTION
Gasification technologies offer the opportunities to convert lignocellulose biomass into clean fuels i.e. hydrogen or synthesis gases which is mixture of CO and H2 (Chaubey, Sahu, James, & Maity, 2013); (Yusup, Khan, Ahmad, & Rashidi, 2014). Biomass gasification is usually added up by steam and catalyst to improve the product gas composition towards hydrogen rich gas production. More recently, the addition of in-situ CO2 adsorbent in gasification process makes biomass as a negative CO2 emitter. Palm oil waste is considered to be a source of renewable hydrogen especially in Malaysia which produced huge amount of oil palm wastes.Gasification using palm kernel shell (PKS) can be done either by using air or steam gasification using either fixed or fluidized bed reactor (Esfahani, Wan Ab Karim Ghani, Mohd Salleh, & Ali, 2011); (Mohammed, Salmiaton, Wan Azlina, Mohammad Amran, & Fakhru'l-Razi, 2011).
PKS gasification typically involves a number of process variables, and various studies have been done to investigate the effect and interaction of these process variables (Yusup et al., 2014); (Fermoso et
al., 2010). In (Yusup et al., 2014) particularly, the
interactions among temperature, steam to biomass mass ratio, adsorbent to biomass mass ratio, superficial velocity and biomass particle size for in-situ catalytic adsorption (ICA) steam gasification process of palm kernel shell for H2 production were studied. In their paper, the influence of the five
process variables on two output responses (H2 composition and yield) were analyzed using Response Surface Methodology (RSM) based on Centered Composite Rotatable Design (CCRD) approach. ANOVA analysis and three dimensional surface plots were utilized to study and visualize the interaction of any two process variables at a time on a specific output response variables.
In this paper, an alternative approach in studying the process variables interactions and influences on the same data presented in (Yusup et al., 2014) is investigated using the multivariate data analysis (MVDA) methods. Based on statistical projection method, MVDA is a cutting edge technology that provides graphical plots and projections by extracting information from multivariate and complex series of data (i.e. multiple variables measured on multiple samples or at multiple time points) simultaneously. In comparison to classical statistical methods such as Multiple Linear Regression, MVDA offers certain advantages in handling dimensionality problem, handling short and fat and long and lean data tables, dealing with missing data and affording helpful as well as investigative graphical tools (Eriksson, Johansson, Kettaneh-Wold, & Wold, 2001; Tauhid-Ur-Rahman, 2005). In this paper, Partial Least Squares projections to latent structures or PLS will be employed.
Methods:
or output variables, where N is the number of observations corresponds to, for example, the chemical samples, and K and M are the number of input and output variables, respectively. In MVDA, principal component analysis (PCA) forms the basis for most multivariate data analysis (Eriksson et al., 2001);(Lindgren, Geladi, & Wold, 1993; Saikat & Jun, 2008; Wold, 1987). However, one drawback of PCA technique is that it captures only the characteristics of the X-matrix or the input variables (Saikat & Jun, 2008). Any sort of relation that may exist between each input variable and the response or output variable is not captured. In multivariate regression analysis however, significant benefits can be achieved if as much information in the X-matrix can be captured as well as in the relation between the input variables X-matrix and the output variable Y-matrix. PLS provides an alternate approach that allows us to achieve this balance (Saikat & Jun, 2008).
Partial least squares projection to Latent Structures:
The PLS technique works by successively extracting principal components from both X and Y such that covariance between extracted principal components is maximized. PLS method tries to find a linear decomposition of X and Y such that
X
=
TP
T+
E
andF
UC
Y
=
T+
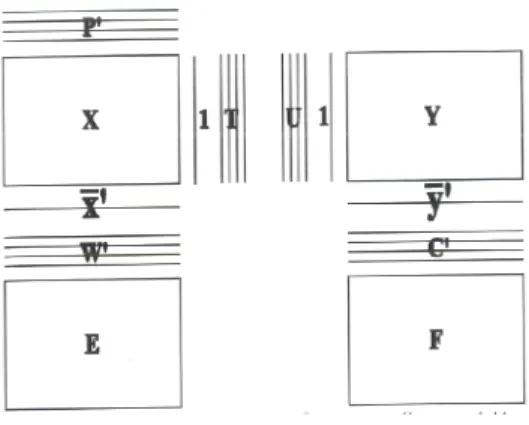
where the information related to the observations are stored in the score matrices T (N x A) and U (N x A); theinformation related to the variables are stored in the X-loading matrix PT (K x A) and the Y-weight matrix CT (M x A). The variation in the data that was left out of the modelling form the E (N x K) and F (N x M) residual matrices (Eriksson et al., 2001; Saikat & Jun, 2008).
Note that the principal components for X and Y are extracted successively and the number of principal components extracted, A, depends on the rank of X and Y. Decomposition is finalized so as to maximize covariance between T and U. There are multiple algorithms available to solve the PLS problem. However, all algorithms follow an iterative process to extract the principal components of X and Y.
Materials and data:
The In-situ Catalytic Adsorption (ICA) Steam Gasification System pilot plant used in this analysis is as described in (Yusup et al., 2014). The feedstock used was palm kernel shell. The present study considers five process variables; temperature, steam to biomass ratio, adsorbent to biomass ratio, fluidization velocity and biomass particle size. The data generated using CCRD design in (Yusup et al., 2014) with 26 experimental runs are used for the PLS analysis in the next sections. The X-block consists of the five process variables, and the Y-block consists of the two output response variables, namely H2 yield and H2 composition (see (Yusup et al., 2014)).
Fig. 1: PLS decomposition parameters.
RESULTS AND DISCUSSIONS
In this paper, the MVDA using PLS is applied using SIMCA-P software by Umetrics AB (Eriksson
et al., 2001). Applying the PLS analysis on the data
set, cross-validation technique inherent in SIMCA-P software generated a PLS model with single significant principal components (A = 1) as shown in Figure 2. The amount of variation in Y explained in terms of sum of squares, R2Y is 43%, and it
0.0 0.1 0.2 0.3 0.4 0.5 0.6 0.7 0.8 0.9 C o m p [1 ] Comp No.
ICAgasification-data.M1 (PLS) R2Y(cum) Q2(cum)
SIMCA-P 11 - 9/21/2014 4:32:55 PM
Fig. 2: Significant principal component given by SIMCA-P. . 0.0 0.1 0.2 0.3 0.4 0.5 0.6 0.7 0.8 0.9 C o m p [1 ] C o m p [2 ] C o m p [3 ] Comp No.
ICAgasification-data.M1 (PLS) R2Y(cum) Q2(cum)
SIMCA-P 11 - 9/21/2014 4:34:33 PM
Fig. 3: The effect of increasing number of principal components to three.
-3 -2 -1 0 1 2
-2 -1 0 1 2
u
[1
]
t[1]
ICAgasification-data.M1 (PLS) t[Comp. 1]/u[Comp. 1]
R2X[1] = 0.191153
1 2 3 4 5 6 7 8 9 10 11 12 13 14 15 16 17 18 19 20 21 22 23 24 25 26
SIMCA-P 11 - 9/21/2014 4:35:31 PM
Fig. 4: PLS t1/u1 scores plot.
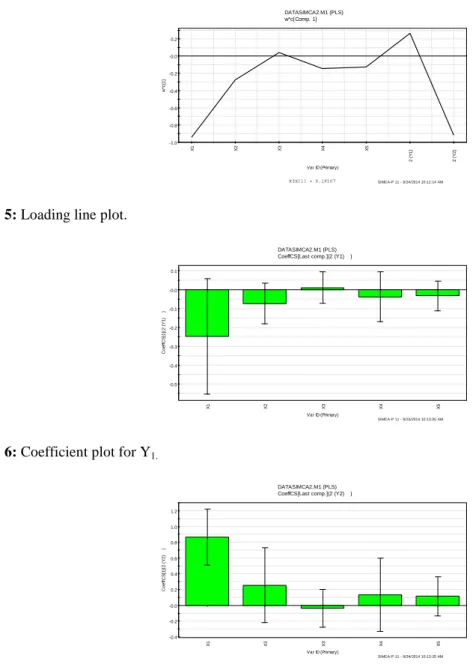
Figure 4 shows the PLS t1/u1 scores plot of the model for the pilot plant data. It can be observed that a fairly strong correlation between the input variables and the response or output variables. There are no outliers, i.e. off-diagonal points, and this is expected as the data on the 26 experimental runs are based on design of experiments (DOE). The loading line plot (Figure 5) displays the major relation between the process variables (X) and the output responses (Y). Responses opposite to each other are negatively correlated and positively correlated to responses situated near them. Variables situated near responses are positively correlated to them and those situated opposite are negatively correlated to the responses. Hence, from Figure 5, it can be clearly observed that for both H2 composition (Y1) and H2 yield (Y2), temperature seems to be the most important factor. H2 composition lies on the opposite quadrant of temperature, i.e. they are negatively correlated to each other. In other words, an increase in temperature will result in a decrease of H2 composition due to reverse carbonation reaction that dominates (Yusup et al., 2014) resulting in higher amount of CO2 in the product gas, and consequently a reduction in the H2 composition. Further, H2 yield is positively correlated with temperature (within the temperature range studied, i.e. 600-750oC) since they are in the same quadrant of the plot, indicating that H2 yield will benefit at higher temperatures. These
findings agree with those reported in (Yusup et al., 2014).
char gasification, steam methane reforming and tar cracking or reforming contribute to more H2
production in the product gas (Yusup et al., 2014).
-1.0 -0.8 -0.6 -0.4 -0.2 -0.0 0.2
X
1
X
2
X
3
X
4
X
5
2
(
Y
1
)
2
(
Y
2
)
w
*c
[1
]
Var ID (Primary)
DATASIMCA2.M1 (PLS) w*c[Comp. 1]
R2X[1] = 0.19107 SIMCA-P 11 - 9/24/2014 10:12:14 AM
Fig. 5: Loading line plot.
-0.5 -0.4 -0.3 -0.2 -0.1 -0.0 0.1
X
1
X
2
X
3
X
4
X
5
C
o
e
ff
C
S
[1
](
2
(
Y
1
)
)
Var ID (Primary)
DATASIMCA2.M1 (PLS) CoeffCS[Last comp.](2 (Y1) )
SIMCA-P 11 - 9/24/2014 10:13:05 AM
Fig. 6: Coefficient plot for Y1.
-0.4 -0.2 -0.0 0.2 0.4 0.6 0.8 1.0 1.2
X
1 X2 X3 X4 X5
C
o
e
ff
C
S
[1
](
2
(
Y
2
)
)
Var ID (Primary)
DATASIMCA2.M1 (PLS) CoeffCS[Last comp.](2 (Y2) )
SIMCA-P 11 - 9/24/2014 10:13:25 AM
Fig. 7: Coefficient plot for Y2.
Conclusions:
An alternative approach in studying the process variables interactions and influences on the same data presented in (Yusup et al., 2014) for H2 production has been investigated using multivariate PLS method. The results obtained are in good agreement with the reported data in (Yusup et al., 2014) using conventional methods.
ACKNOWLEDGEMENT
The authors would like to thank MOHE for the funding provided to support this work under grant LRGS 0153AB-I41.
REFERENCES
Chaubey, Rashmi, Sahu, Satanand, James, Olusola O. Maity, Sudip, 2013. A review on development of industrial processes and emerging techniques for production of hydrogen from renewable and sustainable sources. Renewable and Sustainable Energy Reviews, Elsevier, 23: 443-462.
Eriksson, L., E. Johansson, N. Kettaneh-Wold, S. Wold, 2001. Multi- and Megavariate Data Analysis: Principles and Applications: Umetrics Academy
Gasification in Fluidized Bed Reactor. . Energy & Fuels, 26(2): 1185-1191.
Fermoso, J., M.V. Gil, B. Arias, M.G. Plaza, C. Pevida, J.J. Pis, F. Rubiera, 2010. Application of response surface methodology to asses the combined effect of operating variables on high-pressure coal gasification for H2-rich gas production. . International Journal of Hydrogen Energy, 35(3): 1191-1204.
Lindgren, F., P. Geladi, S. Wold, 1993. The kernel algorithm for PLS. Journal of Chemometrics, 7: 45-59.
Mohammed, M.A.A., A. Salmiaton, W.A.K.G. Wan Azlina, M.S. Mohammad Amran, A. Fakhru'l-Razi, 2011. Air gasification of empty fruit bunch for hydrogen-rich gas production in a fluidized-bed reactor. Energy Conversion and Management 52(2): 1555-1561.
Saikat, Maitra, Jun, Yan, 2008. Principle component analysis and partial least squares: two
dimension reduction techniques for regression. Paper presented at the CAS Casualty Actuarial Society 2008 Discussion Paper Program.
Tauhid-Ur-Rahman, Md., 2005. Application of Multivariate Data Analysis for Assessment of Partial Nitritation/ANAMMOX Process. (Master), Royal Institute of Technology, Stockholm, Sweden.
Wold, S., 1987. Principal Component Analysis. Chemometrics and Intelligent Laboratory Systems, 2: 37-52.
Yusup, Suzana, Khan, Zakir, Ahmad, Murni Melati, Rashidi, Nor Adilla, 2014. Optimization of hydrogen production in in-situ catalytic adsorption (ICA) steam gasification based on Response Surface Methodology. Biomass and Bioenergy, 60(0):
98-107. doi:
![Fig. 2: Significant principal component given by SIMCA-P. . 0.00.10.20.30.40.50.60.70.80.9 Comp[1] Comp[2] Comp[3] Comp No](https://thumb-us.123doks.com/thumbv2/123dok_us/7850950.2093226/3.892.286.607.113.217/significant-principal-component-given-simca-comp-comp-comp.webp)