
R E S E A R C H A R T I C L E
Open Access
Curie temperature determination via
thermogravimetric and continuous wavelet
transformation analysis
John Hasier
1*, Maria Annichia Riolo
2and Philip Nash
1* Correspondence: [email protected] 1Thermal Processing Technology
Center, IIT, 10 W 32nd St, Chicago, IL 60616, USA
Full list of author information is available at the end of the article
Abstract
A cost effective method for conversion of a vertical tube thermogravimetric analysis system into a magnetic balance capable of measuring Curie Temperatures is presented. Reference and preliminary experimental data generated using this system is analyzed via a general-purpose wavelet based Curie point edge detection technique allowing for enhanced speed, ease and repeatability of magnetic balance data analysis. The Curie temperatures for a number of Heusler compounds are reported.
Keywords:Curie temperature, Ferromagnetic materials, Thermogravimetric analysis, Differential scanning calorimetry, Continuous wavelet transform, Heusler alloys
Introduction
Modern advances in computational technology have enabled the rapid prediction of new materials and many of their properties from first-principles calculations. These tools have been essential in developing large databases such as Materials Project [1] the Open Quantum Materials Database (OQMD) [2] and AFLOW [3] that form the backbone of the modern Materials Genome Initiative [4]. Experimental verification of these predictions has not been similarly accelerated, and this measurement gap constrains the ability of materials engineers to produce bespoke materials meeting modern application demands.
One of the basic fundamental magnetic properties of a ferromagnetic material is the Curie temperature or Curie point [5]. Robust knowledge of this transformation temperature where all ferromagnetism ceases within a material is essential for the study, processing, and application of ferromagnetic compounds. Modern measurement of the Curie temperature is typically accomplished using some form of magnetometer measuring current induced by the magnetic field emanating from a material or zeroing out the material field with a compensating coil [6, 7]. The earliest magnetization mea-surements and Curie temperatures were recorded using a special torsion balance that used the force of gravity to measure the magnitude of the magnetic field coming from a material via an effective mass change on the balance equilibrium position [8]. Sys-tems supplementing differential scanning calorimeter and thermogravimetric analyzers with a permanent magnet to create a similar magnetic balance are popular for Curie temperature measurements [9, 10]. This is done not only to enable measurement of
Curie transformations in unknown materials, but also to increase the accuracy of the instrument by correcting temperature profiles using the very sharp Curie point instead of or in addition to melting point reference temperatures [11, 12].
The thrust of this work is two-fold. First, to describe the process by which a vertical tube furnace with hanging balance TGA can be modified using low-cost materials to perform Curie temperature measurement via the introduction of a static electromag-netic field. The second aim is to demonstrate an analysis technique based on the con-tinuous wavelet transform to enable user agnostic high-speed analysis of magnetic balance data for Curie temperature determination. High throughput experimental data analysis combined with reduced cost apparatus will enable more rapid verification of novel magnetic materials essential to close the feedback loop of modern integrated computational materials design. To illustrate this, data gathered and processed using these techniques on common magnetic materials as well as more exotic Heusler alloy ferromagnetic compounds is presented.
Methods
In order to identify and characterize the phase transformations of a material, we meas-ure the heat-flow between our sample and an inert reference material as they are heated and cooled together. This technique is known as differential scanning calorim-etry (DSC) and is useful for identifying and characterizing phase transformations in a material. DSC works by scanning a furnace over a range of temperature while measur-ing heat flow between a sample and a reference material. Many DSC/DTA systems in-clude a microbalance for collection of simultaneous Thermogravimetric Analysis (TGA) data that is simply looking at the change in mass of a sample under various heating and cooling conditions. By applying a constant magnetic field to our sample, we are able to exploit this capability to measure changes in magnetism via changes in effective mass. This work was conducted using a Setaram Setsys Evolution DSC-DTA-TGA 16/18 System, but the hardware modifications can be applied to any vertical tube furnace TGA system and the data analysis techniques are of general application to magnetic balance data of all varieties.
shot from the counterweight arm of the balance. This entire balance, rod and pan assembly is mounted on a vertical moving linear actuator to enable loading and unload-ing of the pan outside the furnace tube. The balance environment is pressure sealed and coupled with the sample environment. Thus the sample and balance can be purged at various flow rates with a selectable so called carrier gas. In this work, Ar was used at a flow rate of about 1.5 L per hour to purge the sample. Type S Pt/Pt-10%Rh thermo-couples were used for the sample temperature, heat flow sensor, and the furnace temperature measurement. While sample and heat flow sensors are integrated into the platinum pan on the DSC, the furnace thermocouple is separate and sits just below the pan at the end of an alumina rod with a notched disk alumina heat shield just below the exposed thermocouple junction. All thermocouple junctions are bare and as small as practical for maximum rate sensitivity.
It is important to note that carrier gas purity, pressure, and flow rate have a notice-able effect on the heat flow, sample temperature time lag relative to the furnace control sensor, and mass change signal. These arise due to the flow and pressure having heat transport properties as well as buoyancy and drag effects on the crucible that change during the temperature scan.
The DSC-TGA needs temperature correction for these systematic errors in order for results to be quantitative. This is traditionally accomplished via melting a series of standard materials of known melting point in the instrument then fitting a correction curve between the measured melting point and the reference data for the standard ma-terial. In addition, if each reference is carefully weighed with a microbalance, the latent heat effects of these melts can be integrated to provide calibration data for the calorim-eter equation assuming the heat of fusion is well characterized for each reference material used to compute the temperature correction. This procedure introduces some new uncertainty since the melting point standards are sensitive to impurities changing the onset and completion of melting. To avoid the messiness of such melting temperature calibration uncertainties, many DSC-TGA manufacturers use magnetic reference materials of different Curie Temperatures to correct the temperature profile of the instrument. The sharp 2nd-order nature of the Curie transformation means that it occurs almost instantaneously. There is no large magnitude heat effect during the Curie transformation in contrast with a 1st order transformation like melting/solidifica-tion, but the TGA signal of a ferromagnetic material under the influence of an external magnetic field will manifest as a sharp drop (or increase if the magnet is placed such that it pulls the sample opposite to the direction of gravity) in effective mass exactly at the Curie Temperature. This response is stable so long as the reference is of reasonable purity, and is less messy than the onset of melting which can be subject to depression by things like contamination or sample size.
permanent magnet is difficult for many TGA geometries, such as the Setsys Evolu-tion 16/18, and even if a suitable configuraEvolu-tion can be obtained the resulting effective mass change induced by a permanent magnet is typically small in magni-tude relative to sample mass [13].
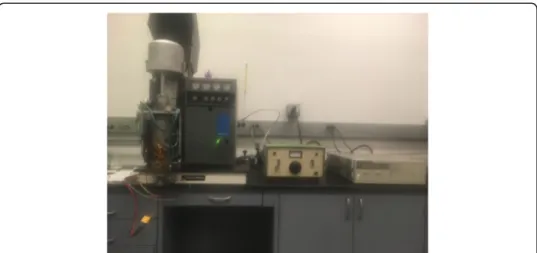
Large static magnetic fields are incredibly difficult to shield out of any volume of space short of enclosing that volume in superconductor [14]. That being said magnetic fields drop in strength very rapidly, ~1/(r3) with distance from the magnet. Given these facts, it was decided to augment this Setaram DSC-DTA-TGA by adding a large elec-tromagnet surrounding the water-cooled stainless steel furnace jacket (Figs. 1 and 2).
A first successful proof of concept was attempted using a 20 V, 12A bench top con-stant current-concon-stant voltage (CC-CV) power supply. This supply was attached to a 10 turn cylindrical solenoid approximately 6 in. in diameter and 5 cm in height made of 16 American Wire Gauge (AWG) solid core varnish coated magnet wire. A 10 A constant current was applied to this coil. A 50 mg piece of 99.995 + % (metals basis) pure Fe was placed in the 100μL Alumina crucible. The TGA signal was observed and a maximum effect of 5 mg of sample mass increase was seen whilst sliding the solenoid
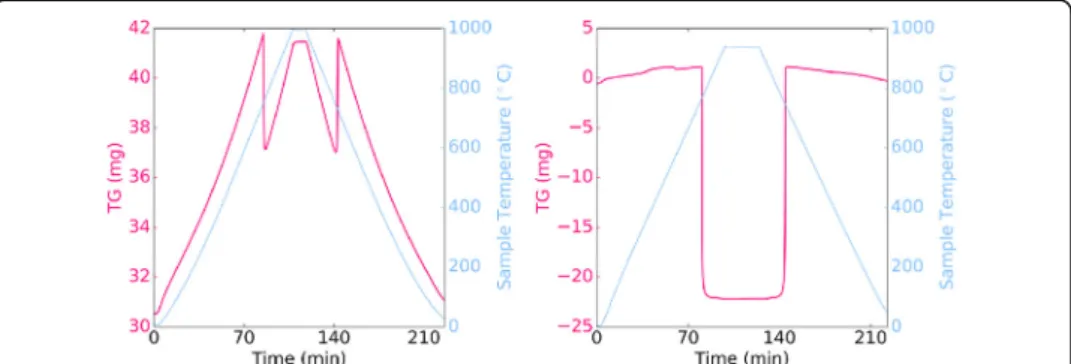
coil up and down the furnace column length. The optimal position, for maximum ob-served effective mass change under applied field, was marked at the top of the coil sur-face on the furnace jacket with a Sharpie. The coil was then secured in this position to the stainless steel furnace jacket with Kapton tape and preliminary DSC-TGA temperature scans revealed a step change in the TGA signal in Fe and Ni reference ma-terials in the vicinity of their respective Curie temperatures. However, a temperature scan on high purity Co revealed that the mass effect was too small to produce a reliable Tceffect at the Curie point for this lower magnetic susceptibility ferromagnetic mater-ial. Using this information a larger electromagnet was constructed to increase the size of the effective mass change induced by the external field. Larger 10 AWG magnet wire capable of handling up to 55 A of current [16] with high temperature polyamide coat-ing was used to form a 2 layer 48 turn coil of similar diameter and approximately 12 cm in length extending from the lower water cooling tube up to the Sharpie mark indicating the sample pan position as shown in Fig. 2. This new coil was powered by an Agilent 6573A, 0-35 V/0-60A CC-CV power supply running in CC mode. Even though the new wire can take 55A of current, and probably more given that it is secured against a water cooled steel cylinder, a 40 A current at ~3 Volts was found to be suffi-cient to elicit a large mass change signal even in a low magnetization per unit mass ma-terial like Co (Fig. 3).
Curie temperatures of select reference magnetic materials were measured as fol-lows. The furnace column was evacuated to 0.1 atm of pressure then purged with the high purity Argon gas. The flow rate was stabilized at approximately 1.5 l per hour. The TGA microbalance was tared and then data acquisition was started while holding at 20 °C. After a few minutes the power supply was engaged and the current was ramped to 40.00 A in under a minute. The furnace is held at 20 °C for at least 20 min before ramping to scan the furnace. Scans were performed at 5 °C per minute ramp rate up to a maximum temperature at least 50 °C above the known Curie Temperature of the reference material then held isothermally for at least 6 min then ramped down at 5 °C per minute to 20 °C. This cycle was re-peated to check the repeatability of the measurement and reversibility of the transformation.
Since this technique was developed to support ongoing work with half-metallic ferro-magnetic Heusler alloys a selection of 50 mg crystallographically pure Heusler compounds from these ongoing studies [17–19] were used to validate the technique on more exotic samples.
Consistently identifying the bottom edges of the Curie transformation step is essential to evaluating the magnetic balance data. Older studies [11] used the derivative of the Tg signal but this is very unreliable when the Tgsignal pre- and post- Curie point is subject to other simultaneous processes. The number of confounding terms such as sample de-composition, buoyancy and oxidation are capable of generating a variety of profiles above and below the Curie transformation. This coupled with the discrete nature of the data makes numerical derivatives a crude tool without further user intervention such as baseline fits and smoothing functions. To cut through this mess, rather than resort to tedious human error prone hand fitting, the decision was made early on to borrow tools for edge detection from the modern digital signal processing toolkit.
The Continuous Wavelet Transform (CWT) is a popular signal processing integral transform. To begin consider the CWT of a signalf(t)with waveletψof scale s at time-shiftupresented in Eq. 1 in the notation of Mallat [20, 21].
W f uð ;sÞ ¼ f;ψu;s
D E
¼ Z þ∞
−∞ f tð Þ
1
ffiffi
s
p ψ t−u s
dt
Eq. 1. The Continuous Wavelet Transform
Cψ¼ Z þ∞
0
ψ^ð Þω
2
ω dω<þ∞
Eq. 2. The wavelet admissibility condition.
A wavelet is simply a brief, wave like excitation that starts at zero amplitude increases and or decreases a small number of times and then returns to zero amplitude. There are many possible wavelets to generate an acceptable orthonormal basis for the CWT. Being more specific, any wavelet satisfyingΕq. 2, whereψ ωð Þdenotes the Fourier trans-form of the wavelet, will suffice. For this study the Ricker or Mexican-hat wavelet Eq. 3 with Fourier transform Eq. 4 was chosen [20, 21].
ψð Þ ¼t 2 π1=4pffiffiffiffiffiffi3σ
t2 σ2−1
exp −t
2
2σ2
Eq. 3. The Mexican-hat wavelet
^
ψ ωð Þ ¼− ffiffiffi
8
p
σ5=2π1=4
ffiffiffi
3
p ω2exp −σ2ω2
2
Eq. 4. The Fourier transform of the Mexican-hat wavelet.
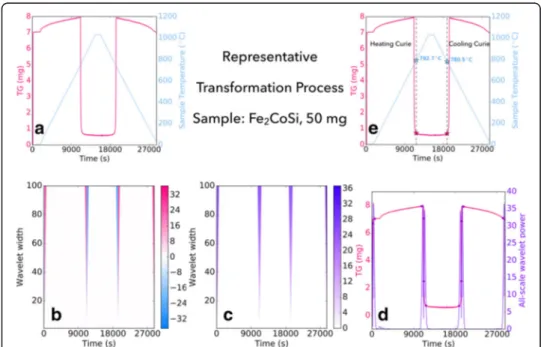
From the TGA scan data, we take the Tg signal over time, plotted in Fig. 4a, and apply a continuous wavelet transform. In our implementation, we read in the TGA scan data via a python script and use the CWT and Ricker wavelets built into SciPy [22]. For computational speed, we limit the transformation to 100 width scales, which in practice does detect the fast time-scale structure of interest. When we plot the generated CWT spectrum (see Fig. 4b) and its power spectrum, defined by taking the magnitude of the wavelet spectrum (see Fig. 4c), we can see the sharp changes in magnetism characteris-tic of the Curie temperature appear in the wavelet spectrum as peaks in power span-ning a broad range of time scales. Because of this characteristic shape, we use the sum of wavelet power across scales, defined as sum of the absolute value of the wavelet transform at each scale for a particular location in time, as a summary statistic to iden-tify times of interest. In Fig. 4d, this “total power” is plotted in purple, alongside the magnetism in red. We can see in the figure that the four sharp peaks occur at the
“shoulders”of the magnetism curve, picking out the beginning and end of the heating and cooling Curie transitions. We then apply an arbitrary threshold (in our case, the
90th percentile of excitation across all times) to delineate these periods of interest, shaded in purple in Fig. 4d. We plot the start and end of times of all detected periods in Fig. 4d. from which the user can readily identify the points associated with the Curie temperature transitions as indicated by the sky blue stars in Fig. 4e.
This method only requires a few seconds of human observation to identify the points of interest that are systematically generated by the computer. This process so far allows us to find the scan time and associated sample thermocouple temperature, when the sample is fully demagnetized. However, the fundamental material property we are inter-ested in is the temperature of the sample itself where that Curie transition occurs.
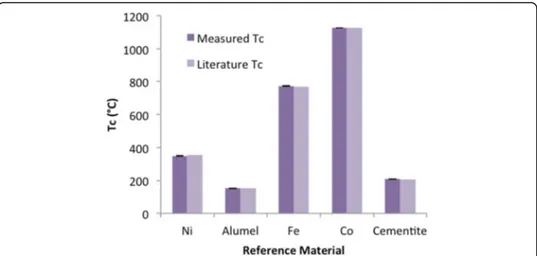
The precise relationship between thermocouple temperature and actual sample temperature will be instrument dependent due to many factors, including process gas pressure, process gas flow rate, thermocouple response, heater response, and chiller ef-ficiency that cannot be easily mechanistically modeled as a function of temperature. What this means in a given measurement setting is that the lead or lag between furnace and sample temperatures will depend on the physical properties of the carrier gas, the gas flow rate, temperature scan rate and direction. We can hold all of these things con-stant except the scan direction, which will separate our data points into heating and cooling sets. Using the reference materials named in Fig. 5, we estimate the true sample temperatures as a function of our measured furnace temperatures for the heating and cooling ramps. Each reference of known Tc is measured on heating and cooling with the heating data and cooling data fitted separately to a 2nd degree polynomial to empir-ically correct the systematic errors during the DSC-TGA scan.
Applying this correction to 2 scans of a sample generates 4 Ci point measurements that are then averaged, assuming the transformation appears reversible, to a reported value of Tc and standard measurement error. This method overall is somewhat arbi-trary, but the computer finds the edges well enough and fast enough that together with empirical correction it is a good estimate of Tcfor those lacking a reliable magnetom-eter. Users with access to a greater variety of magnetic reference materials may benefit by using a higher order polynomial or other empirical correction method such as linear interpolation between reference points. Regardless of the type of empirical correction used, it is important to check that the results for the reference data are self-consistent,
give less weight to extrapolated corrections outside the temperature bounds of the ref-erence material set, and validate the results periodically as the performance and system-atic errors of DSC-DTA-TGA systems are subject to drift over time.
Results
These results are compiled from the modified DSC magnetic balance and the wavelet analysis of the TGA signal. To begin, it is essential to look at the standard materials used to perform the empirical temperature correction on heating and cooling of the DSC via 2nd degree polynomial fits as well as literature values. It is clear from the data in Fig. 5. that there is good agreement between the corrected temperatures and the ref-erence values over a broad range of temperatures suggesting that independent empir-ical fits on heating and cooling self-consistently model the instrumental errors. Despite the low accuracy of Type-S thermocouples at low temperature, anything measured within the temperature range of the references should produce reliable, repeatable, Curie temperature data. Loss of thermocouple accuracy and lack of reference material data near room temperature means that anything computed below the Curie temperature of Alumel should be taken as indicative unless verified via other methods such as magnetometry.
Having met with a degree of success in reproducing well-established values the study was expanded to a variety of Heusler compounds that displayed room temperature ferromagnetism produced via high temperature direct reaction calorimetry in the Kleppa Calorimeter at IIT. These results can be seen in Fig. 6. The error bars are 2 standard deviations from the measurement on a minimum of 4 independent measure-ments, 2 on heating and 2 on cooling. Some of the compounds have not had their Curie temperature reported before.
Discussion
The Curie temperatures determined in this work appear to be in decent agreement with other literature values [23–28], shown in Fig. 6. Note that not every paper was forthcoming with a standard error in the Curie temperature measurements since they are typically compiled along with other material data with granularity being sacrificed in the name of a broader view of material properties. In the case of Co2FeSi, the only
existing experimental value reported has a standard error of +/− 20 K [28]. Further-more, in the case of Fe2CoAl the reported value of 737 °C is increased to over 800 °C when the sample is prepared via powder metallurgy, which is attributed to the grain size being smaller than the average domain size [29]. Given that the intermetallic sam-ples in this study were synthesized from elemental powders by direct reaction calorim-etry this elevation effect may be taking place with some of these samples if they did not melt at the calorimeter temperature. Furthermore, no compensation was made for Field Cooling where the sample is cooled with an applied external magnetic field and then Curie temperature is measured, as opposed to Zero Field Cooling where the sample is raised above the Curie temperature with no external magnetic field, neglecting the Earth’s natural magnetic field, then cooled to ambient conditions, or the lowest magnetization measurement temperature if using a magnetometer, and then reheated up to the Curie point. As one would expect if all the domains are aligned by an external field this will change the resistance of the material to demagnetization and hence move the Curie point higher. The size of this effect depends on many parameters, but it is important to recognize it exists and that accounting for it may be of some utility.
The TGA system used in this study also has a DSC sensor which enables verification of the Curie temperature and identification of other important transformations via heat flow, but the magnitude of these heat effects is typically small even in strongly magnetic materials [30]. Ongoing work is taking place to integrate data from the heat flow signal on the DSC-TGA with the magnetic balance data to aid in the search for candidate magnetic shape memory, thermoelectric and magnetocaloric materials. In particular, Heusler based alloys show a strong propensity towards such multifunctional behavior when there exists a martensitic transformation near the Curie point [31]. Expanding this technique to automatically search for martensitic heat effects in the vicinity of the Curie point would enable rapid screening for promising multifunctional Heusler com-pounds. The precision control possible with electromagnets will enable information about the magnetization per unit mass to be gathered on the Setsys 16/18 or a similar setup if the magnetic field and its gradient can be measured in the vicinity of the sam-ple pan as a function of applied current and the magnetic history of the samsam-ples is con-trolled [13, 32]. Even without this additional quantitative field information the changes in magnetic response of a material as a function of temperature can aid in identifying and characterizing microstructural changes in ferromagnetic materials [32].
Conclusion
the rapidly growing field of materials modeling continues to yield ab initio magnetic material predictions that demand experimental verification. Promising multifunctional magnetic compounds predicted via computation and verified with these techniques can also be characterized for processing and service optimization as the shape and location of magnetic transitions contains information about the phase transformations within these materials. The Curie temperatures of select Heusler alloys were measured via this new technique with a maximum standard error of 2.5% while showing good agreement with previously reported results for most compounds.
Acknowledgements
Russ Janota was essential in assisting in device modification and upkeep.
Funding
This work was made possible by NSF funding under awards DMR1307631 and DMR1607943.
Availability of data and materials
Data essential for evaluation is contained within the figures. Authors are open to placing raw and processed datasets as well as other files to aid in replication in a convenient location, but it is currently available by direct request only.
Authors’contributions
JJH designed and developed the instrumentation modifications, collected all data, assisted with the development of the analysis methods, and wrote most of the manuscript. MAR wrote most of the high-throughput analysis code and ensured accuracy of mathematical explanations of the analysis process. PN critiqued the apparatus designs, guided the selection of samples for testing, and ensured the thermal analysis portions of the paper were correct. All authors read and approved the final manuscript.
Ethics approval and consent to participate Not applicable.
Consent for publication Not applicable.
Competing interests
Primary author was seeking employment with Setaram, Inc. during article submission and review.
Publisher’s Note
Springer Nature remains neutral with regard to jurisdictional claims in published maps and institutional affiliations.
Author details
1Thermal Processing Technology Center, IIT, 10 W 32nd St, Chicago, IL 60616, USA.2Center for the Study of Complex
Systems, University of Michigan, 321 W Hall, 1080 S. University, Ann Arbor, MI 48109, USA.
Received: 21 April 2017 Accepted: 21 August 2017
References
1. Jain A, Ong SP, Hautier G, Chen W, Richards WD, Dacek S, Cholia S, Gunter D, Skinner D, Ceder G, Persson KA (2013) Commentary: the materials project: a materials genome approach to accelerating materials innovation. APL Mater 1:011002–011012. https://doi.org/10.1063/1.4812323
2. Saal JE, Kirklin S, Aykol M, Meredig B, Wolverton C (2013) Materials design and discovery with high-throughput density functional theory: the open quantum materials database (OQMD). JOM 65:1501–1509. https://doi.org/10. 1007/s11837-013-0755-4
3. Curtarolo S, Setyawan W, Hart GL, Jahnatek M, Chepulskii RV, Taylor RH, Wang S, Xue J, Yang K, Levy O (2012) AFLOW: an automatic framework for high-throughput materials discovery. Comput Mater Sci 58:218–226 4. Holdren JP (2011) Materials genome initiative for global competitiveness. National Science and technology
council OSTP. Washington, USA
5. Curie P (1889) Sur une balance de précision et à lecture directe des derniers poids. CR Hebd Séances Acad Sci 108:663–666
6. Fabian K, Shcherbakov VP, McEnroe SA (2013) Measuring the curie temperature. Geochem Geophys Geosyst 14: 947–961. https://doi.org/10.1029/2012GC004440
7. Ade-Hall JM, Wilson RL, Smith PJ (1965) The petrology, curie points and natural magnetizations of basic lavas. Geophys J Int 9:323–336
8. Curie P, Chéneveau C (1903) Sur un appareil pour la détermination des constantes magnétiques. Journal de Physique Théorique et Appliquée 2:796–802
10. Perkin-Elmer (2015) FAQ_Beginners-Guide-to-Thermogravimetric-Analysis https://www.perkinelmer.com/lab-solutions/ resources/docs/faq_beginners-guide-to-thermogravimetric-analysis_009380c_01.pdf. Accessed 12 Mar 2017 11. Norem SD, ONeill MJ, Gray AP (1970) The use of magnetic transitions in temperature calibration and performance
evaluation of thermogravimetric systems. Thermochim Acta 1:29–38
12. Jiang M, Liu Q, Zhang Q, Ye C, Zhou G (2012) A series of furan-aromatic polyesters synthesized via direct esterification method based on renewable resources. J Polym Sci A Polym Chem 50:1026–1036
13. Nowicki M,Švec P, Jackiewicz D, Szewczyk R (2015) Magnetic thermogravimetric analysis of CuCo and CuFe amorphous alloys. In: Szewczyk R, Zieliński C, Kaliczyńska M (eds) Progress in automation, robotics and measuring techniques, Measuring techniques and systems, vol 3. Springer International Publishing, Cham, pp 197–204 14. Meissner W, Ochsenfeld R (1933) Ein neuer effekt bei eintritt der supraleitfähigkeit. Naturwissenschaften 21:787–788 15. SETARAM Instrumentation-Calorimetry & Thermal Analysis.
http://www.setaram.com/setaram-products/thermal-analysis/differential-scanning-calorimetry-dsc-differential-thermal-analysis-dta/setsys-evolution-dtadsc/. Accessed 10 Nov 2016.
16. Glover TJ (2002) Pocket ref. Sequoia Pub
17. Yin M, Nash P, Chen S (2015) Enthalpies of formation of selected Fe2YZ Heusler compounds. Intermetallics 57:34–40. https://doi.org/10.1016/j.intermet.2014.10.001
18. Yin M, Chen S, Nash P (2013) Enthalpies of formation of selected Co2YZ Heusler compounds. J Alloys Compd 577: 49–56. https://doi.org/10.1016/j.jallcom.2013.04.136
19. Yin M, Hasier J, Nash P (2015) A review of phase equilibria in Heusler alloy systems containing Fe, co or Ni. J Mater Sci 51:50–70. https://doi.org/10.1007/s10853-015-9389-y
20. Mallat S (1999) A wavelet tour of signal processing. Academic press
21. Mallat S (2010) A wavelet tour of signal processing: the sparse way (third edition). 1–824 22. Jones E, Oliphant T, Peterson P (2014) {SciPy}: open source scientific tools for {python}
23. Kumar KR, Bharathi KK, Chelvane JA, Venkatesh S, Markandeyulu G, Harishkumar N (2009) First-principles calculation and experimental investigations on full-Heusler alloy co $ _ {2} $ FeGe. IEEE Trans Magn 45:3997–3999 24. Kübler J, Fecher GH, Felser C (2007) Understanding the trend in the curie temperatures of co 2-based Heusler
compounds: ab initio calculations. Phys Rev B 76:024414
25. Kurfiss M, Anton R (2003) Structural and magnetic properties of vapour deposited thin films of the Heusler alloy Ni 2 MnIn. J Alloys Compd 361:36–39
26. Kumar KR, Kumar NH, Markandeyulu G, Chelvane JA, Neu V, Babu PD (2008) Structural, magnetic and transport properties of half-metallic ferrimagnet Mn 2 VGa. J Magn Magn Mater 320:2737–2740
27. Şaşıoğlu E, Sandratskii LM, Bruno P (2004) First-principles calculation of the intersublattice exchange interactions and curie temperatures of the full Heusler alloys Ni 2 Mn X (X= Ga, in, Sn, Sb). Phys Rev B 70:024427 28. Wurmehl S, Fecher GH, Kandpal HC, Ksenofontov V, Felser C, Lin H-J, Morais J (2005) Geometric, electronic, and
magnetic structure of co 2 FeSi: curie temperature and magnetic moment measurements and calculations. Phys Rev B 72:184434
29. Jain V, Nehra J, Sudheesh VD, Lakshmi N, Venugopalan K, Bhardwaj S, Shekhawat MS, Suthar B (2013) Comparative study of the structural and magnetic properties of bulk and nano-sized Fe 2 CoAl. AIP Conference Proceedings. AIP, In, pp 935–936
30. Chau N, Nhat HN, Luong NH, Le Minh D, Tho ND, Chau NN (2003) Structure, magnetic, magnetocaloric and magnetoresistance properties of la 1−x Pb x MnO 3 perovskite. Phys B Condens Matter 327:270–278 31. Planes A, Mañosa L, Acet M (2009) Magnetocaloric effect and its relation to shape-memory properties in
ferromagnetic Heusler alloys. J Phys Condens Matter 21:233201–233229. https://doi.org/10.1088/0953-8984/21/23/ 233201
![Fig. 1 Modified schematic of Setsys DSC-TGA: 1 Electromagnetic Coil, 2 Platinum Pan, 3 Control Thermocouple, 4 Microbalance, 5 Heater, 6 Water Cooling, and 7 Heat Shield [15] (used with permission)](https://thumb-us.123doks.com/thumbv2/123dok_us/7914491.2105996/4.892.178.717.484.1065/modified-schematic-electromagnetic-platinum-control-thermocouple-microbalance-permission.webp)
![Fig. 6 Curie temperatures of select Heusler alloys measured using the modified DSC as compared with literature values [23 –28], error bars are 2 standard deviations representing a 95.45% confidence interval](https://thumb-us.123doks.com/thumbv2/123dok_us/7914491.2105996/9.892.183.717.836.1058/temperatures-compared-literature-standard-deviations-representing-confidence-interval.webp)
