15-041-R02
A Study of Cost Variations for Knee and
Hip Replacement Surgeries in the U.S.
January 21, 201515-041-R02
THE EXTREME COST VARIATION IN HEALTHCARE
Today consumers are seeking to make more decisions on their healthcare needs based on costs and quality considerations. With the growth of consumerism in healthcare allowing people to shop their options, more individuals are learning that medical services and procedures have tremendous, seemingly random variation in costs.
This report analyzed three years of independent Blue Cross and Blue Shield (BCBS) companies’ claims data for typical knee and hip replacement surgeries to further assess cost variations across the U.S. According to the report findings, some hospitals across the U.S. charge tens of thousands of dollars more than others for the same medical procedures, even within the same metropolitan market. The report, which examines these procedures in 64 markets across the country, found that their cost can vary by as much as 313 percent, depending on where the surgeries are performed. The report highlights typical knee and hip replacement procedures because they are among the fastest growing medical treatments in the U.S. A study published in the June 2014 issue of Journal of Bone and Joint Surgery, found that typical knee replacements more than tripled and that typical hip replacements doubled between 1993 and 2009. In 2011 there were 645,062 typical hip replacements and 306,600 typical knee replacements performed in the U.S., according to a report from the American Academy of Orthopaedic Surgeons.
The phenomenon of extreme price variation in healthcare can have obvious financial consequences for individuals and employers. And from a macroeconomic perspective, it can have serious implications for the sustainability of a U.S. healthcare system that is exceeding its economic capacity. National health spending will increase over the next decade, propelled, in part, by the gradual rebound of the economy and the growing numbers of insured under the Affordable Care Act (ACA).1 Medicare’s actuaries expect that through 2023, healthcare costs will grow by an average rate of 5.7 percent each year.2 In addition, the number of uninsured is expected to decline by nearly half from 45 million in 2012 to 23 million in 2023, as a result of the coverage expansions associated with the ACA.3 While coverage expansion is needed, this may further increase healthcare utilization and spending across the U.S.
In order to address healthcare costs and access, it is important that consumers, employers and industry leaders have information on these price variations and are provided the tools to become well-informed healthcare shoppers.
This is the first report by Blue Cross Blue Shield, The Health of America Report, a collaboration between the Blue Cross Blue Shield Association (BCBSA) and Blue Health Intelligence (BHI), that will utilize a market-leading medical claims database to uncover key trends and provide insight into healthcare dynamics.
1. Kaiser Health News, Health Care Spending Forecast to Increase Modestly in Next Decade, 9/3/2014, Kaiser Health News Link
2. Health Affairs, National Health Expenditure Projections, 2013-23: Faster Growth Expected with Expanded Coverage and Improving Economy, 9/3/2014, affiliated authors include economists in the Office of the Actuary at CMS, http://content.healthaffairs.org/content/early/2014/08/27/hlthaff.2014.0560.full
Analyzing Cost Variation
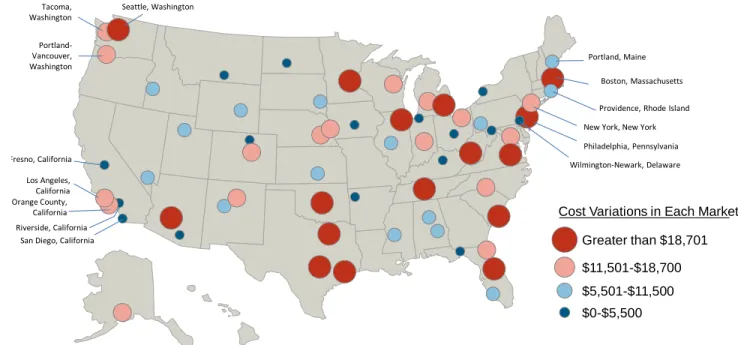
4The two maps below highlight cost variation within different markets across the country, based on average facility costs for typical knee and hip replacement procedures. This confirms generally accepted industry findings that significant cost variation exists across the country. For specific dollar ranges and markets, see Appendix A.
Figure 1: Cost Variation for Knee Replacement Procedures Across the Country
Appendix A contains a list of plotted markets showing the Minimum Cost, Average Cost, Maximum
Cost and Percent Differential between the Minimum and Maximum.
Cost Variation for Knee Replacement
Procedures across the country
(avg facility costs)
Seattle, Washington Tacoma,
Washington Portland-Vancouver, Washington
Los Angeles, California
San Diego, California Orange County,
California
Portland, Maine Boston, Massachusetts Providence, Rhode Island Philadelphia, Pennsylvania New York, New York Wilmington-Newark, Delaware
Riverside, California Fresno, California
$0-$5,500 $5,501-$11,500 $11,501-$18,700 Greater than $18,701 Cost Variations in Each Market
Source: Analysis of Blue Health Intelligence® (BHI®) data
4
This report includes claims for primary (non - Medicare) BCBS members incurred 36 months ending July 2013, paid through September 2013. Episode costs are based on total amount of procedure and ancillary costs for a period of time pre and post procedure. Costs are measured at a facility level based on their experience over 36 months. The data also limits scope of episodes it will measure in order to ensure comparability, creating a "normal" cohort. Episodes were dropped from the data where applicable, for patient age (<18 or >65), complicating conditions (cancer, HIV) and other criteria.
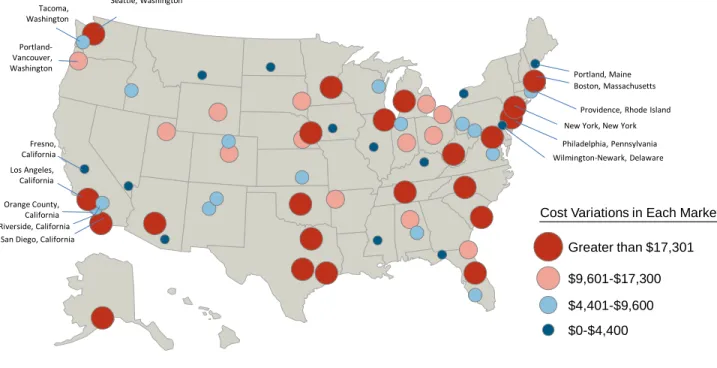
Figure 2: Cost Variation for Hip Replacement Procedures Across the Country
Appendix A contains a list of plotted markets below, showing the Minimum Cost, Average Cost,
Maximum Cost, and Percent Differential between the Minimum and Maximum.
costs)
$0-$4,400 $4,401-$9,600 $9,601-$17,300 Greater than $17,301 Cost Variations in Each Market Seattle, Washington
Tacoma, Washington Portland-Vancouver, Washington
Los Angeles, California
San Diego, California Orange County,
California
New York, New York Wilmington-Newark, Delaware
Riverside, California
Philadelphia, Pennsylvania Boston, Massachusetts
Providence, Rhode Island Portland, Maine
Fresno, California
Source: Analysis of Blue Health Intelligence® (BHI®) data
The average typical cost for a total knee replacement procedure was $31,124 in 64 markets that were studied. However, it could cost as little as $11,317 in Montgomery, Alabama, and as high as $69,654 in New York, New York. Within a market, extreme cost variation also exists. In Dallas, Texas, a knee
replacement could cost between $16,772 and $61,585 (267 percent cost variation) depending on the hospital. Similar trends also were seen for the average typical cost for a total hip replacement procedure, which
averaged $30,124. However, it could cost as little as $11,327 in Birmingham, Alabama, and as much as $73,987 in Boston,5 Massachusetts, which had the greatest variance within a given market, with costs as low as $17,910 (313 percent cost variation).
5
Data was analyzed based on Metropolitan Service Areas (MSAs) in accordance with Census data, which can include large population areas that may cross state lines. The Boston MSA, for example, includes areas within New Hampshire and Rhode Island. For more information, visit: http://www2.census.gov/geo/maps/metroarea/stcbsa_pg/Feb2013/cbsa2013_MA.pdf.
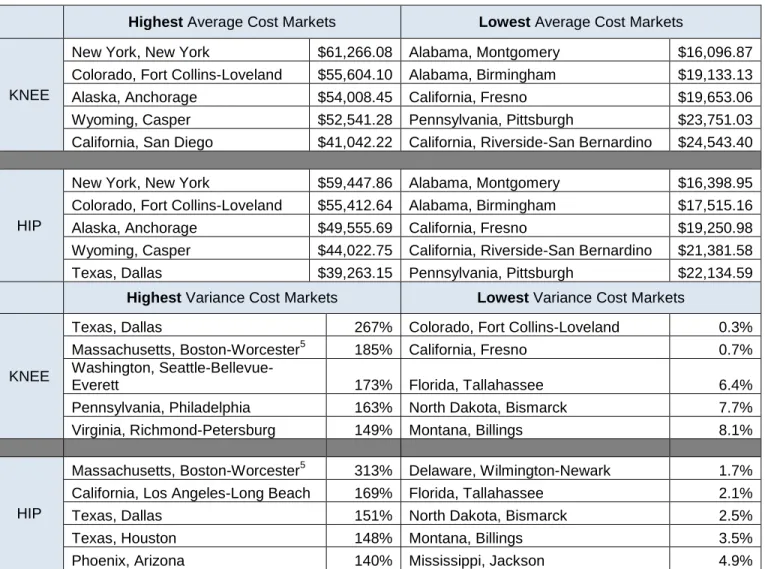
Figure 3: Top 5, Highest and Lowest Average Cost Markets and Variance Cost Markets for Knee
and Hip Replacement
Highest Average Cost Markets Lowest Average Cost Markets
KNEE
New York, New York $61,266.08 Alabama, Montgomery $16,096.87
Colorado, Fort Collins-Loveland $55,604.10 Alabama, Birmingham $19,133.13
Alaska, Anchorage $54,008.45 California, Fresno $19,653.06
Wyoming, Casper $52,541.28 Pennsylvania, Pittsburgh $23,751.03
California, San Diego $41,042.22 California, Riverside-San Bernardino $24,543.40
HIP
New York, New York $59,447.86 Alabama, Montgomery $16,398.95
Colorado, Fort Collins-Loveland $55,412.64 Alabama, Birmingham $17,515.16
Alaska, Anchorage $49,555.69 California, Fresno $19,250.98
Wyoming, Casper $44,022.75 California, Riverside-San Bernardino $21,381.58
Texas, Dallas $39,263.15 Pennsylvania, Pittsburgh $22,134.59
Highest Variance Cost Markets Lowest Variance Cost Markets
KNEE
Texas, Dallas 267% Colorado, Fort Collins-Loveland 0.3%
Massachusetts, Boston-Worcester5 185% California, Fresno 0.7%
Washington,
Seattle-Bellevue-Everett 173% Florida, Tallahassee 6.4%
Pennsylvania, Philadelphia 163% North Dakota, Bismarck 7.7%
Virginia, Richmond-Petersburg 149% Montana, Billings 8.1%
HIP
Massachusetts, Boston-Worcester5 313% Delaware, Wilmington-Newark 1.7% California, Los Angeles-Long Beach 169% Florida, Tallahassee 2.1%
Texas, Dallas 151% North Dakota, Bismarck 2.5%
Texas, Houston 148% Montana, Billings 3.5%
Phoenix, Arizona 140% Mississippi, Jackson 4.9%
Source: Analysis of Blue Health Intelligence® (BHI®) data
It is important to note that a lack of cost variation within a market can negatively impact consumers when prices are consistently high. For example, in Fort Collins-Loveland, Colorado, there was a less than one percent difference in the price for a total knee replacement procedure, but the average price of $55,686 is more than $24,562 higher than the average cost for all 64 markets in the study. In the same market, where there is a relatively small 16 percent price variation for a total hip replacement procedure, ($50,213 versus $58,189), the average price of $55,413is more than $25,289 higher than the average cost for the 64 markets.
Conclusion: Cost Variation
Blue Cross Blue Shield, The Health of America Reportanalyzed cost variation across the Blue System and confirmed the prevalence of wide price disparities for knee and hip replacement surgeries within and between markets. As more consumers shop for healthcare, insurance companies must use their data to empower consumers and employers with information that demonstrates cost and quality of doctors and hospitals and helps them find the highest value options for care.
About Blue Cross Blue Shield, The Health of America Report
Blue Cross Blue Shield, The Health of America Report is a collaboration between the Blue Cross Blue Shield Association and Blue Health Intelligence that aims to mine a market-leading claims database to uncover key trends and provide insight into healthcare dynamics and ultimately support improved quality and affordability for Americans.
About the Blue Cross Blue Shield Association
The Blue Cross Blue Shield Association is a national federation of 37 independent, community-based and locally operated Blue Cross and Blue Shield companies that collectively provide healthcare coverage for nearly 105 million members — one in three Americans. For more information on the Blue Cross Blue Shield Association and its member companies, please visit bcbs.com.
About Blue Health Intelligence
Health Intelligence Company is the nation’s premier health intelligence resource, delivering data-driven insights about healthcare trends and best practices, resulting in healthier lives and more affordable access to safe and effective care. HIC accesses healthcare claims data from more than 140 million individuals nationwide, collected over nine years, in a safe, HIPAA compliant and secure database. The resulting conformed, reliable data set has the broadest, deepest pool of integrated medical and pharmacy claims, reflecting medical utilization in every ZIP code. Health Intelligence Company, LLC operates under the trade name Blue Health Intelligence (BHI) and is an Independent Licensee of the Blue Cross and Blue Shield Association. For more information, visit
APPENDIX A – COST VARIATION
TYPICAL COST VARIATION FOR TOTAL KNEE REPLACEMENT PROCEDURES ACROSS THE
COUNTRY
Market Min Max
% Differential b/t Min and
Max
Average Cost
Texas, Dallas $ 16,772.02 $ 61,584.86 267% $ 39,622.96
Massachusetts, Boston-Worcester5 $ 18,469.56 $ 52,690.90 185% $ 26,899.92
Washington, Seattle-Bellevue-Everett $ 22,570.21 $ 61,609.86 173% $ 33,949.63
Pennsylvania, Philadelphia $ 17,659.36 $ 46,460.93 163% $ 30,564.67
Virginia, Richmond-Petersburg $ 15,372.94 $ 38,206.63 149% $ 29,617.34
Texas, Houston $ 17,413.32 $ 42,704.18 145% $ 33,724.42
Minnesota, Minneapolis-St. Paul $ 20,401.37 $ 48,960.90 140% $ 31,166.10
South Carolina, Charleston $ 27,255.51 $ 58,418.00 114% $ 40,169.56
Texas, Austin-San Marcos $ 21,581.53 $ 45,640.43 111% $ 37,308.94
Oklahoma, Oklahoma City $ 22,103.39 $ 45,895.35 108% $ 30,076.77
Illinois, Chicago $ 23,579.62 $ 47,255.15 100% $ 34,701.28
California, Orange County $ 18,179.15 $ 36,388.63 100% $ 27,228.70
Arizona, Phoenix-Mesa $ 19,982.35 $ 39,059.30 95% $ 30,270.73
Michigan, Grand Rapids-Muskegon $ 19,456.97 $ 37,840.51 94% $ 30,326.74
West Virginia, Charleston $ 25,325.17 $ 49,045.86 94% $ 35,954.63
Michigan, Detroit $ 29,337.41 $ 55,417.95 89% $ 36,195.64
Florida, Orlando $ 23,219.18 $ 43,583.37 88% $ 30,853.76
Alabama, Montgomery $ 11,316.88 $ 20,984.43 85% $ 16,096.87
Ohio, Cleveland-Lorain-Elyria $ 20,689.94 $ 38,155.49 84% $ 27,307.64
Tennessee, Nashville $ 27,752.78 $ 49,138.48 77% $ 37,859.09
Florida, Jacksonville $ 23,440.11 $ 40,748.78 74% $ 32,205.74
Washington, Portland-Vancouver $ 26,059.53 $ 44,063.62 69% $ 33,512.20
Nebraska, Omaha $ 27,771.17 $ 46,248.25 67% $ 34,929.31
Washington, Olympia $ 25,296.50 $ 42,037.40 66% $ 33,888.06
North Carolina, Charlotte-Gastonia $ 25,305.39 $ 41,887.25 66% $ 33,575.27
California, Los Angeles-Long Beach $ 20,868.76 $ 33,924.47 63% $ 25,989.89
District Of Columbia, Washington $ 25,259.13 $ 39,212.40 55% $ 31,660.27
New Mexico, Santa Fe $ 23,803.47 $ 36,514.21 53% $ 30,498.82
Nebraska, Lincoln $ 29,597.64 $ 44,761.88 51% $ 38,191.84
Indiana, Indianapolis $ 25,171.79 $ 37,707.28 50% $ 30,452.80
Colorado, Denver $ 26,112.63 $ 39,103.56 50% $ 31,522.07
Alabama, Birmingham $ 16,445.47 $ 23,541.40 43% $ 19,133.13
Alaska, Anchorage $ 44,901.88 $ 63,115.02 41% $ 54,008.45
Pennsylvania, Pittsburgh $ 19,307.04 $ 26,973.11 40% $ 23,751.03
Kansas, Wichita $ 25,011.30 $ 34,885.25 39% $ 30,864.63
Utah, Salt Lake City-Ogden $ 31,152.52 $ 42,586.06 37% $ 36,762.03
Wisconsin, Green Bay $ 32,828.18 $ 44,503.74 36% $ 37,638.24
Market Min Max
% Differential b/t Min and
Max
Average Cost
Nevada, Las Vegas $ 23,688.85 $ 31,800.13 34% $ 26,501.68
South Dakota, Sioux Falls $ 24,939.41 $ 32,312.70 30% $ 29,006.45
New Mexico, Albuquerque $ 29,393.57 $ 37,306.80 27% $ 32,626.11
Maine, Portland $ 26,408.55 $ 33,072.73 25% $ 29,626.14
Rhode Island, Providence-Warwick $ 26,613.78 $ 33,017.56 24% $ 29,858.84
California, Riverside-San Bernardino $ 22,795.58 $ 28,222.58 24% $ 24,543.40
New York, New York $ 56,945.17 $ 69,654.04 22% $ 61,266.08
Kentucky, Lexington $ 23,078.17 $ 28,183.52 22% $ 26,175.48
Wyoming, Casper $ 47,570.34 $ 58,036.24 22% $ 52,541.28
Mississippi, Jackson $ 29,148.11 $ 35,102.20 20% $ 32,913.03
Maryland, Cumberland $ 26,924.05 $ 32,353.63 20% $ 29,638.84
Ohio, Columbus $ 26,071.91 $ 31,317.51 20% $ 28,777.51
Iowa, Des Moines $ 23,621.36 $ 28,322.10 20% $ 26,334.43
Illinois, Springfield $ 29,308.58 $ 35,019.23 19% $ 31,463.15
Idaho, Boise City $ 31,212.59 $ 37,070.25 19% $ 33,840.23
Arkansas, Fayetteville-Springdale $ 23,365.93 $ 27,698.10 19% $ 26,129.04
New York, Buffalo-Niagara Falls $ 25,298.32 $ 29,841.48 18% $ 27,808.06
Arizona, Tucson $ 23,329.81 $ 26,861.26 15% $ 24,823.39
California, San Diego $ 37,662.79 $ 43,133.27 15% $ 41,042.22
Indiana, South Bend $ 34,120.16 $ 39,046.80 14% $ 36,583.48
Delaware, Wilmington-Newark $ 31,080.34 $ 34,243.05 10% $ 32,067.90
Montana, Billings $ 32,991.64 $ 35,667.21 8% $ 34,329.43
North Dakota, Bismarck $ 24,948.08 $ 26,865.00 8% $ 25,759.29
Florida, Tallahassee $ 31,539.05 $ 33,563.13 6% $ 32,551.09
California, Fresno $ 19,581.79 $ 19,724.34 1% $ 19,653.06
Colorado, Fort Collins-Loveland $ 55,521.99 $ 55,686.21 0.3% $ 55,604.10
TYPICAL COST VARIATION FOR TOTAL HIP REPLACEMENT PROCEDURES ACROSS THE
COUNTRY
Market Min Max % Differential
b/t Min and Max
Average Cost
Massachusetts, Boston-Worcester5 $17,910.25 $73,987.05 313% $26,591.55
California, Los Angeles-Long Beach $17,260.37 $46,447.62 169% $26,434.66
Texas, Dallas $25,906.97 $64,933.84 151% $39,263.15
Texas, Houston $18,124.55 $45,022.09 148% $32,139.31
Arizona, Phoenix-Mesa $18,605.22 $44,682.71 140% $29,767.96
Minnesota, Minneapolis-St. Paul $19,246.57 $45,150.46 135% $27,905.71
Nebraska, Omaha $25,187.46 $56,460.35 124% $33,821.19
Pennsylvania, Philadelphia $21,490.60 $45,559.94 112% $31,066.57
Michigan, Grand Rapids-Muskegon $18,294.49 $38,640.43 111% $28,651.99
District Of Columbia, Washington $22,495.06 $45,779.49 104% $31,294.74
West Virginia, Charleston $23,030.99 $46,301.23 101% $33,776.23
California, San Diego $23,696.63 $47,386.69 100% $34,235.97
Oklahoma, Oklahoma City $20,751.30 $41,422.16 100% $30,408.85
Washington, Seattle-Bellevue-Everett $18,509.91 $36,634.38 98% $30,469.90
Market Min Max % Differential b/t Min and
Max
Average Cost
Florida, Orlando $19,781.39 $37,449.03 89% $27,447.72
Illinois, Chicago $25,104.07 $47,460.36 89% $32,845.46
Texas, Austin-San Marcos $23,579.53 $43,135.18 83% $35,633.96
North Carolina, Charlotte-Gastonia $24,207.50 $43,030.95 78% $33,205.44
South Carolina, Charleston $27,506.73 $46,281.22 68% $36,617.42
Alabama, Montgomery $11,943.22 $19,864.30 66% $16,398.95
Tennessee, Nashville $26,911.78 $44,753.06 66% $35,899.32
Alaska, Anchorage $39,063.41 $64,695.89 66% $49,555.69
Arkansas, Fayetteville-Springdale $16,958.13 $27,364.90 61% $23,424.55
Michigan, Detroit $28,655.48 $45,918.99 60% $35,381.26
Florida, Jacksonville $23,371.43 $36,454.23 56% $30,222.81
Ohio, Columbus $24,305.22 $37,501.55 54% $27,422.69
Ohio, Cleveland-Lorain-Elyria $22,167.97 $33,937.25 53% $27,088.58
Colorado, Denver $22,861.38 $33,848.12 48% $30,390.38
New York, New York $46,889.74 $69,235.92 48% $59,447.86
California, Orange County $19,607.59 $28,657.70 46% $25,154.60
Indiana, Indianapolis $22,961.29 $33,558.15 46% $28,128.45
Washington, Portland-Vancouver $28,887.11 $42,055.32 46% $32,890.60
Utah, Salt Lake City-Ogden $28,702.56 $41,716.30 45% $34,400.61
South Dakota, Sioux Falls $23,979.11 $34,408.02 43% $27,248.56
Washington, Olympia $22,723.92 $32,036.38 41% $27,380.15
Kansas, Wichita $23,556.43 $33,034.36 40% $29,588.26
Nebraska, Lincoln $26,557.85 $36,656.97 38% $31,571.06
Idaho, Boise City $26,802.23 $35,993.27 34% $30,652.34
Pennsylvania, Pittsburgh $19,456.49 $25,696.54 32% $22,134.59
Wisconsin, Green Bay $28,389.43 $36,959.89 30% $32,783.49
New Mexico, Albuquerque $29,452.72 $38,340.50 30% $32,038.94
Maryland, Cumberland $26,223.66 $33,642.55 28% $29,933.11
Wyoming, Casper $38,569.88 $49,475.63 28% $44,022.75
Virginia, Richmond-Petersburg $28,090.39 $35,354.57 26% $30,865.14
Rhode Island, Providence-Warwick $26,819.40 $33,456.23 25% $29,806.47
California, Riverside-San Bernardino $19,214.48 $23,718.55 23% $21,381.58
Florida, Fort Myers-Cape Coral/Punta Gorda $25,790.87 $31,644.16 23% $28,872.39
Arizona, Tucson $21,945.26 $26,332.74 20% $24,547.35
Iowa, Des Moines $21,315.20 $25,420.86 19% $23,701.27
New Mexico, Santa Fe $30,637.83 $35,689.48 16% $33,163.66
Colorado, Fort Collins-Loveland $50,212.60 $58,188.66 16% $55,412.64
Kentucky, Lexington $21,860.06 $25,089.21 15% $23,366.93
Indiana, South Bend $31,701.37 $36,197.30 14% $33,949.34
Nevada, Las Vegas $22,103.27 $24,300.95 10% $23,529.85
New York, Buffalo-Niagara Falls $28,218.79 $30,694.83 9% $29,385.04
Illinois, Springfield $29,256.67 $31,620.42 8% $30,438.55
California, Fresno $18,531.09 $19,970.88 8% $19,250.98
Maine, Portland $26,363.17 $28,138.17 7% $27,250.67
Mississippi, Jackson $32,687.48 $34,279.50 5% $33,483.49
Montana, Billings $32,123.09 $33,254.04 4% $32,688.57
North Dakota, Bismarck $23,798.54 $24,385.29 2% $24,091.92
Florida, Tallahassee $29,890.28 $30,510.37 2% $30,200.32
Delaware, Wilmington-Newark $32,031.93 $32,579.84 2% $32,385.60