FACULTY DEVELOPMENT AND
INSTRUCTIONAL DESIGN
CENTER
2005-2010
ASSESSMENT REPORT
2005
www.niu.edu/facdev
Table of Contents
Section Page
I. History . . . . . . 1
II. Mission, Vision and Objectives . 2
III. Methods . . . 4
IV. Evidence . . . . . . . 7
V. Analysis of Results . . . . 19
VI. Use of Results . . . 21
VII. Further Information Needed and
Timeline . . . 23
VIII. Resources Needed . . . . 23
Appendices Page
A. Program Evaluation Form and
Follow‐up Feedback Form . . 24
B. Program Self Assessment Form . 27
C. 2005 – 2010 Programs, Attendance
& Contact Hours . . . . . 29
D. Faculty and SPS Development
Grant Final Report Format . . 45 E. Sample Logs of Collaboratory and
Digital Multimedia Studio Use . 47
F. Annual Report of the Faculty
Development Advisory Committee 50
G. Faculty and Staff Campuswide
Survey Questions . . . 53
H. Graduate and Staff Campuswide
Survey Questions . . . . . 57 I. New Faculty Needs and Interests
Survey Fall 2008 . . . 60 J. Teaching Assistant Orientation
Pre‐Survey . . . 62
K. Peer Observations Feedback Form 64 Foreword In this report, Faculty Development and Instructional Design Center’s assessment of programs, services and resources offered to faculty, supportive professional staff, academic administrators, and graduate teaching assistants during 2005‐2010 are summarized. The report includes details of assessment methods, objectives and their targets, evidence, and analysis and use of results. The appendices of the report contain samples of evaluation instruments used in the assessment process. Apart from the 5‐year assessment reports, we have also been submitting annual assessment reports by compiling and analyzing results from our ongoing assessment efforts so that the information is continuously documented and is readily available for future use and enables the immediate application of results in subsequent years for continuous improvement purposes. Center staff have already been using assessment results from 2005‐2010 to improve our programs, resources, and services, and identify opportunities to serve the professional development needs of faculty, supportive professional staff, administrators and teaching assistants better. This effort would not have been possible without the active support of all our staff, especially Brenda Hodges, our Program Coordinator, who assisted in the preparation of this report. We sincerely hope our assessment efforts are meeting your and the University Assessment Panel’s expectations, and if you have any recommendations for improving our assessment process, please let us know. Thank you for your continued support of our activities. Sincerely, Murali Krishnamurthi Director
I. HISTORY
The Faculty Development Office established in the 1980s was reorganized in August 1998 and renamed “Faculty Development and Instructional Design Center.” The reorganized Center was temporarily located in Gilbert Hall and was charged with providing comprehensive support on teaching effectiveness and technology integration to faculty and academic SPS, and continuing the faculty development grants and SPS development grants and the New Faculty Mentoring Program. The Center reports to the Executive Vice‐President and Provost and is advised by the Faculty Development Advisory Committee, which has representatives from all the academic colleges, University Libraries, and the SPS body.
From August 1999, Center staff began offering Teaching Effectiveness Institutes at the beginning of every fall and spring semesters, and numerous programs of varying duration on teaching effectiveness, technology integration, professional development, and research and scholarly activities for faculty and teaching staff. Center staff also began coordinating the New Faculty Forum, a welcoming event for new tenure‐track faculty, for the Office of the Provost.
In 1999, Center staff developed and distributed a comprehensive Instructional Guide for University
Faculty and the newsletter Spectrum for faculty and academic SPS. During fall 1999, Center staff
established a four‐station Collaboratory and a four‐station Digital Multimedia Studio in Gilbert Hall for faculty to experiment with instructional technologies. During 2000‐01, the Center was charged with training and supporting faculty on Blackboard Web course management system and online teaching.
Due to the budget challenges at NIU during 2001‐2003, the “Teaching Assistant Training and
Development Office” in the Graduate School was closed and its responsibilities were transferred to the Center in July 2003. Since Fall 2003, Center staff have been offering a daylong Teaching Assistant (TA) Orientation at the beginning of every fall semester and a number of programs of varying duration on teaching effectiveness and technology integration for TAs throughout the year. Center staff expanded
the Instructional Guide for University Faculty to include information for TAs and began distributing the
TA Connections newsletter to all graduate assistants at NIU. Center staff have also been offering the
Graduate Teaching Certificate to interested teaching assistants. In 2005, Center staff established the
Outstanding Graduate Teaching Assistant Awards to recognize the contributions of teaching assistants
to the teaching mission of NIU.
In 2003, Center staff began organizing development programs for department chairs and school Directors every fall and spring semester at the request of the Office of the Provost. Since 2006, Center staff have also been organizing the “New Academic Administrator Forum,” a half‐day program, to orient new chairs and directors to their administrative responsibilities. In August 2008, Center staff expanded this program to a full‐day due to the demand from new department chairs for more information to help them get started with their responsibilities.
In April 2005, the Center was allocated permanent space on the third floor of Adams Hall where Center staff have set up an 11‐station Collaboratory, a 5‐station Digital Multimedia Studio, and a Teaching Resource Room with videos, DVDs and books on teaching and related topics.
Since 2006, Center staff have been offering training programs on a number of new technologies such as the SMART Pen (the interactive panel used in Smart Classrooms at NIU), CPS eInstruction Clickers, Podcasting, Blackboard Content Collection System, online tutorials, and the Wimba Online Collaboration Suite.
Center staff offer approximately 150 programs annually on a range of topics to nearly 1,500 faculty, SPS, GTAs, and academic administrators. In addition, Center staff offer numerous consultations and
resources on teaching effectiveness and technology integration, and professional development grants to faculty and SPS.
In 2000, Center staff developed and implemented a comprehensive assessment plan to evaluate its programs and services, and use the results to identify the development needs of faculty, SPS, TAs and administrators, and improve its programs and services. Center staff submit to the Provost’s Office an annual assessment report and an annual report every fall semester for the previous academic year. Every five years, Center staff submit a 5‐year assessment report. Center’s reports and additional information about its programs, resources, and services can be found at http://www.facdev.niu.edu.
II. MISSION, VISION, AND OBJECTIVES
Mission. The mission of Faculty Development and Instructional Design Center is to support faculty, academic supportive professional staff (SPS), graduate teaching assistants (GTAs), and academic administrators through a variety of programs, resources, and services that support Northern Illinois University’s (NIU) mission on teaching, research, and scholarly activities.
Vision. The Center envisions an enriched academic environment at NIU that facilitates and promotes effective teaching, supports professional development, stimulates research and scholarly activities, and encourages the integration of instructional technologies.
Measureable Objectives and Targets. These major responsibilities have been translated into five major program objectives for the purpose of program assessment. Their details and targets are listed below:
1. Provide opportunities for effective teaching:
1.1 Offer a range of programs on teaching effectiveness for all those who provide direct instruction. a) Programs on a range of teaching topics of different duration will be offered for faculty,
teaching staff, instructors, and teaching assistants.
b) 80% of participants will indicate the teaching effectiveness programs they participated will impact their teaching and other student‐related activities.
c) 80% of participants will indicate that the teaching effectiveness programs will have potential benefit to students as a result of participants’ participating in the program.
1.2 Offer teaching‐related consultations and classroom observations.
a) 100% of those requesting teaching‐related consultations and classroom observations will be offered those services.
2. Promote research and scholarly activities:
2.1 Collaborate with campus units to offer programs on research and scholarly activities.
a) Offer at least 1 program per year on scholarly activities with the support of other campus units.
2.2 Pursue and collaborate on sponsored projects on faculty development issues.
b) Submit at least 1 grant proposal per year in collaboration with others campus units.
3. Facilitate the integration of instructional technologies:
3.1 Offer a range of programs on integrating a wide spectrum of technologies into teaching. a) Programs on a range of topics on technology integration of different duration will be offered
for faculty, teaching staff, instructors, and teaching assistants.
b) 80% of participants will indicate the technology integration programs they participated will positively impact their teaching and other student‐related activities.
c) 80% of participants will indicate that the technology integration programs will have potential benefit to students as a result of participants’ participating in the program.
3.2 Offer technology‐related consultations.
a) 100% of those requesting teaching‐related consultations and classroom observations will be offered those services.
3.3 Collaborate with other units to coordinate support for those integrating instructional technologies in their teaching.
a) Meet regularly with campus units involved in technology integration issues and collaborate with them on technology integration needs of faculty, teaching staff, instructors, and teaching assistants.
4. Provide professional development opportunities:
4.1Arrange mentors for those who request such support.
a) Arrange mentors for 100% of new faculty who request mentors.
b) 80% of those who received mentoring support will indicate that the mentoring program met their professional development needs.
4.2Offer professional development grants to faculty and SPS as budget permits.
a) All professional development grants awarded will meet the grant criteria and guidelines. b) 90% of grant recipients will submit final reports indicating grant outcomes.
c) 85% of grant recipients who submitted final reports will indicate that the grants met their professional development objectives and will result in positive benefits to their students.
4.3Host professional development programs for faculty, teaching assistants, and academic administrators in collaboration with other campus units as necessary.
a) Orientation and development programs will be offered for faculty, teaching assistants, and academic administrators with the support of other campus units.
b) 80% of participants will indicate the professional development programs they participated will positively impact their professional responsibilities.
5. Serve as a referral service and as a resource unit for faculty, teaching staff, instructors, teaching assistants, and academic administrators.
5.1 Serve as referral service to other units on campus.
a) 100% of requests for referrals will be responded by Center staff.
5.2 Provide access to resources (online tutorials, web resources, videos, etc.) on teaching, technology integration, professional development, and related topics.
a) 90% of requests for access to resources will be provided by Center staff.
5.3 Provide a laboratory environment to experiment with instructional technologies.
a) 90% of requests for using the Center’s Collaboratory and Digital Multimedia Studio will be provided by Center staff.
5.4 Disseminate information on teaching, technology and related programs and resources through the web as well as through newsletters and other media.
a) 100% of faculty, supportive professional staff, graduate teaching assistants, and academic administrators at NIU will receive information through different means.
The Center’s audience includes tenured and tenure‐track faculty, instructors, academic SPS, adjunct faculty, teaching civil service staff, academic administrators, and graduate teaching assistants (GTA). Therefore, some objectives may apply only to a particular audience.
The rationale for the targets for some of the objectives is as follows:
For a majority of major teaching effectiveness programs and professional development programs and services (such as mentoring), Center staff rely on NIU faculty and staff (who volunteer their time to present), and outside presenters, and therefore, the program satisfaction target has been set at 80% to accommodate the variations among these invited presenters.
Even thought a majority of the technology integration programs are delivered by Center staff, the program satisfaction target has still been set at 80% to accommodate the non‐teaching participants (support staff) who attend such programs and choose “not applicable” in program evaluation questions related to programs’ impact on their teaching or benefit to students.
Targets have been set at 85% to 100% for programs and services that Center staff are completely responsible for and can continuously improve based on program evaluations and feedback.
Center staff review and refine the targets on an annual basis as part of the assessment plan.
III. METHODS
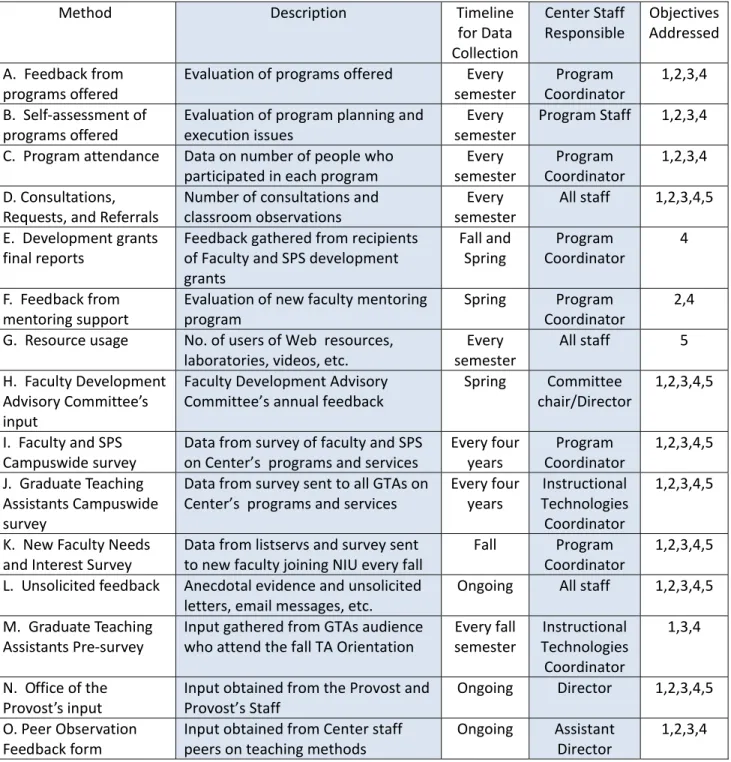
For the program objectives mentioned in the previous section, Center staff have identified appropriate assessment methods and have established suitable timelines. The assessment timelines have been spread out over semesters or years as necessary to make sure that the audience assessed is not bombarded with too many surveys, and that the assessment effort is manageable for the Center staff. Center Director has also assigned a staff member to be responsible for each assessment method. Table 1 lists the assessment methods employed, a brief description of each assessment method, the assessment timelines, Center staff responsible, and the objectives that each method addresses. Some methods address more than one objective.
As the Center’s primary responsibility is to offer programs, resources, and services to instructional personnel at NIU, the Center’s assessment effort focuses mainly on their satisfaction with the programs they participate, and their perceptions on potential impact on their teaching and related activities and benefits to their students. Center’s assessment effort cannot directly measure if teaching and learning have improved at NIU as a result of instructional personnel’s participation in Center’s programs. However, program satisfaction and perception of potential impact and benefit are valid measures of assessing Center’s programs, resources, and services.
Some of the assessment methods indicated in Table 1 may appear to be unrelated to assessing program satisfaction and perception of potential impact but those assessment methods are necessary for
providing feedback to Center staff, which can result in improvement of programs, resources, and services that increase program satisfaction rate of participants and the potential impact and benefits.
Table 1. Assessment methods, timeline, responsibilities and objectives
Method Description Timeline
for Data Collection Center Staff Responsible Objectives Addressed A. Feedback from programs offered Evaluation of programs offered Every semester Program Coordinator 1,2,3,4 B. Self‐assessment of programs offered Evaluation of program planning and execution issues Every semester Program Staff 1,2,3,4 C. Program attendance Data on number of people who participated in each program Every semester Program Coordinator 1,2,3,4 D. Consultations, Requests, and Referrals Number of consultations and classroom observations Every semester All staff 1,2,3,4,5 E. Development grants final reports Feedback gathered from recipients of Faculty and SPS development grants Fall and Spring Program Coordinator 4 F. Feedback from mentoring support Evaluation of new faculty mentoring program Spring Program Coordinator 2,4 G. Resource usage No. of users of Web resources, laboratories, videos, etc. Every semester All staff 5 H. Faculty Development Advisory Committee’s input Faculty Development Advisory Committee’s annual feedback Spring Committee chair/Director 1,2,3,4,5 I. Faculty and SPS Campuswide survey Data from survey of faculty and SPS on Center’s programs and services Every four years Program Coordinator 1,2,3,4,5 J. Graduate Teaching Assistants Campuswide survey Data from survey sent to all GTAs on Center’s programs and services Every four years Instructional Technologies Coordinator 1,2,3,4,5 K. New Faculty Needs and Interest Survey Data from listservs and survey sent to new faculty joining NIU every fall Fall Program Coordinator 1,2,3,4,5 L. Unsolicited feedback Anecdotal evidence and unsolicited letters, email messages, etc.
Ongoing All staff 1,2,3,4,5 M. Graduate Teaching Assistants Pre‐survey Input gathered from GTAs audience who attend the fall TA Orientation Every fall semester Instructional Technologies Coordinator 1,3,4 N. Office of the Provost’s input Input obtained from the Provost and Provost’s Staff
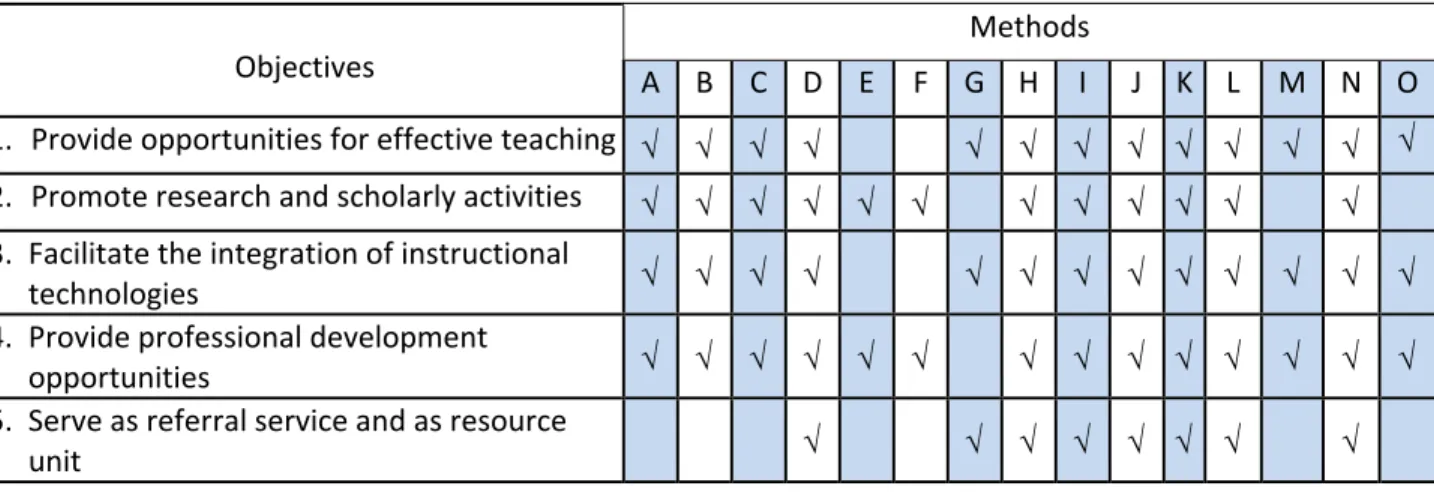
Ongoing Director 1,2,3,4,5 O. Peer Observation Feedback form Input obtained from Center staff peers on teaching methods Ongoing Assistant Director 1,2,3,4 Table 2 lists which assessment methods address each program objective. It can be seen from Tables 1 and 2 that the Center uses multiple methods for each objective and collects data from multiple sources on an ongoing basis to ensure valid assessment of its programs, resources and services. Figure 1 illustrates the timeline of major assessment methods and how they are spread out during the year to prevent faculty, staff, and teaching assistants from having to respond to numerous surveys, and also to help Center staff manage the data collection and analysis effort over three semesters each year instead of all at once.
Figure 1. Illustration of the timeline of assessment activities during the year Teaching Effectiveness Institute Post
Program Evaluation
Teaching Assistant Orientation Pre- Program Survey
Teaching Assistant Orientation Post- Program Evaluation
Teaching Assistant Orientation 4-month follow-up evaluation
New Faculty Needs and Interests Survey
Faculty Development and SPS Development Grant Final Reports
Teaching Effectiveness Institute 6-month Follow-up Evaluation
Feedback From New Faculty Mentoring Program
Faculty Development and SPS Development Grant Final Reports Faculty Development Advisory Committee’s Input (Annual Report)
Faculty and SPS Campuswide Survey (every 4 years)
Graduate Teaching Assistants Campuswide Survey (every 4 years) Participants’ Feedback From Regular Programs Offered
Self-Assessment of Programs Offered
Program Attendance Data Collection
Resource Usage Data Collection
Consultations Data Collection
Participants’ Feedback From Regular Programs Offered
Self-Assessment of Programs Offered
Program Attendance Data Collection
Resource Usage Data Collection
Consultations Data Collection
Participants’ Feedback From Regular Programs Offered
Self-Assessment of Programs Offered
Program Attendance Data Collection
Resource Usage Data Collection
Consultations Data Collection Blackboard Workshops Follow-up
Evaluation
Unsolicited Feedback Data Collection Peer Observation Feedback Data Collection
Table 2. Objectives addressed by assessment methods
Objectives
Methods
A B C D E F G H I J K L M N O 1. Provide opportunities for effective teaching 2. Promote research and scholarly activities 3. Facilitate the integration of instructional
technologies 4. Provide professional development
opportunities 5. Serve as referral service and as resource
unit
IV. EVIDENCE
A brief summary of results from the Center’s 2005‐2010 assessment effort is included in this section, and the summary includes descriptions of the activities and the findings. The assessment forms used for particular assessment activities referred in this section are included in the Appendices, and samples of assessment results are included as tables wherever applicable.
A. Feedback from programs offered
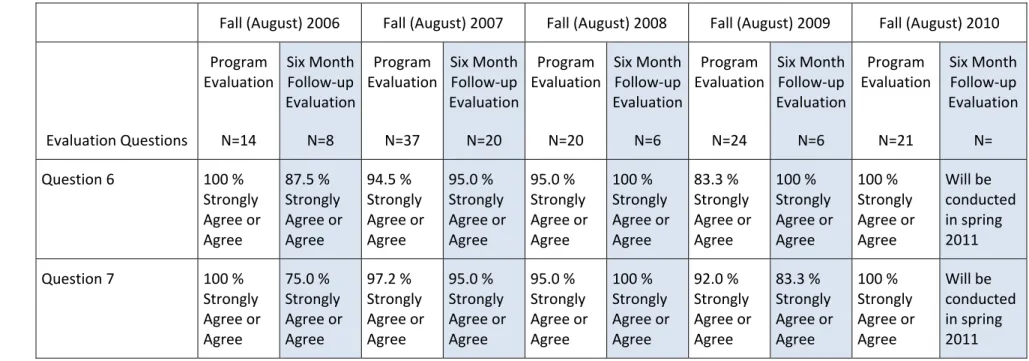
Activities: Since fall 1998, Center staff have been conducting evaluations at the end of each program by requesting participants’ feedback on the various aspects of each program as well as its impact on the intended audience and its benefits. Center staff have been using these program evaluations to assess if programs have been meeting audience’s needs, and to identify opportunities for improvement. Since 2006, Center staff have also been conducting follow‐up evaluations of major programs to assess the continuing impact of those programs 4 or 6 months after participants attended a particular major program. Program evaluation summaries have been tabulated and shared with program presenters and sponsors. Appendix A contains the Program Evaluation and the Program Follow‐up Feedback Forms. Findings: The program evaluation form administered at the end of each program contains 11 questions on various aspects of program organization and delivery, and 2 of those questions (Questions 6 and 7) are designed to obtain participants’ perception of program’s impact on their teaching and related activities, and potential benefit to students as a result of participating in the program. The program follow‐up feedback form also contains the same 2 questions to obtain participants’ feedback on the same two items 4 to 6 months after attending the program. The 2 questions and the program follow‐up feedback form were suggested by the Office of Assessment Services after the review of the previous 5‐ year assessment report, and since then Center staff have been using the program evaluation form with the 2 questions and the program follow‐up form to assess the ongoing impact of Center’s programs. Table 3 illustrates the results of program evaluation and program follow‐up feedback for the 2 questions for Fall Teaching Effectiveness Institute Day 1 during the past 5 years. Day 1 of the institute covers fundamental principles of effective instruction and Day 2 is usually a daylong workshop on a teaching topic of current interest delivered by an invited (non‐NIU) presenter. As the program on Day 1 is reasonably consistent from year to year and is presented entirely by NIU faculty and staff, it is more suited for comparison in terms of continuing impact on faculty and their students and identifying opportunities for improvement, and therefore, it is assessed for ongoing impact and benefits.
Table 3. Comparison of Teaching Effectiveness Institute Day 1 program evaluation and
six‐month follow‐up evaluation of participants’ perceptions during 2006‐2010
Fall (August) 2006 Fall (August) 2007 Fall (August) 2008 Fall (August) 2009 Fall (August) 2010
Evaluation Questions
Program
Evaluation
N=14
Six Month
Follow‐up
Evaluation N=8 Program Evaluation N=37
Six Month
Follow‐up
Evaluation N=20 Program Evaluation N=20
Six Month
Follow‐up
Evaluation N=6 Program Evaluation N=24
Six Month
Follow‐up
Evaluation N=6 Program Evaluation N=21
Six Month
Follow‐up
Evaluation N=
Question 6 100 %
Strongly
Agree or
Agree
87.5 %
Strongly
Agree or
Agree
94.5 %
Strongly
Agree or
Agree
95.0 %
Strongly
Agree or
Agree
95.0 %
Strongly
Agree or
Agree
100 %
Strongly
Agree or
Agree
83.3 %
Strongly
Agree or
Agree
100 %
Strongly
Agree or
Agree
100 %
Strongly
Agree or
Agree
Will be
conducted
in spring
2011
Question 7 100 %
Strongly
Agree or
Agree
75.0 %
Strongly
Agree or
Agree
97.2 %
Strongly
Agree or
Agree
95.0 %
Strongly
Agree or
Agree
95.0 %
Strongly
Agree or
Agree
100 %
Strongly
Agree or
Agree
92.0 %
Strongly
Agree or
Agree
83.3 %
Strongly
Agree or
Agree
100 %
Strongly
Agree or
Agree
Will be
conducted
in spring
2011
Program Evaluation Form:
Question 6. The concepts / techniques covered in this program are applicable in my teaching and other student‐related activities.
Question 7. My participation in this program has potential benefit to my students.
Program Follow‐up Feedback Form:
Question 6. The concepts / techniques covered in this program were applicable in my teaching and other student‐related activities.
The results summarized in Table 3 clearly indicate the continuing impact of the Teaching Effectiveness Institutes on participants and their potential benefit for students over the past 5 years, and demonstrate the quality of the program organized by the Center and presented by NIU faculty and staff. Apart from the Teaching Effectiveness Day 1 institute, other workshops, seminars, and institutes are not repeated exactly the same in format or content, and therefore, only the program evaluation forms, and not the follow‐up feedback form, with the same 2 questions are administered at the end of those programs, but the results are nevertheless analyzed and used for improvement. As the Teaching Effectiveness Institute focuses primarily on teaching and not technology, Center staff explored the possibility of conducting a program evaluation and program follow‐up feedback for a technology workshop, and decided that Blackboard I (Introduction to Blackboard) would be ideal for such analysis as this workshop is consistent in content and format, and offered several times a year to result in sufficient number of responses for program follow‐up feedback. Therefore, in 2008, Center staff implemented the program follow‐up feedback form also for Blackboard I workshops. Table 4 contains a summary of results for the 2 questions from Blackboard I (Introduction to Blackboard) program evaluations and follow‐up feedback on participants’ perception of program’s applicability to their teaching and related activities and benefit to their students during 2008‐2010. It should be clarified here that the results shown in Table 4 is a compilation of program evaluations and follow‐up feedback evaluation of all Blackboard I workshops offered on different dates by the Center during 2008‐2010. Other technology workshops are not offered as frequently as Blackboard I, and therefore, do not have sufficient total attendance to result in adequate follow‐up responses for comparison purposes. Table 4. Comparison of Blackboard I (Introduction to Blackboard) program evaluation and follow‐up evaluation of participants’ perceptions
2008‐2009 2009‐2010
Evaluation Questions Program Evaluation N=48 Follow‐up Evaluation N= 18 Program Evaluation N=27 Follow‐up Evaluation N= 6 Question 6. The concepts/techniques covered in this program are/were applicable in my teaching and related activities. 85.1 % Strongly Agree or Agree 94.45 % Strongly Agree or Agree 93.33 % Strongly Agree or Agree 100 % Strongly Agree or Agree Question 7. My participation in this program has potential benefit to/benefited my students. 85.1 % Strongly Agree or Agree 88.79 % Strongly Agree or Agree 90.95 % Strongly Agree or Agree 83.33 % Strongly Agree or Agree The results summarized in Table 4 clearly show that participants found the Blackboard I workshops applicable to their teaching and related activities, and their participation in the Blackboard I workshop benefited their students. It should be noted that some participants who attend Blackboard workshops are support staff, and therefore, they do not teach. However, they attend the workshop to learn to use Blackboard to perform support functions, and therefore, select “not applicable” for questions 6 and 7. The overall program evaluation results from the Blackboard I workshops are fairly consistent with the program evaluation results from the Teaching Effectiveness Institute. Other technology workshops and programs are also evaluated by Center using the program evaluation form on an ongoing basis and the results are analyzed to identify opportunities for improvement.
B. Self‐assessment of programs offered
Activities: Along with assessing participants’ feedback on presenters’ delivery, program arrangements, and perception of impact on their teaching and benefit to students, Center staff realized the importance of assessing effective planning and execution of major programs. During 2005‐2010, Center staff continued to complete self‐assessment forms and document various aspects of planning and executing major programs. The feedback from the self‐assessments was shared with the Director, Assistant Director, and Program Coordinator for analyzing the results and continuously improving the programs and services. Appendix B contains the self‐assessment form.
Findings: During 2005‐2010, information obtained from program self‐assessment was analyzed and used by Center staff for improving subsequent offerings of major programs. Self assessment feedback helped Center staff to consider such issues as streamlining the program participants’ check‐in process, monitoring the flow of participants in the Blackhawk cafeteria during lunch, using listservs to distribute information instead of sending paper copies by campus mail, and requesting new faculty names directly from academic departments in order to receive more accurate information. Beginning in fall 2008, Center staff also decided to assign a graduate assistant record all fall TA Orientation registrations, which allowed the department secretary more time to assist with the numerous major programs that are scheduled in August. The changes implemented based on the self‐assessment of programs enabled the programs to run more smoothly and saved considerable time during 2005‐2010, thus resulting in participants’ impression that the programs were organized and delivered effortlessly by the Center!
C. Program attendance
Activities: Since the establishment of the Center in fall 1998, Center staff have been recording program attendance to analyze issues such as participants’ interest in attending the Center’s programs, demand for certain types of programs, and trends in program participation. Table 5 lists the number of programs offered, program attendance, program duration, and contact hours for the past 5 academic years. Contact hours for a program is the product of actual duration of the program and the number of participants who attended the program. Appendix C contains program hours, attendance, and contact hours. It should be clarified here that the program participation data includes only attendance in scheduled programs and not in individual or group consultations or programs.
Table 5. Number of programs, total program hours, total attendance and actual contact hours Academic Year Number of
Programs
Total Program Duration
Total Attendance
Total Contact Hours
2005‐06 165 353.5 1567 5560.25
2006‐07 156 337.5 2336 7653.50
2007‐08 176 410.5 1821 6529.40
2008‐09 165 413.83 2066 7438.29
2009‐10 174 371.83 1905 5885.00
Findings: During 2005‐2010, the number of programs offered remained fairly consistent, as did the corresponding total program hours, total attendance, and actual contact hours. The total programs and attendance for 2005‐2010 can be partially attributed to the continued interest of faculty, SPS, GTAs and administrators in participating in Center’s programs. It should be noted that the attendance figures and contact hours were exaggerated during 2006‐07 by staff participation in the program, “Customer Service, Disney Style,” co‐sponsored with Outreach Services. This one‐time only program was attended by 500 participants (mainly staff), and greatly increased the attendance and contact hours for 2006‐07.
In 2005, Center staff realized that number of programs and program attendance figures alone could not give a true picture of the actual duration of professional development activities during an academic year as one program may be for 6 hours and have an audience of 40 participants whereas another program may be for 1 hour and have an audience 40 participants too but the total time spent by the audience on professional development would be different. Therefore, Center staff began tracking the actual number of hours that participants spent on professional development activities offered by the Center.
Assessment of actual contact hours continues to help Center staff in assessing the cost effectiveness of programs offered and the effective use of Center’s resources. To maintain cost effectiveness, the Center also requests sponsorship or co‐sponsorship of programs by other units at NIU whenever possible. Office of the Provost, Office of Assessment Services, and the Writing Across the Curriculum have been regularly co‐sponsoring programs with the Center.
Another important finding from recording and analyzing program attendance has been the issue of “no shows” due to registrants registering for a program but not showing up or canceling their registration in advance, thus resulting in waste of program expenses or loss of opportunity for those on the waiting list to attend a program with limited seating. During the past 5 years, Center staff included in all program announcements a sentence about canceling a registration in advance if a participant was unable to attend a program for which they registered so that the Center could reduce program expenses or allow those on the waiting list to attend the programs. Analysis of program attendance data revealed that in spite of including the sentence in the program announcements about canceling registration, a number of participants had continued to be “no shows” and failed to cancel their registrations in advance.
In fall 2010, Center staff realized that registrants who decided not to attend a program but did not cancel their registration in advance could be doing so because they did not take the online registrations seriously and/or did not understand how much it cost to plan and deliver programs. To help registrants take their program registrations seriously and notify the Center in advance about their inability to attend a program, Center staff added a check box on the online registration form which requires registrants to agree to cancel their registration in advance if they are unable to attend a program or their future program registrations would be impacted. The full impact of this check box on program cancellations and “no shows” will be known in 2011 but in the short run it appears to be working well and registrants have been notifying the Center in advance if they are unable to attend a program.
D. Consultations, Requests, and Referrals
Activities: Along with formally scheduled programs during the past 5 years, Center staff have continued to offer and record data on individual and group consultations on a variety of topics including teaching, Blackboard, Clickers, development grants, multimedia, personnel issues, SMART pen, and other issues. After attending a particular program, many faculty, staff, and TAs request individual consultations from Center staff to get more in‐depth help on specific needs related to their teaching, courses or other activities. Duration of consultations vary from a few minutes to several hours, and the mode of
consultations could be face‐to‐face, phone, email or virtual. Table 6 shows the numbers of consultations and unique individuals who received consultations from Center staff during the past 5 academic years.
Findings: As it can be seen from Table 6, the number of consultations and number of individuals who received consultations have remained fairly steady for the past 5 years. The steady number of
consultations in 2005‐2010 can be attributed to the introduction of new technologies such as advanced features of Blackboard, and newer instructional technologies, such as Wikis, Blogs, Podcasting, Social Bookmarking, Screencasting, and Social Networking, which increased the need for consultations. Data
on consultations have been helpful to decide on the need for new programs, if a number of faculty and staff request consultations on the same topic, and to address unique needs of faculty and staff. For example, in 2007‐2008 more faculty and staff requested consultations than in other years, and this was due to a major upgrade of Blackboard that year, and the introduction of new features such as SafeAssign in Blackboard. As a result of the increasing number of consultations, Center staff decided to offer new programs on those topics, which reduced the need for consultations in subsequent years.
Table 6. Number of consultations and individuals who received consultations
Academic Year Number of Consultations Number of Individuals Who Received Consultations
2005‐06 768 342
2006‐07 782 343
2007‐08 950 402
2008‐09 783 348
2009‐10 770 330
As part of consultation services, Center staff also offered classroom observation services to faculty during 2005‐2010. This is a time and staff intensive service as one or two staff members have to observe faculty member’s classes numerous times during the semester, meet with the faculty member before and each class to offer formative feedback, and provide summative feedback at the end of the period of observations. A sample of feedback on the classroom observation process from one faculty member whose classes were observed is included below:
“NIU Faculty Development and Instructional Design Center has a wonderful service that helps faculty members to improve their teaching quality by providing feedback on their classes. Your staff gave me valuable comments and explained the process of observation and feedback. . . I felt that their help was invaluable and their feedback and discussion helped me significantly to improve the quality of my teaching.”
Apart from programs, consultations are a major, time‐intensive service provided by Center staff, and the outcomes of consultations can have a significant impact on teaching and related activities of faculty, staff, and TAs, and can benefit students. Therefore, Center staff are considering implementing a consultation feedback form in 2011 to obtain consultees’ feedback on the same 2 questions as for program evaluations (along with other questions related to consultations), and use the information as part of the overall assessment effort.
E. Development grants final reports
Activities: The Center offers development grants to faculty and SPS to help them seek professional development opportunities unavailable at NIU. These grants typically fund participation in training programs or workshops on teaching effectiveness, technology integration, or research and scholarly activities to learn particular skills necessary to fulfill the unique responsibilities of tenured or tenure‐ track faculty and SPS. Faculty Development Grants award a maximum $2,000 per applicant, and SPS Development Grants award a maximum $1,000 per applicant per year. The grants are typically offered in two cycles: January through June, and July through December. SPS Development Grants funding is limited to a total of $6,000 per year with $3,000 per cycle. Human Resource Services has contributed $3,000 annually for one cycle of SPS Development Grants since 2004.
All award recipients are required to submit a final report online detailing grant activities and outcomes, and provide additional information on their perception of impact the development grants had on their
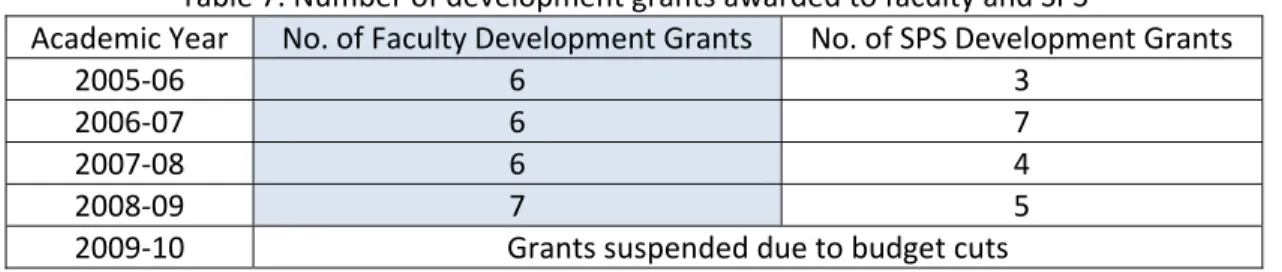
teaching and their students’ learning. Appendix D contains the Faculty and SPS Development Grant Final Report format. Table 7 lists the number of development grants awarded during the last five academic years.
Table 7. Number of development grants awarded to faculty and SPS
Academic Year No. of Faculty Development Grants No. of SPS Development Grants
2005‐06 6 3
2006‐07 6 7
2007‐08 6 4
2008‐09 7 5
2009‐10 Grants suspended due to budget cuts
Findings: During 2005‐2009, 25 tenured or tenure track faculty and 19 SPS were awarded development grants to pursue professional development opportunities not available at NIU. Development Grants were suspended for the July to December 2009 and January to June 2010 cycles due to budget constraints. In the final reports submitted for 2005‐2009 grant awards, grant recipients unanimously indicated that their development activities had a positive impact on their teaching and related activities, and were beneficial to their students.
The number of development grant proposals submitted by faculty and SPS during 2005‐09 continues to indicate the need for this type of support. Examples of grant activities include attending workshops and training programs not available at NIU for developing new courses or improving existing courses in recipients’ disciplines, and learning new information to improve teaching in their disciplines. The final reports submitted by grant recipients have been extremely useful for documenting and assessing how the grant activities have benefited the recipients, their units, and their constituents (faculty, students and staff).
F. Feedback from mentoring support
Activities: During 2005‐2010, the Center Director received requests for mentors from 23 faculty and instructors, and 1 new department chair. The Center Director arranged mentors for all those who requested such assistance. Mentors and mentees were left to decide how they would meet (face‐to‐ face, phone, email, etc.) and how often they would interact depending on their needs. The Program Coordinator periodically sent reminders and useful articles to both mentors and mentees to keep them engaged in the mentoring process. Mentors did not receive any compensation and they volunteered their time and effort to mentor new faculty or chairs. However, the mentors were sent a formal letter acknowledging their service and the letter was copied to their department chairs.
Findings: During 2005‐2010, feedback from mentors and new faculty mentees was collected through an online form at the end of each academic year. The feedback from both mentors and mentees has been overwhelmingly positive, and a sample of feedback is listed below:
“… provided me with the kind of interaction I needed/wanted. I was interested in a mentor outside my college to give a broader perspective, and it worked.”
“It provided me with some support, w/o being too time consuming”
“I think that the best interactions have been informal discussions about policies and procedures as well as hearing about how my mentor handled situations when she was an assistant professor.”
“I have enjoyed and benefited from the articles I've received.”
Even though the New Faculty Mentoring Program is purely voluntary and the mentors do not receive any compensation, the feedback from participants during the past 5 years indicates the program has been effective and is a good addition to the mentoring provided to faculty and staff in their
departments. Center began tracking promotion and tenure of the 2005‐2010 mentees to identify how many of the mentored faculty received tenure and stayed at NIU. Due to the length of the promotion and tenure track cycle, promotion and tenure status of mentored faculty, the results could not be included in this report, but will be included in the next assessment report.
Center’s comprehensive website on the New Faculty Mentoring Program has received considerable attention and enquiries from other institutions who have requested permission to use the information in their institutions. Center’s New Faculty Mentoring Program website can be found at
http://www.facdev.niu.edu/facdev/services/newfacmentoring.shtml.
G. Resource usage
Activities: During 2005‐10, Center staff continued to develop or acquire and make available resources on topics of interest to faculty, staff, and GTAs. These resources impact their teaching and related activities, and they include:
Spectrum newsletter for faculty and SPS, and TA Connections newsletter for Teaching Assistants
Blogs
Web resources on a variety of topics Podcasts
Quick Tips for Effective Instruction
Tutorials on academic integrity, responsible conduct of research, effective writing practices, and teaching effectiveness.
Apart from the resources listed, Center staff continued to maintain an 11‐station Collaboratory, 6‐ station Digital Multimedia Studio, Teaching Resource Room with facilities for viewing videos on teaching and teaching‐related topics, and Web resources for faculty, SPS, and GTAs use. During 2005‐2010, Center staff continued to collect data on resource usage and Appendix E contains sample logs of Collaboratory and Digital Multimedia Studio usage.
Table 8. Number of academic departments, support units, and colleges represented by lab users Academic Year Number of Academic
Departments
Number of Support Units
Number Colleges (Including University Libraries)
2005‐2006 24 0 5
2006‐2007 33 0 5
2007‐2008 29 5 7
2008‐2009 23 3 7
2009‐2010 20 10 6
Findings: Table 8 shows the number of academic departments, support units, and colleges represented by the faculty, staff and GTA users of Center’s facilities. Collaboratory and Digital Multimedia Studio users were appreciative of the availability of laboratory facilities for experimenting with new
technologies. The Teaching Resource Room was also used, along with the Collaboratory and Digital Multimedia Studio, for consultations. A number of instructors or adjunct faculty who do not have office
spaces or do not have the necessary technologies in their offices also use the Center’s Collaboratory for developing their instructional materials for their teaching and related activities.
Center’s web resources were heavily accessed by faculty, teaching staff, instructors, teaching assistants, administrators, and students at NIU as well as outside NIU. For example, the Center’s Teaching with Blackboard site alone received 9,800 unique visitors per month during 2009‐2010.
H. Faculty Development Advisory Committee’s (FDAC) input
Activities: FDAC is a university‐level committee comprised of faculty representatives from all colleges and the University Libraries plus an SPS representative. The FDAC’s purpose is to advise the Center and participate in its programs and activities. The FDAC submits an annual report to the Executive Vice President and Provost in spring of each year summarizing the committee’s activities during the academic year and offering suggestions for consideration. FDAC’s annual report usually includes information on reviewing grant applications, participating in award selection process, presenting in the Center’s faculty development programs, recommending needs of faculty, SPS and GTAs for consideration, meeting with invited guests to discuss particular issues, etc. Appendix F contains a sample of the annual report (for 2009‐2010) submitted by the FDAC to the Provost.
Findings: The 2009‐10 FDAC annual report indicated committee members’ continued support of and participation in the Center’s activities. In addition to committee members’ advisement and participation in activities, FDAC members recommended the Provost give the Center consideration with the budget as program prices were increasing and the Center had to give back funds due to the budget cuts. The FDAC recommended the Center work with the Office of the Provost to explore sustaining and increasing faculty and SPS development grant funds, and possibly establishing dedicated funding lines or
endowments. The FDAC also recommended allocating another temperature‐controlled room when one is available on the third floor of Adams Hall to accommodate Center’s three servers. Finally, the FDAC recommended the Provost’s Office to discuss the need for HRS to pay for sign language interpreters for faculty who need such services. The Center Director has conveyed these recommendations to the Provost in one of the monthly status meetings during 2009‐10.
I. Faculty and Supportive Professional Staff (SPS) campuswide survey
Activities: The Center conducts a campuswide survey of faculty and SPS every 4 years to assess the overall impact the Center’s programs, resources, and services have on faculty and SPS. During 2008, the Center designed and distributed the survey electronically to nearly 2,200 faculty and SPS at NIU,
collected the data, and summarized the results. Appendix G contains a copy of the survey.
Findings: More than 450 faculty and staff responded to survey questions related to awareness of, participation in, and impact of Center’s programs, resources, and services on their teaching and related activities, and interactions with Center staff. An overwhelming majority of respondents indicated that the Center was important to the professional development of faculty, staff, and GTAs.
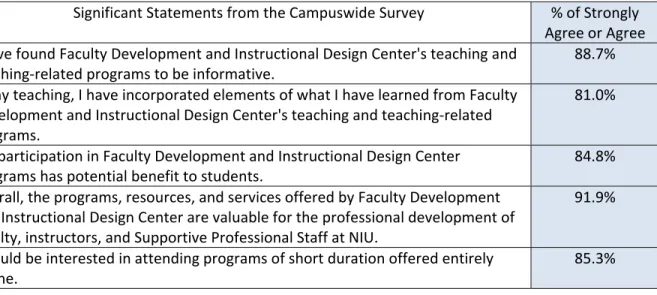
Table 9 lists a sample of significant results from the campuswide survey conducted in Spring 2008 and the percentage responses indicate “strongly agree” or “agree” to a sample of significant statements in the survey. Many of the suggestions for improvement as a result of the campuswide survey have already been implemented and are explained in section VI. Use of Results. The next campuswide survey of faculty and supportive professional staff is scheduled for spring 2012.
Table 9. Significant results from the Campuswide Assessment conducted in spring 2008 Significant Statements from the Campuswide Survey % of Strongly
Agree or Agree I have found Faculty Development and Instructional Design Center's teaching and
teaching‐related programs to be informative.
88.7% In my teaching, I have incorporated elements of what I have learned from Faculty
Development and Instructional Design Center's teaching and teaching‐related programs.
81.0%
My participation in Faculty Development and Instructional Design Center programs has potential benefit to students.
84.8% Overall, the programs, resources, and services offered by Faculty Development
and Instructional Design Center are valuable for the professional development of faculty, instructors, and Supportive Professional Staff at NIU.
91.9%
I would be interested in attending programs of short duration offered entirely online.
85.3%
J. Graduate Teaching Assistants (GTAs) campuswide survey
Activities: After the responsibilities for GTAs training and development were transferred to the Center in 2003, the programs and services offered to GTAs were included in the Center’s assessment plan to ensure that the Center was meeting the training and development needs of GTAs. As part of the Center’s assessment plan, Center staff decided to conduct a campuswide survey of all GTAs every 4 years. The first campuswide survey of all GTAs was designed and conducted by the Center in Spring 2007. The survey included 14 questions and was implemented using the Blackboard web course management system. The link for the survey was emailed to all 1,200 graduate assistants at NIU. 195 graduate assistants completed the survey and 71.80% of them indicated that they had teaching or teaching‐related responsibilities as a GTA in their departments. Appendix H contains the GTA campuswide survey.
Findings: Conducting the first GTA campuswide survey was a learning experience for the Center. Center staff had a difficult time obtaining a complete list of GTAs with only teaching or teaching‐related
responsibilities and so Center staff sent the survey to all GTAs regardless of their responsibilities. Even though the survey questions specifically asked respondents their feedback only about teaching and teaching‐related programs offered by the Center for GTAs, many GTAs responded about other issues such as resume writing, future job opportunities for GTAs or complaints about their academic programs, which the Center had no control over. Therefore, for the next GTA campuswide survey, Center staff will contact the Graduate School to obtain the list of names and email addresses of only those GTAs with teaching and related responsibilities and target only those GTAs so that the results are meaningful and can be used for assessment purposes. Center staff will also make it clear that the survey is only about assessing the Center’s teaching and teaching‐related programs and services for GTAs and not about other issues for which the Center has no control over. The Center hopes to address these two issues and avoid unnecessary and immaterial feedback when the next GTA campuswide survey is conducted in spring 2011.
In spite of the mentioned difficulties in conducting the GTA campuswide survey, some of the qualitative results from the survey were useful for planning programs and services, and improving the resources offered for GTAs. Center staff have implemented some of the recommendations in planning programs and developing resources, such as the TA Connections newsletter.
K. New Faculty Needs and Interest Survey
Activities: Center staff conduct a survey of new tenure‐track faculty every fall semester to identify their needs and interests and uses the responses to plan programs, resources, and services. In 2006, Center staff updated the survey and published it online to simplify the process for new faculty to receive and complete the survey easily. Appendix I contains a copy of the survey.
Findings: Respondents to the survey conducted during 2005‐2008 provided Center staff with useful feedback on new faculty’s needs and interests, and the information was used in planning programs and services. Faculty indicated strong interest in “teaching with technology” programs, professional
development, and research and scholarly activities. Teaching with technology programs were requested by a majority of the respondents and Center staff responded by offering new programs such as “Video Podcasting,” and “Quick and Easy Video Editing Using iMovie.” Center staff offered new teaching programs, “Greener Teaching Techniques” and “Effective Delivery Techniques: Little Things that Make a Big Difference” to fulfill faculty requests for teaching‐related programs. Center staff also offered a professional development program, “Maintaining Constructive Relationships In and Out of the Classroom,” based on faculty need for such a program. In response to new faculty’s interest in programs on research and scholarly activities, the Center co‐sponsored with Writing Across the Curriculum the “Write Well, Publish More!” workshop for a fourth consecutive year in May 2010. Response rate for the new faculty needs and interest survey declined drastically in 2009 and 2010, and this may be primarily due to the fact that new faculty have easy access to Center staff and are familiar with them through introductory programs such as the New Faculty Forum, Teaching Effectiveness Institute, and introduction to Blackboard workshop, and can convey their needs and interests directly and easily instead of completing a survey. Center staff will explore this issue further in summer 2011 and decide either to eliminate this survey or redesign it to obtain a better response rate.
L. Unsolicited feedback
Activities: Along with conducting formal evaluations and surveys of programs and services, Center staff have been collecting unsolicited feedback from faculty, staff and GTAs. Such feedback has been useful to identify additional issues and concerns not covered in the formal program evaluations or surveys, and reinforce positive aspects of Center’s programs, resources, and services. Listed below is a sample of unsolicited feedback received by Center staff by email and represents feedback from faculty, staff and instructors from different Colleges at NIU:
“I wanted to let you know that the orientation for the TA's was very useful and informative. The presenters were professional and delivered their information in a way that kept us engaged. As a new graduate student to NIU, I wanted to express my appreciation at the professionalism and helpfulness of your staff. I am truly proud to be part of this university.”
“I am a new faculty member here at NIU and would like to take this opportunity to inform you that [staff member] has been an incredible source of support and assistance to me over the past 2‐3 weeks. She has helped me on a one‐to‐one basis to set up blackboard, has offered suggestions and advice in a timely fashion, and is always willing to help me problem solve! Thank you for the wonderful help you organize for us here at NIU.”
“The workshop was very informative. I learned a lot and feel confident to start using the tools discussed. We got hands‐on practice in Wimba and Wiki. You and your team are doing a very good job. Many faculty were very appreciative of all the efforts made by the faculty development center.”
“Faculty Development is such a vital resource for all of us, and its importance is even greater now as departmental budgets continue to shrink. Keeping up with technology and incorporating it into our teaching is an absolute necessity.”
“The workshop was wonderful ‐ it definitely enhanced my confidence level in the use of this technology! I left with many ideas for the use of Wimba in my courses.”
Findings: Unsolicited feedback continues to aid Center staff in planning programs and services to meet the needs of the Center’s clientele. Unsolicited feedback also serves to reinforce what Center staff have been doing well and what they could continue to do better.
M. Graduate Teaching Assistants (GTAs) Pre‐Survey
Activities: As part of the ongoing assessment of GTA programs, Center staff have been conducting a pre‐ survey of GTAs at every fall Teaching Assistant Orientation. The pre‐survey is useful to assess GTAs’ expectations of TA Orientation and compare them with the program evaluation conducted at the end of the TA Orientation on the same day. The results from these assessments are then compared with the results from the four‐month follow‐up survey sent to the participants of the TA Orientation. Appendix J contains the pre‐survey instrument.
Findings: The pre‐survey has been conducted at each TA Orientation during the past 5 years. In the pre‐ survey, a majority of respondents indicated their classification as “teaching assistant” and knowing the classification of GTAs helped Center staff to plan programs to meet their teaching and teaching‐related needs. For example, pre‐survey respondents indicated that more programs were needed in technology integration; hence, more technology integration programs, such as “New Tools and Features Coming to Blackboard,” “Blackboard 8.0 Grade Center I: Basic Features,” and “Conducting Online Office Hours Using Wimba Classroom,” were offered. GTAs also indicated the need for more teaching‐related programs. In response, Center staff offered teaching‐related programs, such as “Greener Teaching Techniques,” “Teaching Large Classes,” “Constructivism: A Holistic Approach to Teaching and Learning,” and “Microteaching (No, That Doesn’t Mean Tiny Classes!),” to fulfill teaching and teaching‐related needs of GTAs. Center also invited a teaching assistant to offer a workshop titled, “Critical Thinking for the 21st Century Student” for graduate teaching assistants in response to interest in the subject matter. GTAs were also allowed to attend spring Teaching Effectiveness Institutes as space permitted.
Also, in response to GTAs’ interest, Center staff continued the Graduate Teaching Certificate program to recognize GTAs who attended both a full‐day fall or spring TA Orientation and at least 5 programs of shorter duration offered by the Center. After participating in the required number of programs, each GTA can complete and submit an application form to the Center to receive the certificate. During 2005‐ 2010, 26 GTAs applied for and received the Teaching Certificate, bringing the total number awarded to 38 recipients from 17 academic and support units in the sixth year of offering the certificate.
N. Office of the Provost’s input
Activities: During 2005‐2010, the Center Director continued to meet monthly with the Provost to report on planned and completed activities, convey faculty, SPS, administrator and GTAs’ needs, and obtain Provost’s feedback and directives for the Center. The Center Director also met with the Provost’s staff to discuss issues related to faculty development and to obtain suggestions regarding programs and services.