MAXIMUM POWER POINT TRACKING USING PERTURBATION
AND OBSERVATION AS WELL AS INCREMENTAL
CONDUCTANCE ALGORITHM
Manoj Kumar* Dr. F. Ansari** Dr. A. K. Jha***
ABSTRACT
This paper is comparative study of two type of maximum power point tracking (MPPT). The
optimisation of energy generation in a photovoltaic (PV) system is necessary to let the PV
cells operate at the maximum power point (MPP) corresponding to the maximum efficiency.
Since the MPP varies, based on the irradiation and cell temperature, appropriate algorithms
must be utilised to track the MPP. This is known as maximum power point tracking (MPPT).
Different MPPT algorithms, each with its own specific performance, have been proposed in
the literature. A so-called perturb and observe (P&O) as well as incremental conductance
method is considered here and both are compared. This two method is widely diffused
because of its low-cost and ease of implementation. When atmospheric conditions are
constant or change slowly, the P&O method oscillates close to MPP. However, when these
change rapidly, this method fails to track MPP and gives rise to a waste of part of the
available energy. A comparative study has been done on both the methods by using MATLAB
environment. The MPPT algorithm was set up and validated by means of MATLAB
simulations and experimental tests, confirming the effectiveness of the method.
Keywords: MPPT, MATLAB, Incremental Conductance, Perturb and Observe
*Gateway Inst. of Engg. & Tech **BIT, Sindri
INTRODUCTION
The comparisons between the PV water pumping system equipped with a Maximum power point tracker (MPPT) and the direct coupled system without MPPT has been done with the addition of a solar tracking using microcontroller. Microcontroller has been used to rotate the panel so that we can utilize maximum renewable energy in more efficient way.
Also, the design and simulations of MPPT has been done using MATLAB to perform comparative tests of the perturb and observe (P&O) and incremental Conductance (incCond) algorithm. Simulations also verify the functionality of MPPT with a resistive load and then with the DC pump motor load. The comparisons between the PV water pumping system equipped with MPPT and the direct coupled system without MPPT has been done also solar tracking using microcontroller has been used so that we can utilize maximum renewable energy in more efficient way.
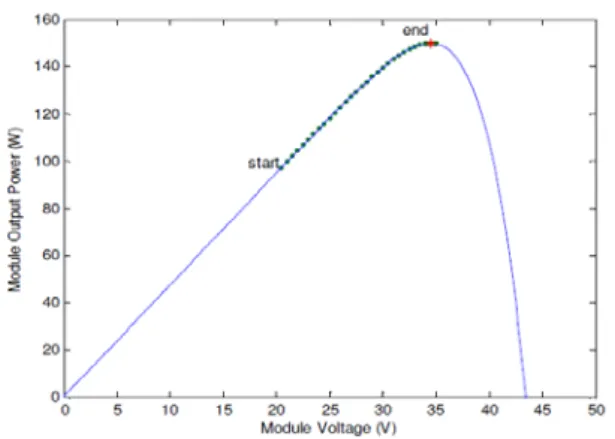
The two MPPT algorithms, P&O and incCond, discussed and are implemented in MATLAB simulations and tested for their performance. Since the purpose is to make comparisons of two algorithms, each simulation contains only the PV model and the algorithm in order to isolate any influence from a converter or load. First, they are verified to locate the MPP correctly under the constant irradiance, as shown in Figure 1.
Figure 1: Searching the MPP (1KW/m2, 25oC)The traces of PV operating point are shown in green, and the MPP is the red asterisk.
MAXIMUM POWER POINT TRACKER
producing the maximum power. A study shows that a direct-coupled system utilizes a mere 31% of the PV capacity [1]. A PV array is usually oversized to compensate for a low power yield during winter months. This mismatching between a PV module and a load requires further over-sizing of the PV array and thus increases the overall system cost. To mitigate this problem, a maximum power point tracker (MPPT) can be used to maintain the PV module’s operating point at the MPP. MPPTs can extract more than 97% of the PV power when properly optimized [2]. This chapter discusses the I-V characteristics of PV modules and loads, matching between the two, and the use of DC-DC converters as a means of MPPT. It also discusses the details of some MPPT algorithms and control methods, and limitations of MPPT.
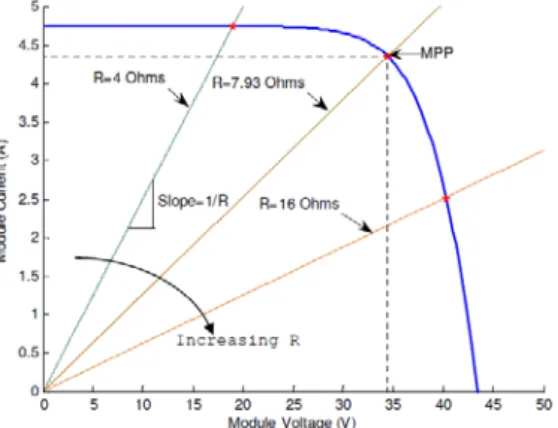
Figure 2: PV module is directly connected to a (variable) resistive load
Figure 3: I-V curves of BP SX 150S PVmodule and various resistive loads Simulated with the MATLAB model (1KW/m2, 25oC
MAXIMUM POWER POINT TRACKING ALGORITHMS
methods that have been proposed. One method measures an open-circuit voltage (Voc) of PV module every 30 seconds by disconnecting it from rest of the circuit for a short moment. Then, after re-connection, the module voltage is adjusted to 76% of measured Voc which corresponds to the voltage at the MPP [3]. The implementation of this open-loop control method is very simple and low-cost although the MPPT efficiencies are relatively low (between 73~91%) [3]. Model calculations can also predict the location of MPP; however in practice it does not work well because it does not take physical variations and aging of module and other effects such as shading into account. Furthermore, a pyranometer that measures irradiance is quite expensive. Search algorithm using a closed-loop control can achieve higher efficiencies, thus it is the customary choice for MPPT. Among different algorithms, the Perturb & Observe (P&O) and Incremental Conductance (incCond) methods are studied.
Figure 4: I-V curves for varying irradiance and a trace of MPPs (25oC)
Figure 5: I-V curves for varying irradiance and a trace of MPPs (50oC)
PERTURB & OBSERVE ALGORITHM
operating at a point which is away from the MPP. In this algorithm the operating voltage of the PV module is perturbed by a small increment, and the resulting change of power, ∆P, is observed. If the ∆P is positive, then it is supposed that it has moved the operating point closer to the MPP.
Thus, further voltage perturbations in the same direction should move the operating point toward the MPP. If the ∆P is negative, the operating point has moved away from the MPP, and the direction of perturbation should be reversed to move back toward the MPP.
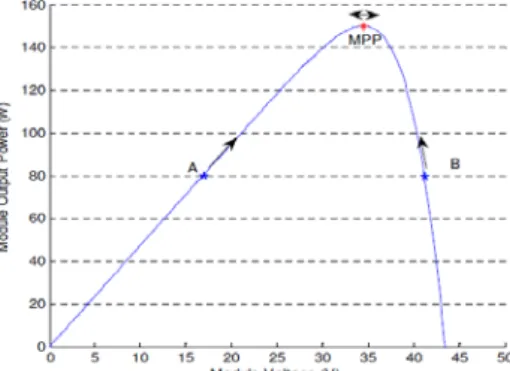
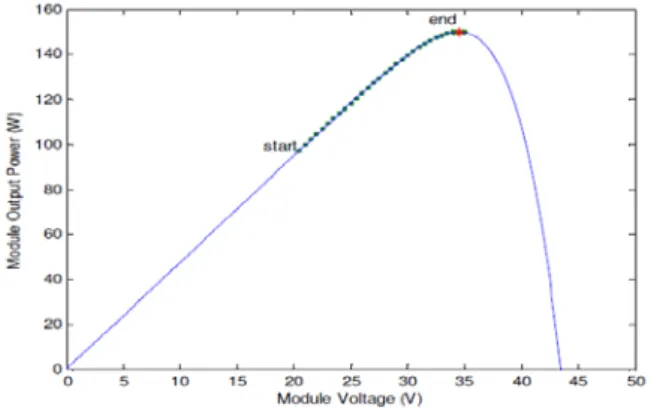
Figure 6: Plot of power vs. voltage for BP SX 150S PV module (1KW/m2, 25oC)
INCREMENTAL CONDUCTANCE ALGORITHM
To solve the problem of the P&O algorithm under rapidly changing atmospheric conditions the incremental conductance (incCond) algorithm was proposed [1]. The basic idea is that the slope of P-V curve becomes zero at the MPP, as shown in Figure 6. It is also possible to find a relative location of the operating point to the MPP by looking at the slopes. The slope is the derivative of the PV module’s power with respect to its voltage and has the following relationships with the MPP.
(1)
(2)
(3)
The above equations are written in terms of voltage and current as follows.
(4)
If the operating point is at the MPP, the equation (4) becomes: (5)
If the operating point is at the left side of the MPP, the equation (4) becomes:
(7)
(8)
If the operating point is at the right side of the MPP, the equation (4) becomes:
(9)
(10)
Note that the left side of the equations (6), (8), and (10) represents incremental conductance of the PV module, and the right side of the equations represents its instantaneous conductance.
PI CONTROLLING OF MPPT
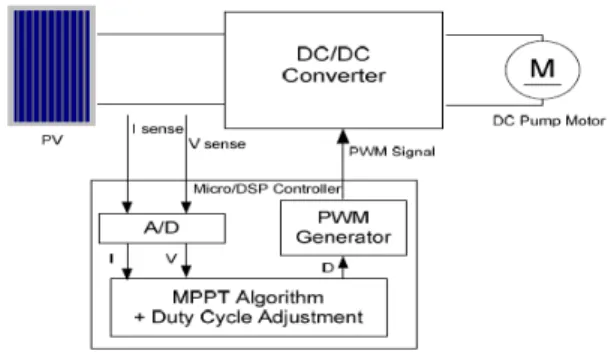
As shown in Figure 7, the MPPT takes measurement of PV voltage and current, and then tracking algorithm (P&O, incCond, or variations of two). The PI loop operates with a much faster rate and provides fast response and overall system stability [4] [5]. The PI controller itself can be implemented with analog components, but it is often done with DSP-based controller [4] because the DSP can handle other tasks such as MPP tracking thus reducing parts count.
Figure 7: Block diagram of MPPT with the PI compensator
COMPARISONS OF P&O AND INCCOND ALGORITHM
Figure 8: Searching the MPP (1KW/m2, 25oC)
The traces of PV operating point are shown in green, and the MPP is the red asterisk
Next, the algorithms are tested with actual irradiance data provided by [6]. Simulations use two sets of data, shown in Figure 9, the first set of data is the measurements of a sunny day in April in Barcelona, Spain, and the second set of data is for a cloudy day in the same month at the same location. The data contain the irradiance measurements taken every two minutes for 12 hours. Irradiance values between two data points are estimated by the cubic interpolation in MATLAB functions.
Figure 10: Traces of MPP tracking on a sunny day (25oC) by using P&O algorithm.
Figure 11: Traces of MPP tracking on a sunny day (25oC) by using inccond algorithm. On a cloudy day, the irradiance level changes rapidly because of passing clouds. MPP tracking is supposed to be challenging. Figure 12 shows the trace of PV operating points of P&O algorithm and Figure 13 for incCond algorithm. For both algorithms, the deviations of operating points from the MPPs are obvious when compared to the results of a sunny day. Between two algorithms, the incCond algorithm is supposed to outperform the P&O algorithm under rapidly changing atmospheric conditions [1]. A close inspection of Figure 12 & 13 reveals that the P&O algorithm has slightly larger deviations overall and some erratic behaviours (such as the large deviation pointed by the red arrow). Some erratic traces are, however, also observable in the plot of the incCond algorithm.
Figure 12: Traces of MPP tracking on a cloudy (25oC) by using P&O algorithm
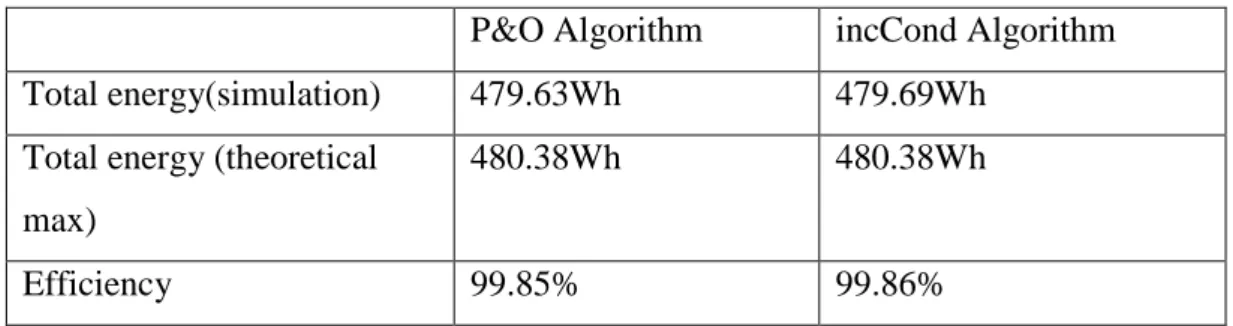
Table 1: Comparison of the P&O and incCond algorithms on a cloudy day. P&O Algorithm incCond Algorithm Total energy(simulation) 479.63Wh 479.69Wh
Total energy (theoretical max)
480.38Wh 480.38Wh
Efficiency 99.85% 99.86%
Total electric energy produced with the incCond algorithm is narrowly larger than that of the P&O algorithm. The MPP tracking efficiency measured by {Total Energy (simulation)} ÷ {Total Energy (theoretical max)} ×100% is still good in the cloudy condition for both algorithms, and again it is narrowly higher with the incCond algorithm. The irradiance data are only available at two-minute intervals, thus they do not record a much higher rate of changes during these intervals. The data may not be providing a truly rapid changing condition, and that could be a reason why the two results are so close. Also, further optimization of algorithm and varying a testing method may provide different results. The performance difference between the two algorithms, however, would not be large. There is a study showing similar results [3]. The simulation results showed the efficiency of 99.3% for the P&O algorithm and 99.4% for the incCond algorithm. The experimental results showed 96.5% and 97.0%, respectively, for a partly cloudy day.
MPPT SIMULATIONS WITH RESISTIVE LOAD
First, MPPT with a resistive load is implemented in MATLAB simulation and verified. The selection of the P&O algorithm permits the use of the output sensing direct control method which eliminates the input voltage and current sensors. The MPPT design, therefore, chooses the P&O algorithm and the output sensing direct control method because of the advantage that allows of a simple and low cost system. The simulated system consists of the BP SX 150S PV model, the ideal Cúk converter, the MPPT control, and the resistive load (6 ). The MATLAB function that models the PV module is the following:
(11)
The function, bp_sx150s, calculates the module current (Ia) for the given module voltage Va), Irradiance (G in KW/m2), and module temperature (T in oC). The operating point of PV
(12)
The irradiance (G) and the module temperature (T) for the function (11) are known variables, thus it is possible to say that Ia is the function of Va hence Ia = f(Va). Substituting this into the equation (12) gives:
(13)
Knowing the value of R enables to solve this equation for the operating voltage (Va). MATLAB uses fzero function to do so. Appendix for details. Placing Va, back to the equation (11) gives the operating current (Ia).
For the direct control method, each sampling of voltage and current is done at a periodic steady state condition of the converter. The following equations describe the input/output relationship of voltage and current, and they are used in the MATLAB simulation.
(14)
(15)
Where: D is the duty cycle of the Cúk converter.
The simulation is performed under the linearly increasing irradiance varying from 100W/m2
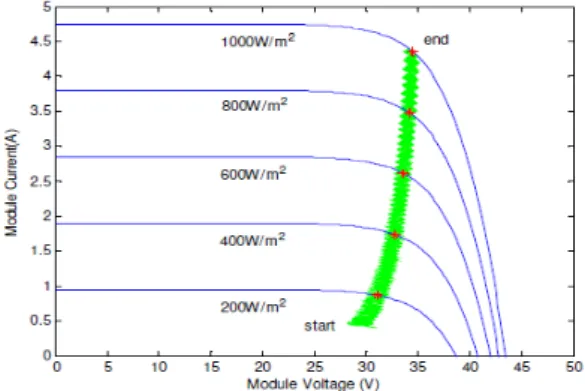
to 1000W/m2 with a moderate rate of 0.3W/m2 per sample. Figure 14 and 15 show that the trace of operating point is staying close to the MPPs during the simulation. Figure 16 shows the relationship between the output power of converter and its duty cycle. Figure 17 shows the current and voltage relationship of converter output. Since the load is resistive, the current and voltage increase linearly with the slope of 1/Rloadon the I-V plane.
Figure 15: operating point between module current vs module voltage
Figure 16: operating point between o/p power vs duty cycle.
Figure 17: operating point between o/p current vs o/p voltage
RESULT ANALYSIS
The comparative study of P&O algorithm and incCond algorithm has been observed by MATLAB simulation. For both algorithms, the deviations of operating points from the MPPs are obvious when compared to the results of a sunny day. Between two algorithms, the incCond algorithm is supposed to outperform the P&O algorithm under rapidly changing atmospheric conditions.
source by solar tracking system, although we can get more solar energy by connecting more number PV system either series or parallel but it will be more complex as well as costly. A close inspection reveals that the P&O algorithm has slightly larger deviations overall and some erratic behaviours (such as the large deviation) pointed by the red Some erratic behaviour, however, also observable in the plot of the incCond algorithm. Total electric energy produced with the incCond algorithm is narrowly larger than that of the P&O algorithm. The MPP tracking efficiency measured by {Total Energy (simulation)} ÷ {Total Energy (theoretical max)} ×100%is still good in the cloudy condition The simulation results showed the efficiency of 99.3% for the P&O algorithm and 99.4% for the incCond algorithm. The experimental results showed 96.5% and 97.0%, respectively, for a partly cloudy day.
REFERENCES
1. K.H.Hussein et al.,“Maximum Photovoltaic Power Tracking: an Algorithm for Rapidly Changing Atmospheric Conditions” IEE Proceedings – Generation, Transmission and Distribution – v. 142, page 59-64, January 1995.
2. D.P. Hohm, M. E. Ropp., “Comparative Study of Maximum Power Point Tracking Algorithms” Progress in Photovoltaic: Research and Applications, page 47-62, November 2002.
3. J.H.R.Enslin et al.,“Integrated Photovoltaic Maximum Power Point Tracking Converter” IEEE Transactions on Industrial Electronics, Vol. 44,page 769-773, December 1997.
4. Hua Chihchiang et al., “Implementation of a DSP controlled Photovoltaic System with Peak Power Tracking” IEEE Transactions on Industrial Electronics, Vol. 45, No. 1, page 99-107, February 1998.
5. E.Koutroulis et al., “Development of a Microcontroller-Based, Photovoltaic Maximum Power Point Tracking Control System” In proc. International Journal on Power Electronics, Vol. 16, No. 1, page 46-54, January 2001.
6. Castañer, Luis & Santiago Silvestre Modelling Photovoltaic Systems, Using PSpice John Wiley & Sons Ltd, 2002.
8. Taufik, Akihiro Oi et.al.,” Modeling and Simulation of Photovoltaic Water Pumping System” IEEE Third Asia International Conference on Modelling & Simulation pp 497-502., May 2009.
9. Anna Mathew et al.,” MPPT Based Stand-Alone Water Pumping System” International Conference on Computer, Communication & Electrical Technology – ICCCET2011,pp 455-460., March 2011.