Acknowledgments:
Table of Contents
Chapter One: Introduction: 4-14
Background and Objective Hypotheses
Utility of C-reactive Protein Defining Overweight/Obesity
Psychosocial Stress in University Students
Influence of Stress and Overweight/Obesity on Inflammation Summary
Chapter Two: Methods 15-18
Subjects and Study Design ELISA Assay
Anthropometry
Surveys and Free Listed Stressors Statistical Analysis
Chapter Three: Results 19-46
BMI and Overweight/Obesity Prevalence Cohen PSS-10 Perceptions of Stress Free-Listed Stressors
Multi-Method Analysis of Free-Listed Stressors C-Reactive Protein and Inflammation
Chapter Four: Discussion 47-57
Summary of Results
BMI and Overweight/Obesity Prevalence
Psychosocial Stressors and Perceptions of Stress C-Reactive Protein and Inflammation
Chapter Five: Conclusion 58-59
References 59-63
Appendix A: Assay Procedure 64-69
Introduction Background and Objective
In recent decades, population health studies have recognized the utility of biomarkers as a method for illuminating how experience “gets under the skin” and is reflected into physiological outcomes. C-reactive protein (CRP), a highly sensitive marker of systemic inflammation, has been recognized as a valuable biomarker for long-term health risk (Worthman and Costello 2009). Studies have linked CRP with a variety of health outcomes, including the Metabolic Syndrome, hypertension, and various cardiovascular diseases (Desprès 2012).
Cardiovascular disease is the leading cause of death globally, accounting for over 17 million deaths per year- a figure that is expected to rise to almost 24 million by 2030 (Benjamin et al. 2018); the prevalence of cardiovascular disease highlights the importance of analysis of CRP in population studies examining lived experience and differential well-being.
Several anthropometric and psychosocial variables have been shown to mediate
remains consistent over the lifecourse (McDade 2009; Seeman et al. 2014). In this manner, biomarker measurement in early adulthood may provide insight into pre-disease pathways and disease risk (McDade 2009). Studies that begin to examine these variables in younger individuals may provide additional insight into the origins of differential health outcomes such as
cardiovascular disease early in the lifecourse of at-risk individuals.
The purpose of this study is to examine pathways between psychosocial stress and
overweight/obesity in mediating levels of CRP in a population of university students. This study
investigates daily stressors, levels of perceived stress, anthropometrics, and levels of
inflammation. This study aims to expand upon limited research conducted on associations
between psychosocial stress, BMI, and CRP in younger adults in order to assess potential risk
factors for long-term health outcomes related to chronic, low-grade inflammation. In addition,
this study aims to elucidate the particular sources and levels of stress that characterize the daily
lives of university students.
Hypotheses
Hypothesis 1a: Students with higher scores on the PSS will have higher levels of CRP in young
adulthood. This effect will be linear and will be will be evident in both men and women.
1b: Women will report higher perceived stress, on average, than men, and will have a higher
average CRP at baseline.
1c. Frequencies of reported sources of perceived stress will vary in correlation with levels of
perceived stress, such that certain factors are present only in those within the highest category of
Hypothesis 2: Students with higher BMIs will have higher levels of CRP in young adulthood.
This association will be evident in those with BMIs in the overweight/obese category, but may
not be evident in those within the “healthy” range, demonstrating a graded effect.
Hypothesis 3a: The impact of high BMI and high perceived stress will be additive, such that
individuals with high BMI and high perceived stress will have the most elevated levels of CRP.
Hypothesis 3b: Higher levels of perceived stress will be positively associated with higher
BMI, but only among those in the upper quartile of stress.
Hypothesis 4: Frequently listed sources of perceived stress will be uniform among men and
women and among various age groups, but will be unique when compared with sources of stress
Utility of C-reactive Protein
Biomarkers can be utilized to better understand the relationships between context, in this case a university environment, and physiological and psychological outcomes (McDade,
Williams, and Snodgrass 2007). In this study, context is principally elucidated by self-reported sources of stress and corresponding levels perceived stress, which reflect the unique experiences of students in a university setting. CRP has been utilized frequently in population-level studies in the past decade, primarily because it is relatively inexpensive to measure using high-sensitivity assay techniques, has been found stable over long periods of time, and has no diurnal variation (Rifai 2003; Meier-Ewert et al. 2001).
CRP upregulation by hepatocytes is one of the multiple changes in protein synthesis and secretion following activation of the innate immune system and complement cascade (Mortensen 2001). At the site of injury or infection, macrophage activity leads to an increase in
pro-inflammatory cytokines, including tumor neurosis factor-alpha (TNF-α) and interleukin-6, (IL-6), which stimulate synthesis and secretion of CRP (Rifai 2003; Ledue and 2003). CRP primarily acts as a protective molecule with the ability to identify certain pathogens (Burger and Dayer 2002). Recent studies have recognized the impact CRP may have on pathogenesis of disease, demonstrating its role beyond a nonspecific marker of inflammation (Mortensen 2001).
such as IL-6 by adipocytes (Ridker 2008). The increased production of pro-inflammatory cytokines thus leads to an increase in hepatic CRP production, which contributes to low-grade inflammation (Ridker 2008). Due to its rather extensive general application as a predictor of inflammatory response, CRP is useful not only in considering future development of
cardiovascular disease and diabetes, but also as a broader indicator of future health outcomes and accumulated stress burden (Worthman and Costello 2009). Figure 2 below, adopted from Libby and Ridker, displays the relationship between inflammation and the development of
atherosclerosis and related coronary artery diseases.
Figure 2. The inflammatory cascade. IL indicates interleukin; ICAM, intercellular adhesion molecule; and HSP, heat shock protein. Adapted from Libby and Ridker. Circulation 1999; 100:1148-1150
population of young adults, particularly through the context of psychosocial stress and BMI. Since this population is expected to be relatively healthy, mean CRP levels are hypothesized to be in the lowest category of less than or approximately 1mg/L.
Defining Overweight/Obesity
Psychosocial Stress in University Students
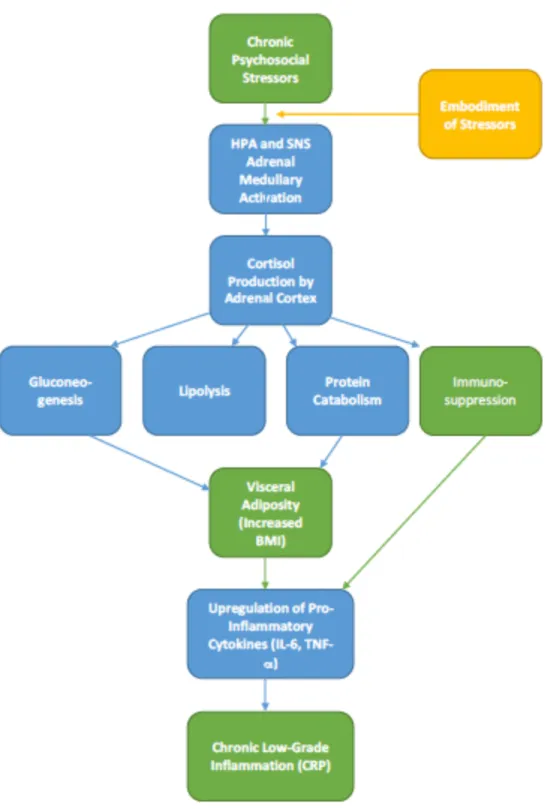
The term “stress” may be used to describe adverse environmental conditions, discomfort, psychological, emotional, and physical problems, or a physiological outcome resulting from biological processes (McDade 2009). As proposed in Hans Selye’s original model for stress research developed in the 1930s, stress incorporates the following: 1. A stressor, 2. A response, 3. Consequences, and 4. Moderators (McDade 2009). Stressors will be self-reported in this study, and potential consequences may be interpreted through an evaluation of responses on the Cohen-PSS scale (Cohen, Kamarck, & Mermelstein, 1983). Individuals may vary in their appraisal of events as stressful or non-stressful, and this variation is of interest for this study. Additionally, stressors may be classified according to duration as acute, subacute, and chronic, and may also vary in severity and intensity (McDade 2009). Both chronic and acute psychosocial stress can “fatigue” the HPA-axis, resulting in a decreased anti-inflammatory reaction, allowing pro-inflammatory responses to go unregulated (McEwen 2008). Chronic psychosocial stressors are frequently studied in association with long-term health outcomes particularly through the actions of glucocorticoids (McEwen 2008). Activation of the HPA axis pathway promotes the release of glucocorticoids from the adrenal cortex, which can suppress the production of pro-inflammatory cytokines and induce an anti-inflammatory response (McEwen 2008). Moreover, these
glucocorticoids stimulate gluconeogenesis in the liver, which increases blood sugar levels; chronically, this may lead to an increase in visceral adiposity due to reabsorption of the glucose (McEwen 2008). This study will examine proximate daily stressors and perceived stress over the course of a month.
comparative population-level analyses. University students face a unique variety of stressors, some of which have been identified in previous research studies. For many young adults, the transition to a university setting increases daily pressures and demands, ranging from academia and workload to social acclimatization. The long-term accumulation of these daily stressors has been correlated with negative psychological and physiological effects, including stroke,
cardiovascular disease, depression, and problem drinking (McEwen 2008). Previous research has examined the relationship between perceived stress and mental health in college students,
demonstrating that high levels of perceived stress are associated with poor mental health, lower physical activity, and lower academic achievement when compared to peers with less perceived stress (Leppink et al., 2016). Though investigations of stress in university settings are relatively limited, one study in Australia found that the majority of university students reported elevated levels of distress that were significantly greater than those reported in the general population (Stallman 2010). Stallman found that self-reported rates of mental health issues were higher among university students than the general population, suggesting higher levels of perceived stress (2010). Stress research has found that not all students feel or express stress in the same manner, with gender, personality and temperament contributing to variation in stress response and coping (Leppink et al. 2016; Barbosa-Leiker 2014; Stallman 2010).
obesity has similarly produced variable findings. Wardle and colleagues conducted a meta-analysis in order to analyze these associations in a systematic report of 14 studies conducted in the United States and England. Their findings show that more analyses demonstrated a
significant positive effect of stress on adiposity (25%) than those that demonstrated a significant negative effect; however, the majority of studies (69%) found a null effect (Wardle et al. 2010). Their synthesis found in more studies acute stress and the development of obesity was more strongly correlated in men than women, though the pathway that differentiate individuals based on sex is unclear. Previous studies have demonstrated that men typically have higher
physiological responses to acute-stress than women, despite findings that women generally report higher levels of perceived stress than men (Stoney, Davis, and Matthews 1987).
Influence of Stress and Overweight/Obesity on Inflammation
Previous studies investigating factors affecting inflammation have examined both stress and obesity; however, far fewer studies have considered the impact of these two variables in conjunction. Black and colleagues show that stress hormones including glucagon and
corticosteroids may mimic the acute phase response generated in the body following a sustained injury (Black 2002). Research has demonstrated that interleukin-6, one of the pro-inflammatory cytokines responsible for increasing levels of CRP, may act as the central mediator of the acute phase response (Black 2002). Perceived stress has also been associated with impaired immune function in correlation with increased levels of pro-inflammatory cytokines including
related to their sociocultural environments including socioeconomic grade, job stress, and migration (Yudkin et al. 2000).
Obesity has been shown to have an influence on circulating levels of CRP. Studies have shown that production of pro-inflammatory cytokines, and thus CRP, increase with adiposity; moreover, nearly one-third of circulating IL-6 may originate from adipose tissue (Yudkin et al. 2000). Yudkin and colleagues demonstrated that differences in levels of CRP can be
contextualized through the application of anthropometric measures of obesity (2000).
Increasingly, research has emphasized the crucial role of adipose in regulating and influencing metabolic signaling and inflammatory processes. CRPs associations with chronic disease can partially be explained by obesity, as studies have shown that obesity alone is associated with a myriad of diseases including Type 2 diabetes mellitus and cardiovascular disease, collectively known as Metabolic Syndrome (Yudkin et al. 2000).
Excess adiposity, unlike an acute stimulant or wound, induces a state of chronic, low-grade inflammation within the body (Johnson, Milner, and Makowski 2012). While studies have linked the distinct relationship between obesity and inflammation, few have investigated the relationship among these variables in a young population. This study hopes to illuminate the extent of influence BMI has on overall levels of inflammation in otherwise healthy individuals.
These variables have do not operate in isolation from one another, but are instead part of a complex and multifactorial psychophysiological network. This study analyzes psychosocial stressors as a proxy for an environmental context that may lead to unique physiological outcomes, including obesity and inflammation. While, stress and adiposity may impact
and indirect mechanisms previously outlined (Isasi et al. 2015). Similarly, chronic low-grade inflammation and obesity in individuals may impact perceived stress, particularly if individuals are coping with disease and illness.
Summary
Chapter 2
Methods Subjects and Study Design
Data used for this project was gathered through free flu clinics held at the University of North Carolina at Chapel Hill over the course of three years from 2015-2017. The data used in the present analysis was collected in conjunction with a project analyzing the associations between psychosocial stress, BMI, and immune resolution using the flu shot as a proxy for the latter variable. Subjects were recruited through convenience sampling after receiving a flu shot, at which time the data used for this study was collected. Participation was limited to
undergraduate, graduate, and professional students over the age of 18 at the university. In total, 106 individuals participated in the study, ranging in age from 18-36. Demographic questions were limited to sex and age for the scope of this study. Height and weight were measured to calculate BMI.
Assay Methods
incubated overnight and stored at approximately 38 degrees Fahrenheit. Blood spots that were too small to extract an appropriately sized punch, or that were not sufficient in quality were excluded from the study (15 samples were excluded).
Anthropometry
Anthropometric measurements were taken using standard techniques. Stature was measured to the nearest 1mm using a portable stadiometer; weight was measured using a digital scale and recorded to the nearest kg. Body mass index (BMI) was calculated as
weight(kg)/height(m²). Cut-points for BMI classification were adopted from the CDC guidelines (CDC “Body Mass Index” 2017). Individuals in the “overweight” or “obese” category have higher accumulations of fat, which may impair their immune function and their overall health. It should be noted that BMI is the common standard; however, it does not measure precise
adiposity in individuals.
Surveys and Free-Listed Stressors
Participants completed a demographic and disease symptom history survey to collect relevant demographic and health information.
The 10-item Cohen Perceived Stress Scale (PSS-10) was used to assess perceived stress of participants (Cohen, Kamarck, and Mermelstein 1983). Four out of the ten items of the PSS-10 are positively stated and the remaining six are negative. Each item was rated on a five-point scale (0=never to 4=very often). Total scores are calculated by reversing positive items’ scores and then summing across all items. Possible total scores for the PSS-10 range from 0 to 40 with higher scores indicating higher perceived stress.
The present study utilized free-list response methods in order to analyze the top five daily sources of stress in students’ lives. Free-list responses were coded and analyzed using
between PSS-global scores and reported factors of stress were also conducted using MAXQDA software.
Statistical Analysis
CRP levels were log-transformed in order to normalize the distribution prior to analysis. Regressions analyses were used to measure potential associations between variables for this study. CRP was used as the dependent variable for the quantitative analyses. Age, PSS-10 global scores, BMI, and sex were analyzed as independent variables in this context. Quantitative
analyses were conducted using SAS JMP 13 software for Mac. Results were considered statistically significant at P < 0.05.
Chapter 3 Results BMI and Overweight/Obesity Prevalence
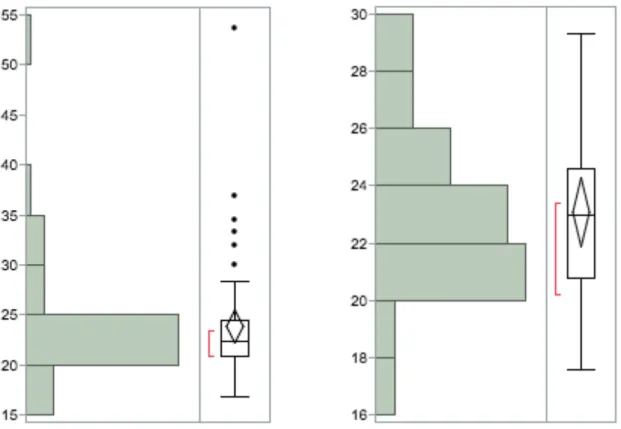
Table 1 shows summary statistics for BMI data by sex. The mean BMI for female participants was 23.8 ± 5.9, while mean BMI for male participants was 23.1± 2.9. There was no statistically significant difference between BMI in men and women in our study (p=0.754). Figure 1 displays BMI distributions by sex for our sample. As is evidenced in the scatterplot and the box and whiskers plot, most women (68%) are clustered at BMI’s of 20.0-25.0, with a few outlying points around 35.0, and an outlier at 53.6. Male BMIs were less variable, as is expected given the sex-ratio difference between women and men in our study.
Mean Values and Classifications for BMI
Men Women
N 25 50
Mean 23.1 23.8
Standard Deviation 2.9 5.9
Median 23 22.3
Underweight (BMI <18.5) 1 1
Healthy weight (BMI 18.5-24.9) 19 39
Overweight (BMI 25.0-29.9) 5 4
Obese (BMI >30.0) 0 6
Figure 1. BMI distribution for women (left), and distribution for men (right)
Men in our sample had a more normal distribution, while women had a more skewed distribution overall. From our sample, the majority of men and women were classified within the “healthy” BMI range (n=20 and n=20, respectively). Five men (20%) and four women (8%) were classified as “overweight”, and six women were classified as “obese” (12%).
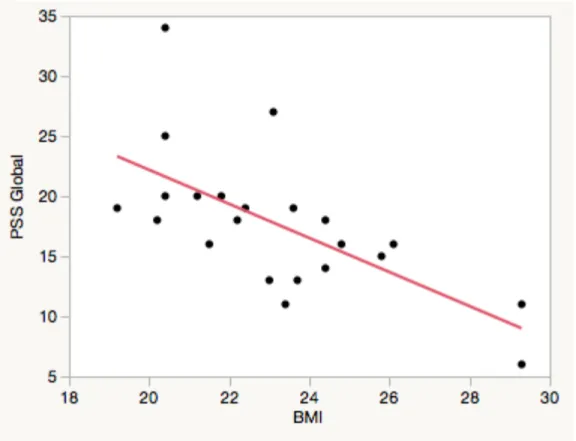
Figure 2. Scatterplot of PSS Global against BMI for female students, r=0.181. p=0.229,
Cohen PSS-10 Perceptions of Stress
Table 2 displays summary statistics for the PSS-10 (PSS) by sex. The mean PSS score for women was 17.3 ± 5.9, while mean PSS for men was 18.6 ±6.2. Contrary to Hypothesis 1, there was no statistically significant difference between men and women in our study (p=0.191). Figure 4 shows PSS distributions by sex for men and women, respectively. The overall distribution for men and women was similar, with the exception of a male outlier with a PSS score of 34.
Men Women
N 25 50
Median 18 18
Mean 17.3 18.6
Standard Deviation 5.9 6.2
Table 2. PSS Summary Data by Sex
The median PSS score for men and women was the exact same, at 18. These data are similar to reference values reported by Cohen and Janicki-Deverts collected in 2009;
Figure 4. PSS Distribution by sex, with men displayed on the left and women on the right 0
5 10 15 20 25 30 35 40
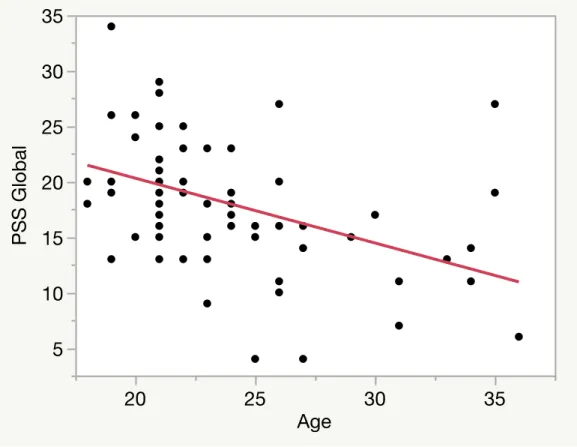
Figure 5. Bivariate analysis of PSS vs Age; r=-0.431, p=0.0002
Previous studies have found associations between age and PSS, which were examined in this study. Regression analysis of PSS global against age does show a statistically significant negative correlation between the variables (-0.431, p=0.0002).
5 10 15 20 25 30 35
PSS Global
20 25 30 35
Free-Listed Factors of Stress
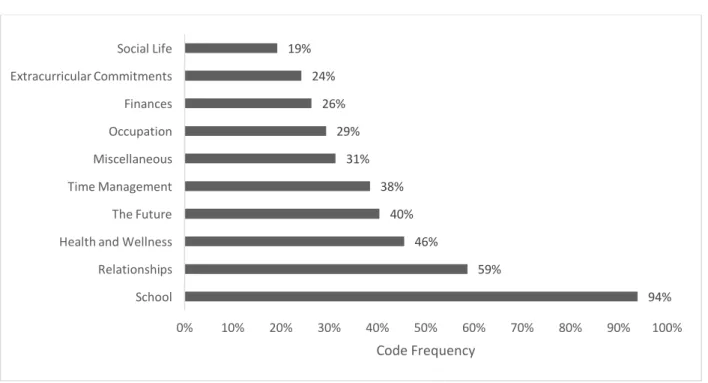
Figure 6. Code Frequency for Free-List Data
Figure 6 displays the most frequently recurring code, which included the following: “school”, “relationships”, “health and wellness”, “the future”, “time management”,
“occupation”, “finances”, “extracurricular commitments”, “social life”, and a “miscellaneous” code that included items that fell into individualized categories. From these codes several subcodes were identified, which are discussed below.
The coded data demonstrates the emergence of five frequently listed sources of stress for participants in this study. “School” was the most frequent code, and was utilized in 93.9% of
94% 59%
46% 40% 38% 31% 29% 26% 24% 19%
0% 10% 20% 30% 40% 50% 60% 70% 80% 90% 100% School
Relationships Health and Wellness The Future Time Management Miscellaneous Occupation Finances Extracurricular Commitments Social Life
students are immersed, it is not surprising that “school” was by far the most prevalent and salient source of stress for students. This code was broken down into four prominent subcodes, which are discussed later in this section.
Following school, “Relationships” was the second most employed code, with a frequency of 59%; again, this code was broken down into subcodes, discussed later. “Health and wellness”, “the future”, and “time management” were the next most employed codes with frequencies of 46%, 40%, and 38%, respectively. Other codes utilized in the study had frequencies below 1/3, which signifies the distinction between the “top 5” stressors, and the other code items listed.
Subcode Frequencies
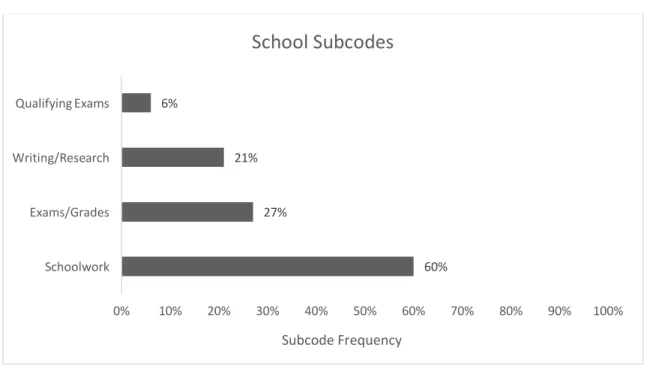
Figure 7. Subcode Frequencies for Code “School”
Figure 7 displays frequencies for subcodes within the “school” domain. Notably, some free-list items may be categorized into multiple subcodes, for instance a response that lists “School (exams, grades, assignments etc.)” would be coded based on specificity to “School”, with subcodes “Exams/Grades” and “Schoolwork”. Frequencies for subcodes of “School” are as
60% 27%
21% 6%
0% 10% 20% 30% 40% 50% 60% 70% 80% 90% 100% Schoolwork
Exams/Grades Writing/Research Qualifying Exams
Subcode Frequency
follows: “Schoolwork” (60%), “Exams/Grades” (27%), “Writing/Researching” (21%), and “Qualifying Exams” (6%).
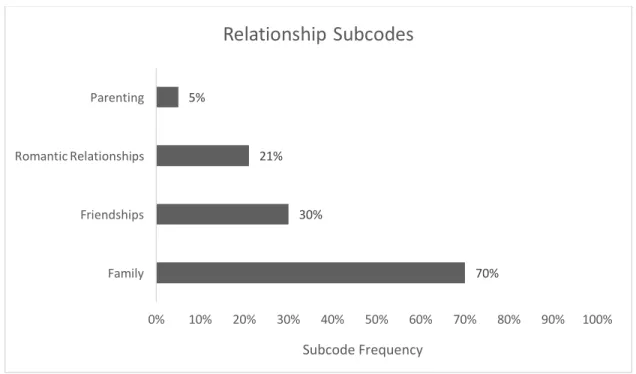
Figure 8. Subcode Frequencies for Code “Relationships”
Similarly, Figure 8 displays frequencies for subcodes of “Relationships”, which are as follows: “Family” (69.9%), “Friendships” (30.2%), “Romantic Relationships” (20.9%), and Parenting (4.7%). Much like the responses within the codes for “school” many respondents’ answers were multifaceted and often included a connotation of worry or anxiety-associated stress, as will be discussed in later sections.
70% 30%
21% 5%
0% 10% 20% 30% 40% 50% 60% 70% 80% 90% 100% Family
Friendships Romantic Relationships Parenting
Subcode Frequency
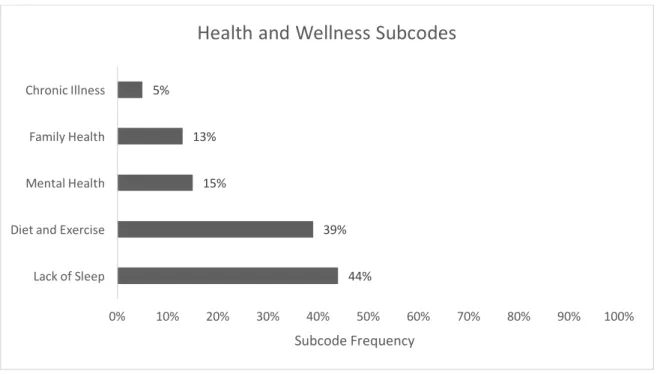
Figure 9. Subcode Frequencies for “Health and Wellness”
Recurring subcodes that emerged within the “Health and Wellness” category are as follows: “Lack of Sleep” (44%), “Diet and Exercise” (39%), “Mental Health” (15%), “Family Health” (13%), and “Chronic Illness” (5%). Again many of these items were associated with words such as “worry” and “anxiety”, which provides a more nuanced meaning to the subcodes.
44% 39% 15%
13% 5%
0% 10% 20% 30% 40% 50% 60% 70% 80% 90% 100%
Lack of Sleep Diet and Exercise Mental Health Family Health Chronic Illness
Subcode Frequency
Figure 10. Subcode Frequencies for “The Future”
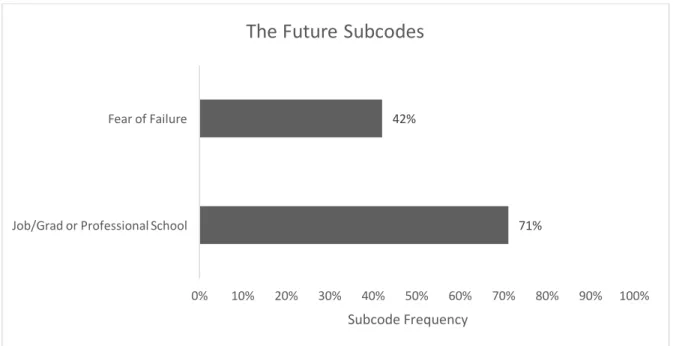
Of the “top 5” coded stressors, “The Future” was most often mentioned outright, and therefore, was only broken down into two recurring subcodes, “Job Prospects/Graduate or Professional School” and a “Fear of Failure”, with frequencies of 71% and 42% respectively. While the former is defined clearly in terms of a “future prospect”, the latter subcode is more difficult to define, but was most often mentioned outright as a “fear of failure” or “being successful”; these complexities are parceled out more in the discussion section, with additional examples provided in the chart below.
71% 42%
0% 10% 20% 30% 40% 50% 60% 70% 80% 90% 100% Job/Grad or Professional School
Fear of Failure
Subcode Frequency
Multi-Method Analysis of Free-List Stressors
Total % of Low to Mod PSS Individuals
Total % of High PSS Individuals
School 93 100
Relationships 59 57
Health and Wellness 44 57
The Future 41 36
Time Management 39 36
Schoolwork 38 43
Family 33 14
Social Life 17 36
Exams/Grades 14 36
Writing/Researching 13 14
Commuting 13 0
Friendships 12 21
Romantic Relationships 5 29
Living Situation 2 29
Mental Health 2 29
Table 3. Abbreviated Frequency of Code Occurrence by PSS; for full comparison see Appendix B
Table 3 displays a comparison between participants categorized as low-moderate stress and individuals categorized as high stress. Though the Cohen-PSS does not have an explicit categorization, these categories were determined from the normative data collected by Cohen and Devert (2012). For the purpose of this study, “High Stress” individuals had PSS values higher than one standard deviation from the reference data, and therefore had scores of 25 or higher. All other individuals were lumped into a low to moderate category of stress. Using these categories, 14/75 (19%) of individuals were categorized as experiencing “high stress”. By separating individuals in this manner, similarities and differences between coded item
As expected, individuals in the high stress group had a significantly higher frequency of “Mental Health” as a subcode (29%) than those in the low-moderate stress category (2%). The specificity of “Mental Health” coded items including “depression” and “anxiety” are likely indicative of increased perceived stress, as demonstrated by previous studies (Stallman 2010; Leppink et al. 2016). Another significant difference occurs within the subcode “Exams/Grades”, with low-moderate PSS frequency of 14% as compared to 36% in high PSS individuals. The increased specificity of the subcode may suggest that individuals who perceive school to be a source of stress because of exams and grades experience higher perceived stress than those who perceive school as a more general stressor. Examples of the free-list that support this hypothesis include those that mention exams and grades in the context of anxiety or worry, as documented by one participant with a PSS score of 25 who explicitly listed “schoolwork/worrying about grades (not enough hours in the day)” as their most salient stressor.
Total % of Women Total % of Men
School 96 90
Relationships 57 62
Health and Wellness 46 45
The Future 40 41
Time Management 39 38
Schoolwork 36 45
Finances 31 14
Exams/Grades 21 7
Friendships 16 7
Job/Graduate or Professional School 13 28
Table 4. Abbreviated Frequency of Code Occurrence by Sex; for full comparison see Appendix B
Table 4 displays the frequencies of code occurrence for men and women in this study in order to examine potential similarities and differences between the sexes. As was previously noted, primary codes remained similar between the sexes, suggesting that perceptions of major factors of stress are similar between men and women. Overall, frequencies between the sexes are fairly similar for most coded and subcoded items; however, a few significant differences are evident. Women in the study listed items related to “Finances” at a higher frequency than men, with rates at 31% and 14%, respectively. This difference suggests that, overall, women in our study perceive finances to be a more prominent source of stress in their daily lives than men in our study. Women also listed items assigned the subcode of “Exams/Grades” with a higher frequency (21%) than men (7%). Conversely, men in our study listed items related to
Codes School Relationships Health and
Wellness The Future
Time Management Subcodes Schoolwork,
Writing/ Research, Exams/Grades, Qualifying Exams Romantic Relationships , Family, Friends, Parenting
Lack of Sleep, Mental Health, Diet and Exercise, Family Health, and Chronic Illness Fear of Failure Job Prospects/ Graduate or Professional School, Deadlines
Examples “schoolwork (being behind)” “dissertation writing anxiety” “schoolwork/ worrying about grades (not enough hours in the day)” “school expectations” “school work accumulation” “grad school as a whole” “upcoming thesis deadline” “maintaining long-distance relationship” “family obligations” “needs of husband” “friends and family to support/ worry about” “miss my family” “finding time with significant other” “love life” “not enough sleep” “mental health conditions” “my health/wonder ing if I am healthy” “weight loss/fitness” “chronic fatigue” “my weight/diet/ exercise” “depression” “worrying about the future and not being good enough” “future aspirations panning out”
Inflammation as Characterized by C-reactive protein
As described in the “Methods” chapter, CRP samples were fit to a standardized curve based on eight samples of known concentrations run as duplicates for the ELISA assay. Figure 1, below, displays the standard curve to which the March assay was fit. The serial dilution should produce standards with known values of 0.0 ng/mL, 0.78 ng/mL, 1.56 ng/mL, 3.12 ng/mL, 6.25 ng/mL, 12.5 ng/mL, 25 ng/mL, and 50 ng/mL. Standard values for our assay are displayed below in blue, with orange representing the mean between the two duplicates. Analysis of the variance between the two duplicates, as shown below, displays our relative margin of error for each of the known standards.
Additionally, Table 5, below, displays the deviation for each standard and sample that were run as duplicates. In total, eight standards and ten samples were run as duplicates for the March assay. Average deviations for the standards and samples were 0.0718 mg/L and 0.0867 mg/L, respectively. Overall, average deviation for the duplicates was 0.080mg/L. A set of Quantikine ELISA Kit controls (Control Set 960) was utilized as an additional source of
Single Duplicate Deviation Average Deviation
Standards 0.002 0.002 0.000
0.090 0.067 0.011
0.137 0.160 0.011
0.308 0.348 0.020
0.528 0.693 0.082
1.22 1.32 0.047
2.37 2.60 0.116
5.25 4.68 0.287 0.072
Samples 0.468 0.471 0.001
3.57 3.09 0.236
0.026 0.018 0.004
0.069 0.065 0.002
0.183 0.193 0.005
2.35 2.87 0.260
0.009 0.053 0.022
0.573 0.860 0.143
2.80 3.16 0.180
0.239 0.214 0.012 0.087
Overall
0.080
Distributions of CRP by sex are displayed in the histograms and box plots below.
Overall, mean CRP levels were 1.14 ± 1.70 mg/L, which falls well within the normal range for a relatively young, Western population. Stratification by sex shows a significant difference of mean CRP between male and female participants (p=0.002). Mean CRP for men was 0.463 ± 0.636 mg/L, while mean CRP for women was 1.42 ± 1.91 mg/L. As is displayed in Table 2 and the figures below, CRP values for women throughout the distribution are generally higher than those for men, and the overall distribution is significantly broader within our sample. Again, the more limited sample for men may play a role in the lack of overall variation compared with women that is depicted in the CRP distribution.
As is displayed in the box and whiskers plots and table above, distributions of CRP for men and women differed significantly (p=0.005). Both distributions are right skewed, as expected. CRP levels are log-transformed in regression analyses in order to normalize the distribution.
Descriptive variables and CRP
Women (n=66) (71%) Men (n=27) (29%)
Age 23.5 (3.6) 24.2 (5.4)
Current smoker 2 (3%) 1 (4%)
Ever smoked 7 (11%) 3 (11%)
Geometric mean CRP 0.656 0.265
CRP <1.0 mg/l 41 (62%) 24 (89%)
CRP between 1.0-3.0 mg/l 15 (23%) 2 (7%)
CRP > 3.0mg/l 10 (15%) 1 (4%)
Body mass index 24.5 (5.8) 23.0 (2.7%)
Overweight 10 (15%) 5 (19%)
Obese 8 (12%) 0 (0%)
PSS Global Score 18.4 (6.3) 17.6 (5.9%)
Oral Contraceptive Use 29 (44%)
Table 6. Descriptive characteristics of study sample in relation to CRP
2014). As noted earlier, women in the study also had a higher prevalence of overweight/obesity (27% for those included in the CRP sample), compared with men (19%). Women and men both reported an approximately equal prevalence of smoking regularly and having ever smoked. Smoking has been associated with CRP in several studies and thus was considered in this study. Oral contraceptives have also been associated with increased levels of CRP; though there were no significant differences in CRP levels found in our study for either smoking behavior or oral contraceptive use using a two-tailed T-test.
Table 6 displays the geometric mean CRP for women and men, which was calculated as the exponential of the mean log-transformed CRP values (Geomean=e^(mean(lnCRP)). Since the distributions of CRP are typically right-skewed, concentrations were transformed using the lnCRP for analyses in order to approximate normality.
Illness Reported CRP<1 mg/L
(n=65)
CRP 1-3 mg/L
(n=17)
CRP>3 mg/L
(n=11)
Total Occurrence (n=93)
Allergies 21 (32.3%) 4 (23.5%) 2 (18.2%) 27 (29.0%)
Asthma 3 (4.6%) 1 (5.9%) 0 (9.1%) 4 (4.3%)
Chronic Condition 6 (9.0%) 1 (5.9%) 2 (18.2%) 9 (9.7%)
Cold/Flu 4 (6.2%) 6 (35.0%) 3 (27.3%) 13 (14%)
Diarrhea 13 (22.0%) 2 (11.8%) 2 (18.2%) 17 (18%)
Fever 1 (1.5%) 0 1 (9.1%) 2 (2.2%)
Vomiting 1 (1.5%) 0 1 (9.1%) 2 (2.2%)
Table 7. Symptom history frequency chart stratified by CRP classification
Participants were asked to indicate if they had any chronic medical conditions, allergies, or asthma, and were also asked to indicate if they had experienced symptoms of chronic
to data collection. This data was coded, and is displayed above in Table 7 as stratified by clinical classifications of CRP values. As the chart demonstrates, the most commonly reported illness was general allergies at 29%, followed by diarrhea at 18%, and cold and flu at 14%. Notably, three of the eleven individuals with elevated levels of CRP (above 3mg/L) reported symptoms of cold/flu within the past two weeks. CRP levels for these individuals were 5.03 mg/L, 9.74 mg/L, and 8.48 mg/L. Moreover, an additional six participants cited having cold and/or flu within the past two weeks and had CRP values within the more moderate 1mg/L-3mg/L range.
Concentrations of CRP in relation to various illnesses and ailments are discussed in the CRP portion of the discussion chapter.
Q1 Q2 Q3 Q4 P-value
Men
BMI 0.38 0.20 0.31 0.27 0.315
PSS 0.15 0.34 0.70 0.38 0.285
Women
BMI 0.38 0.40 0.97 1.52 0.030
PSS 0.45 0.76 1.11 0.48 0.568
lowest and third quartile of PSS for both men and women, though this trend deviates with the highest quartile. There is no association between BMI quartile and geometric mean of CRP for men in our study.
Perceived Stress and CRP
Figure 13. lnCRP against PSS Global Score for women; r=-0.028, p=0.854
Stratification by sex showed no significant associations between CRP and perceived stress in female participants (r=-0.028, p=0.854).
-5 -4 -3 -2 -1 0 1 2 3
logCRP
0 5 10 15 20 25 30 35
Figure 14. lnCRP against PSS Global Score for men; r=0.405, p=0.0613
Conversely, Figure 14, above, displays the scatterplot for lnCRP against PSS global score for men, and demonstrates a positive association between the two variables (r=0.405), though the relationship does not meet statistical significance at p<0.05 (p=0.0613).
-5 -4 -3 -2 -1 0 1 2 3
logCRP
0 5 10 15 20 25 30 35
BMI and CRP
This study hypothesized that CRP will be positively correlated with BMI such that individuals that fall within the CDC classifications for overweight/obese will have the highest levels of CRP overall.
Table 9. CRP classifications by clinical guidelines and corresponding average BMIs for male and female students
Table 9 shows the average BMI for men and women as grouped by CRP classification. Since most men in the study fell within the lowest category of CRP, analysis in terms of associated variables and CRP classification is limited. Regression analyses were conducted to
CRP<1 mg/L CRP 1-3 mg/L CRP >3 mg/L
Men
N
24 2 1
BMI 23.25 21.8 20.4
Women
N 41 15 10
examine potential associations between BMI and CRP and were also stratified by sex.
Figure 15. Scatterplot of lnCRP against BMI for women; r=0.298, p=0.0152
-5 -4 -3 -2 -1 0 1 2 3
logCRP
15 20 25 30 35 40 45 50 55
Figure 16. Scatterplot of lnCRP against BMI for men; r=-0.0433, p=0.830
As is displayed in Figure 16, a regression analysis of CRP against BMI does not find a statistically significant relationship between the two variables for men in our study.
-5 -4 -3 -2 -1 0 1 2
logCRP
18 20 22 24 26 28 30
Age and CRP
Though age was not a specific variable of focus for the hypotheses of this thesis, a considerable amount of research has demonstrated an association between age and CRP, though much of this research has focused on a broader age range, and generally older individuals. Table 7 stratifies participants into two age groups: 18-22 and 23-36, thought to best align with typical age as an undergraduate and as a graduate student, respectively. As is shown in the table, geometric means and medians are similar for each of the groups, with the exceptions of women ages 23-36 years old. Mean CRP levels for the younger cohort of our study are slightly higher than the older cohort, though a t-test between these groups did not find a statistically significant difference in means.
Age Group
Men N CRP Geometric Mean Median
18-22 14 0.530 0.250 0.245
23-36 13 0.281 0.281 0.259
Women
18-22 33 1.57 1.17 1.03
23-36 33 1.31 0.572 1.52
Table 10. Mean and median CRP by age and sex stratification
Chapter 4 Discussion Summary of Results
This thesis seeks to add to a limited literature on the role of stress in the embodiment of differential health and well-being by analyzing the associations between BMI, perceived
stressors and levels of stress and CRP in students. In order to analyze these relationships, several hypotheses were proposed, and related findings are briefly discussed below, and at greater length later in this chapter.
H1a: was not supported in this study, as there were no significant associations between perceived stress and CRP levels. H1b: male and female students did not have significantly
different levels of perceived stress, but there were differences between male and female students’ sources of perceived stress, an interesting, but perhaps unsurprising finding. H1c: Data on factors of stress did support our hypothesis that reported stressors would vary in correlation with levels of perceived stress.
H2: while there was not a statistically significant association between BMI and CRP in male students, this relationship was evident in female students. Also in support of H2, women in the highest classification for CRP also had higher BMIs than those within the clinically normal range, though the sample size for both elevated CRP and high BMI was very limited.
H4: This study did demonstrate the unique factors of stress that are commonly shared amongst most university students from our sample, and also demonstrated how many key factors of stress are unique to the educational setting in which students are immersed.
BMI and Overweight/Obesity Prevalence
In our sample, 20% of men and women fell into overweight/obese categories. NHANES data from 2013-2014 demonstrates that approximately one in three adults were considered to be overweight, and one in three adults were considered to be obese (NHANES). Sex differences in proportion of overweight to obese were also evident, with more men considered overweight, and more women considered obese (NHANES). Similarly, sex differences exist in our sample, with more female participants considered obese, but less that were considered overweight when compared with male participants. More limited male participation may contribute to the relative lack of variation within the male sample overall.
Differences in BMI distribution between young students and the general population are to be expected given age-distributions of BMI and other potential factors including access to
Comparing this with our study, a T-test demonstrates that these means do not differ significantly (p=0.993, p=0.691, for men and women respectively). The NCHA also calculated the percentage of participants who fit the overweight/obese categories defined by WHO, and showed that 27.5% of men and 19.5% of women were overweight, and 11% of men and 11.8% of women were obese (NCHA). Proportions of overweight to obese within the sexes match overall trends of a higher prevalence of overweight in men, and a higher prevalence of obesity in women
(NHANES, NCHA).
From our data set more individuals fall into the “healthy weight” category than anticipated given the results of the NCHA study. Limitations of our study including a small sample size, skewed sex ratio, and convenience sampling may also play a role in this difference. Since this sampling occurred at flu-vaccination clinics it should be considered that participants in this study may be more health-conscious relative to the general student population; it should also be noted that many of these clinics were held in buildings related to pre-health or public health fields, and were therefore more convenient for students within those fields. Few studies have considered the influence of psychosocial stress on BMI in college students.
Psychosocial Stressors and Perceptions of Stress
Though the Cohen PSS-10 is a frequently employed measure for perceived stress, few studies have considered it within the context of a college or university setting. A study conducted by Cohen and Janicki-Deverts provides normative data for individuals of various ages and
demonstrate that perceived stress has risen overall since 1983, and also demonstrate that perceived stress varies between men and women, though not always to the extent of statistical significance (Cohen and Janicki-Deverts 2012). Since the most recent year for survey
administration was 2009, this study highlights a few of those values as reference points, and are as follows:
Sex n M SD
Men 968 15.5 7.4 Women 1032 16.1 7.6 Age
Less than 25 223 16.8 6.9 25-34 433 17.5 7.3 Education
Some college 784 16.0 7.5 Bachelor’s degree 513 15.2 7.2 Advanced degree 231 14.7 7.1
*data adapted from Table 1 Who’s Stressed? Distributions of Psychological Stress in the United States in Probability Samples from 1983, 2006, and 2009- Cohen and Janicki-Deverts
between the present study and normative data, though not statistically significant, does suggest a subtle difference between perceived stress in students and the general population. Our study is notable in that it focuses on college and university students; while Cohen and Janicki-Deverts demonstrate the negative association between education and perceived stress, few studies have considered the impact of receiving an education on perceived stress. Future studies on stress within a student context should consider the employment of a standard scale, such as the PSS-10, to provide a large-scale normative data set for students and to investigate potential intra- and intercollegiate variation of experience with stress.
Individuals immersed in a collegiate environment are likely to have a unique experience with stress when compared with a more general population, and this study aims to highlight the beginnings of research within that area of focus. As is highlighted within our study, older individuals tend to have lower perceptions of stress than younger individuals, even within a collegiate context. This finding may be indicative of related hypotheses: particular qualities of being younger than 25 induce more perceived stress than the qualities and experiences of older individuals and that within a collegiate context, younger individuals have higher perceptions of stress due to the particular stressors of an undergraduate experience and acclimation-related stress.
variation in the ways in which individuals reported and characterized their experiences with these stressors. Specificity is variable within the free list data; most individuals concisely listed elements of experience, but others listed more complex and nuanced characterizations of their stressors. “School” emerged as the most prevalent and salient code of stress for participants.
Following “School”, descriptions of “Relationships” were prevalent sources of stress for college and university students. This too is anticipated, given the need to socially acclimate to a new environment as a student; moreover, social support has been negatively associated with levels of perceived stress, suggesting that relationships may act as a buffer for stress in a variety of contexts (Bovier, Chamot, and Perneger 2004). This study is unique in that it highlights that relationships themselves are a source of stress for students, with particular types of relationships emerging more prevalently than others. As is demonstrated in Figure 6 in the “Results” section, family emerged as the most frequent subcode, followed by friendships, and romantic
relationships. These subcodes suggest that certain aspects of family relationships may be more prominent sources of stress than aspects of friendships or romantic relationships. Considering the collegiate experience, it may be hypothesized that students’ lengthy separation from family and concern for their family may be sources of stress, which is evidenced by responses such as “miss my family”, and “family safety”. Other individuals attribute “conflict” and “obligations” as associated with relationships as a source of stress.
Within the “Health and Wellness” code, sleep emerged as the most frequent subcode, suggesting that students are particularly worried about the lack of sleep they are getting, likely due to its relationship with their overall health and wellbeing. Diet and exercise were also fairly prevalent subcodes, suggesting that students do have an awareness for the importance of
nutrition, exercise, and sleep on their well-being, but also display concerns about their
“chronic fatigue” and “upset stomach from food intolerance”. As an example of this, a participant reporting life-threatening health concerns fell within the high category of PSS, demonstrating the variability in severity and experience with particular stressors.
The future emerged as a uniformly frequent code, which may be expected given the liminal nature of the collegiate experience. Many participants connote the future with worry about achievement as success, including responses such as “worrying about the future and not being good enough” and “fear of failure”. Interestingly, fear of failure explicitly emerged with a frequency prevalent enough to provide it with a subcode. Again, this demonstrates the profound emotionally-connoted ways in which individuals view the future and worry about the trajectory of their perceived success.
Following the future, time management occurred with a relatively high frequency, suggesting the stress students associated with deadlines and an accumulating workload. More specifically, individuals note aspects of a lack of time, such as “not having time to spend with friends and family” and “not enough time to complete tasks”, which both demonstrate the overlap of time management and other codes such as relationships and schoolwork in some free-list responses.
by evidence demonstrated in Figures 10 and 11 in the Results section on Factors of Stress.
Uniquely, this demonstrates that particular qualities and aspects of experience are more likely to
be associated with higher perceived stress than others. Differences were also evident between
men and women in the study, though to a lesser extent than the differences demonstrated
between PSS-categorized groups. In order to help students effectively target and cope with these
stressors, it is imperative for researchers to first investigate them on a large-scale. By doing this,
researchers have an opportunity to improve the overall health and well-being of students, which
may improve the trajectory of their health and well-being throughout the rest of their lifecourse.
CRP and Inflammation in College Students
As hypothesized, students in this study had relatively low levels of CRP on average, with
85% of women and 96% of men with baseline levels of less than 3mg/L. Only five individuals,
all female, had CRP levels over 5mg/L, three of whom reported having symptoms of cold and or
flu in the past two weeks. Though this research does not focus on inflammation and illness, the
brief symptom history analysis may provide data for future analyses on inflammation,
inflammatory resolution, and self-reported experience with illness.
While a few hypotheses proposed in this thesis were not supported in the data, this study
did demonstrate a significant association between BMI and CRP in college-aged women. This
finding aligns with trends of BMI and CRP evident in older populations, and elucidates that
young adult women tend to have more adipose tissue than men, and may have differential rates
of overweight/obesity due to differential physiologies.
Despite the lack of association between perceived stress and inflammation in this
demonstrated utilizing data from the National Longitudinal Study of Adolescent Health
(NSLAH) in 2014 (Shanahan et al. 2014). Interestingly, our findings on frequencies of low,
elevated, and high CRP are lower than those collected from Shanahan and colleagues’ study,
suggesting that individuals within our study may have been healthier, which is also supported by
the considerably lower average BMI in our sample (Shanahan et al. 2014. The NSLAH data
study provides a framework of multiple survey methods as potential predictors of inflammation
and physiological embodiment. Future studies may consider following this model of stress
through the employment of additional surveys specific to the college experience, and should
continue to analyze the multifactorial experiences of stress within a daily context.
This study is one of few to analyze CRP levels in a young, healthy adult population. By
analyzing baseline CRP levels, this research not only illuminates differential baseline
inflammation, but also provides a comparative framework for future research examining
inflammation and inflammatory response in young adults. Moreover, this study adds to a body of
literature that is beginning to understand how stress may be embodied and produce differential
disease outcomes that are becoming increasingly pervasive globally, including metabolic
syndrome and overweight and obesity more generally.
. Future studies may consider following this model of stress through the employment of
additional surveys specific to the college experience, and should continue to analyze the
Conclusion
This study had several limitations that must be acknowledged, one of which is a
relatively small male sample, and heavily skewed female sample. Bloodspots were collected only
once, and therefore provided a cross-sectional reference sample to analyze baseline
inflammation. A more longitudinal framework may be beneficial, particularly in studies for
which inflammatory fluctuations are of interest. The implementation of other stress scales to
supplement the Cohen PSS-10, as well as more interview-based qualitative data collection on
how individuals conceptualize, characterize, and cope with their stress would have been
beneficial to supplement free-list responses.
Studies such as this can be utilized to grasp an understanding of recurring sources of
stress in the lives of students, as well as particular groupings of those themes. Future research
should refine demographic categories and should consider collecting information on field of
study, year, and employment to analyze more context behind differential sources and levels of
perceived stress among students. While free-list data provides a window into prominent sources
of stress, further work could include more ethnographic components such as interviews and
focus groups in order to reveal the more nuanced complexities of stressors. Moreover, future
research should gauge participants’ perspectives on the severity and duration of stressors, as
being able to differentiate between acute and chronic stressors and how intense or severe
individuals perceive them to be will provide more insight into the unique stressors students face,
and could be interesting for risk modeling.
Researchers might also analyze coping mechanisms and strategies employed by students
to determine if certain coping mechanisms are more prevalent among individuals with lower
The emphasis on the integration of methods traditionally employed in biological and cultural
anthropologies will provide researchers with unique insight into the differential cognition,
physiology, and behavior of individuals. Studies on university students additionally provide
researchers with a chance to conduct comparative research across the nation and in international
settings. By replicating studies such as this, with a few improvements, researchers can not only
begin to understand differential stress and corresponding physiologies within a singular
References
American College Health Association. American College Health Association-National College
Health Assessment II: Reference Group Executive Summary Spring 2017. Hanover, MD:
American College Health Association; 2017.
Barbosa-Leiker, Celestina, et al. “Cross-Sectional and Longitudinal Relationships between
Perceived Stress and Reactive Protein in Men and Women: Perceived Stress and
C-Reactive Protein.” Stress and Health, vol. 30, no. 2, Apr. 2014, pp. 158–65. CrossRef,
doi:10.1002/smi.2507.
Benjamin, Emelia J., et al. “Heart Disease and Stroke Statistics—2018 Update: A Report From
the American Heart Association.” Circulation, Jan. 2018, p. CIR.0000000000000558.
circ.ahajournals.org, doi:10.1161/CIR.0000000000000558.
Black, Paul H. “The Inflammatory Response Is an Integral Part of the Stress Response:
Implications for Atherosclerosis, Insulin Resistance, Type II Diabetes and Metabolic
Syndrome X.” Brain, Behavior, and Immunity, vol. 17, no. 5, Oct. 2003, pp. 350–64.
CrossRef, doi:10.1016/S0889-1591(03)00048-5.
Bovier PA, et. Perceived Stress, Internal Resources, and Social Support as Determinants of
Mental Health among Young Adults. - PubMed - NCBI.
https://www.ncbi.nlm.nih.gov/pubmed/15058797. Accessed 29 Mar. 2018.
Boyce, J. A., and R. G. Kuijer. “Perceived Stress and Freshman Weight Change: The Moderating
Role of Baseline Body Mass Index.” Physiology & Behavior, vol. 139, Feb. 2015, pp.
Burger, Danielle, and Jean-Michel Dayer. “Cytokines, Acute-‐Phase Proteins, and Hormones.”
Annals of the New York Academy of Sciences, vol. 966, no. 1, June 2002, pp. 464–73.
nyaspubs.onlinelibrary.wiley.com, doi:10.1111/j.1749-6632.2002.tb04248.x.
Cohen, Sheldon, and Denise Janicki-Deverts. “Who’s Stressed? Distributions of Psychological
Stress in the United States in Probability Samples from 1983, 2006, and 2009.” Journal
of Applied Social Psychology, vol. 42, no. 6, 2012, p. 1320. repository.cmu.edu,
doi:10.1111/j.1559-1816.2012.00900.x.
Cohen, Sheldon, et al. “A Global Measure of Perceived Stress.” Journal of Health and Social
Behavior, vol. 24, Dec. 1983, pp. 385–296.
Dandona, Paresh, et al. “Metabolic Syndrome: A Comprehensive Perspective Based on
Interactions Between Obesity, Diabetes, and Inflammation.” Circulation, vol. 111, no.
11, Mar. 2005, pp. 1448–54. circ.ahajournals.org,
doi:10.1161/01.CIR.0000158483.13093.9D.
Després, Jean-Pierre. “Body Fat Distribution and Risk of Cardiovascular Disease: An Update.”
Circulation, vol. 126, no. 10, Sept. 2012, pp. 1301–13. circ.ahajournals.org,
doi:10.1161/CIRCULATIONAHA.111.067264.
Flegal KM, Kruszon-Moran D, Carroll MD, Fryar CD, Ogden, CL. Trends in obesity among
adults in the United States, 2005 to 2014. The Journal of the American Medical
Johnson, Amy R., et al. “The Inflammation Highway: Metabolism Accelerates Inflammatory
Traffic in Obesity.” Immunological Reviews, vol. 249, no. 1, Sept. 2012, pp. 218–38.
CrossRef, doi:10.1111/j.1600-065X.2012.01151.x.
Ledue, Thomas B., and Nader Rifai. “Preanalytic and Analytic Sources of Variations in
C-Reactive Protein Measurement: Implications for Cardiovascular Disease Risk
Assessment.” Clinical Chemistry, vol. 49, no. 8, Aug. 2003, pp. 1258–71.
clinchem.aaccjnls.org, doi:10.1373/49.8.1258.
Leppink, Eric W., et al. “The Young and the Stressed: Stress, Impulse Control, and Health in
College Students.” The Journal of Nervous and Mental Disease, vol. 204, no. 12, Dec.
2016, pp. 931–38. insights.ovid.com, doi:10.1097/NMD.0000000000000586.
McDade, Thomas. “Beyond the Gradient: An Integrative Anthropological Perspective on Social
Stratification, Stress, and Health.” Health, Risk, and Adversity, Berghahn Books, 2009,
pp. 209–235.
McDade, Thomas W., et al. “What a Drop Can Do: Dried Blood Spots as a Minimally Invasive Method for Integrating Biomarkers into Population-Based Research.” Demography, vol. 44, no. 4, Nov. 2007, pp. 899–925. link.springer.com, doi:10.1353/dem.2007.0038.
McEwen, Bruce S. “Central Effects of Stress Hormones in Health and Disease: Understanding
the Protective and Damaging Effects of Stress and Stress Mediators.” European Journal
of Pharmacology, vol. 583, no. 2–3, Apr. 2008, pp. 174–85. CrossRef,
doi:10.1016/j.ejphar.2007.11.071.
Meier-Ewert HK, et. Absence of Diurnal Variation of C-Reactive Protein Concentrations in
Mortensen, Richard F. “C-Reactive Protein, Inflammation, and Innate Immunity.” Immunologic
Research, vol. 24, no. 2, Oct. 2001, pp. 163–76. link.springer.com,
doi:10.1385/IR:24:2:163.
Rifai, N. “Population Distributions of C-Reactive Protein in Apparently Healthy Men and
Women in the United States: Implication for Clinical Interpretation.” Clinical Chemistry,
vol. 49, no. 4, Apr. 2003, pp. 666–69. CrossRef, doi:10.1373/49.4.666.
Roberts, William L., et al. “Evaluation of Four Automated High-Sensitivity C-Reactive Protein
Methods: Implications for Clinical and Epidemiological Applications.” Clinical
Chemistry, vol. 46, no. 4, Apr. 2000, pp. 461–68.
Salazar, Juan, et al. “C-Reactive Protein: Clinical and Epidemiological Perspectives.”
Cardiology Research and Practice, vol. 2014, 2014. www.ncbi.nlm.nih.gov,
doi:10.1155/2014/605810.
Shanahan, Lilly, et al. “Self-Rated Health and C-Reactive Protein in Young Adults.” Brain, Behavior, and Immunity, vol. 36, Feb. 2014, p. 139.
Seeman, Melvin, et al. “Social Status and Biological Dysregulation: The ‘Status Syndrome’ and
Allostatic Load.” Social Science & Medicine (1982), vol. 118, Oct. 2014, p. 143.
www.ncbi.nlm.nih.gov, doi:10.1016/j.socscimed.2014.08.002.
Stallman, Helen M. “Psychological Distress in University Students: A Comparison with General
Wardle, Jane, et al. “Stress and Adiposity: A Meta-‐Analysis of Longitudinal Studies.” Obesity,
vol. 19, no. 4, Apr. 2011, pp. 771–78. onlinelibrary.wiley.com,
doi:10.1038/oby.2010.241.
Worthman, Carol M., and E. Jane Costello. “Tracking Biocultural Pathways to Health
Disparities: The Value of Biomarkers.” Annals of Human Biology, vol. 36, no. 3, 2009, pp. 281–97. PubMed Central, doi:10.1080/03014460902832934.
Yudkin, John S., et al. “Inflammation, Obesity, Stress and Coronary Heart Disease: Is
Interleukin-6 the Link?” Atherosclerosis, vol. 148, no. 2, Feb. 2000, pp. 209–14.
Appendix A
Full Lab Protocol for ELISA Assay for hs-CRP Using Quantikine Kit
SAMPLE PREPARATION: DAY 1 Pre-activities
• Check kit expiration • Put gloves on
• Set RD5P concentrate out to room temperature for later preparation of Calibrator Diluent
o RD5P concentrate is at appropriate temperature when crystals/precipitate have dissolved
• Review forward pipetting technique:
o depress to first stop, insert under surface, release, place in container on side of wall without touching, then depress to first stop, then depress to end
Bloodspot Samples: Labeling
• Lay out dust-free surface paper absorbent side down • Bring out bloodspot samples from refrigerator
• Label bloodspot card ID numbers on small 2mL closing tubes and place in stand,
consider using tape over the writing to ensure that it stays legible Calibrator Diluent Preparation
• Process:
o Combining 5mL of Calibrator Diluent RD5P Concentrate with 20mL DI H2O to make 25mL of Calibrator Diluent
• Add 20mL of DI H2O into 50mL beaker
• forward pipette 1mL*5 of Calibrator Diluent RD5P Concentrate into beaker
o Note:
§ Use the 100-1000µL pipette
§ release on wall & check dial at 1mL
• Mix solution with pipette by injecting and releasing under surface to avoid bubbles • Note: Sample preparation instructions by Quantikine suggests a 100 fold dilutions, but
we are using the diluted Calibrator Diluent (above) to elute the blood spots to
o Note: periodically check for debris on absorbent paper
• After tray is full place on counter
Bloodspot Samples: Elution
• Process:
o Eluding 3.2mm (1/8 inch) diameter bloodspots to 1.5 µL serum sample dilution (McDade’s instructions) to specified requirements of the Quantikine CRP kit.
• Pick up 2mL tube containing the blood circle sample • Pipette 250µL of Calibrator Diluent into one and cap
o Note:
§ Use forward pipetting & release on wall
§ Go slow because the pressure is high and you want to avoid it splashing out
• Vortex for 30 seconds
• Check circle is completely covered by solution • Repeat for all samples
• Refrigerate overnight at 4˚C
Notes:
• DI H20 is deionized water
• When adding Assay Diluent to the plate, lean the pipette tip across and hit the side so it
doesn’t splash out
REAGENT PREPARATION & ASSAY: DAY 2 Pre-activities
• Bring kit to room temperature
o Put substrate in drawer
• Plan and fill out plate sheet with matching standards, duplicates, controls and samples
o 96 wells, using 73 unique samples
§ 16 standards: 8 standards run as duplicates
§ 2 controls: 2*1 (one will be used as a positive control, the other a negative control)
§ 5 duplicates: yielding total of 10, others are run singleton, if you can allocate more samples, do so
§ 68 single samples Water Buffer Preparation
• Warm wash buffer to room temperature to dissolve crystals • Invert wash buffer container to gently mix
• Add 20mL of wash buffer in 50mL graduated cylinder • Add wash buffer to 600mL beaker
• Add 480mL of DI H20 to 500mL line
§ Use DI H2O water jug to pour near line
§ Then use squirt bottle til 500mL line
• Pour into new squirt bottle
Calibrator Diluent Preparation
• pipette 400µL of Calibrator Diluent RD5P Concentrate into 750mL glass tube • pipette 1600µL of DI H20 in tube to make 2mL of Calibrator Diluent
• Mix with pipetting under surface- 1:5 (dilution)- this aligns with kit and prepared diluent
from yesterday (5:20) 1:5 dilution; since we made more diluent solution yesterday, we will reuse
Standard Preparation
• Label 6 standard 2mL capped tubes
• Pipette 200µL of Calibrator Diluent into each tube
• Pipette 200µL of Standard concentrate into 25ng/mL tube and vortex for 1 min • Continue dilution per kit instructions
Assay Procedures
• Change bench paper • Notes:
o Have someone track well filling o Fill by columns
o Change out tip and slowly pipette to minimize bubbles
• Use kit instructions
• Add 50 µL of either standard, control, or sample to each well in accordance with
designation on plate map
o Note that for small amounts the last half stop can be discarded as the liquid has been expelled from the pipette tip and this can cause air bubbles to form in the wells; make sure to test using scale to ensure that pipette still expels 0.050g
• Cover with the adhesive strip provided with the kit and allow to incubate for two hours at
room temperature
• After the incubation run a repeat of 4 aspirations and washes using the plate washer.
Make sure that the plate washer has wash buffer loaded and connected
• After the last wash, remove any remaining wash buffer by aspiration or decanting, tap
gently on paper towel to remove excess liquid
• Add 200 µL Human CRP conjugate to each well, cover with a new adhesive strip and