Consequences of Persistent Mitochondrial DNA Damage and Increased Oxidative Stress By
Lauren Donoghue
Undergraduate Honors Thesis submitted to the faculty of the Department of Environmental Sciences and Engineering in the Gillings School of Global Public Health at the University of
North Carolina at Chapel Hill
Acknowledgements
Dr. Joel Meyer, the Meyer laboratory group, and Dr. Leena Nylander-French provided the strong support system and encouragement that made this project possible. Dr. Meyer’s willingness for me to pursue an honors thesis project in his laboratory and open door not only provided me with a learning-intensive experience that has prepared me for the future, but also instilled the
experience-based belief that research is most productive and rewarding when done with great people. The entire Meyer laboratory group contributed to the stimulating environment that made this project a pleasure. Elena Turner provided beneficial mentor support in the laboratory and always helped me think of our research in the context of the bigger picture of toxicology. Ian Ryde dedicated many hours helping me learn how to carry out the experiments successfully and analyze the data, in addition to helping me strengthen my technical skills in the laboratory. Claudia Gonzalez helped significantly with her instruction on statistical analysis/interpretation and in experiments.
Dr. Nylander-French’s continued support throughout my time as an undergrad
encouraged me to enter the field of toxicology and exposure research with intention, confidence, and high standards for myself. Her encouragement and advice helped me write a thesis I am proud to share. Dr. Jayne Boyer’s mentoring and friendship also shaped my laboratory abilities and helped me receive more opportunities for learning.
TABLE OF CONTENTS
ABSTRACT……….…....5 List of Figures……….….6 Abbreviations………...7 1. INTRODUCTION……….…….8-13 1.1 Project Background………...8-11 1.2 Project Aims and Supporting Evidence……….11-13 2. MATERIALS AND METHODS
2.1 Nematode Culture………14 2.2 UVC Exposures………..14-15 2.3 Larval Arrest Screening……….…..…15 2.4 Growth Assay………...………16 2.5 Mitochondrial and Nuclear Genome Copy Number………...16-17 2.6 Heat Shock Protein Gene Expression……….18-21 2.7 DNA Damage Assay………...21-22 2.8 Statistical Analysis………..…….22 3. RESULTS
4. DISCUSSION
ABSTRACT
Environmental toxicants such as polycyclic aromatic hydrocarbons can cause irreparable mitochondrial DNA damage. Mitochondria play a critical role in energy production and aging. Mitochondrial dysfunction has been associated with diseases occurring in 1 in 4,000 individuals. In C. elegans nematodes, persistent mitochondrial DNA damage during development from exposure to ultraviolet C (UVC) irradiation results in delays in development, reduced ATP production and reduced oxygen consumption and, thus, suggesting dysfunction of the electron transport chain (ETC). The mechanism by which UVC irradiation causes these effects is unclear; one hypothesis is that UVC irradiation-induced mitochondrial dysfunction results in production of reactive oxygen species (ROS). Both ETC dysfunction and UVC exposure can increase levels of ROS associated with increased cellular damage and homeostatic cell signaling. I investigated the larval arrest, growth, genome copy number, and regulation of unfolded protein responses by heat shock proteins in superoxide dismutase (SOD) mutant C. elegans with persistent
mitochondrial DNA damage to investigate the potential role of increased oxidative stress. Development delay, growth inhibition, and a decrease in mitochondrial-to-nuclear genome copy number, were seen in UVC-exposed mitochondrial SOD mutants compared to UVC-exposed wild-type while cytosolic SOD mutants exhibited altered phenotypes similar to wild-type. No nematode strains showed significant upregulation of mitochondrial, endoplasmic reticulum, or cytosolic heath shock proteins. These results suggest that UVC exposure specifically affects mitochondria and that the effects of the mitochondrial DNA damage are exacerbated by
needed to determine the mechanism(s) that contribute to these altered phenotypes and the extent of ETC dysfunction due to persistent mitochondrial DNA damage caused by UVC irradiation. List of Figures
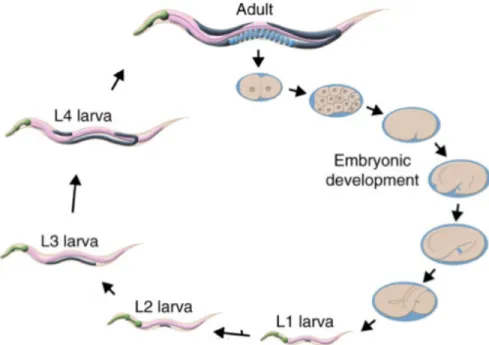
Figure 1. Developmental progression of C. elegans
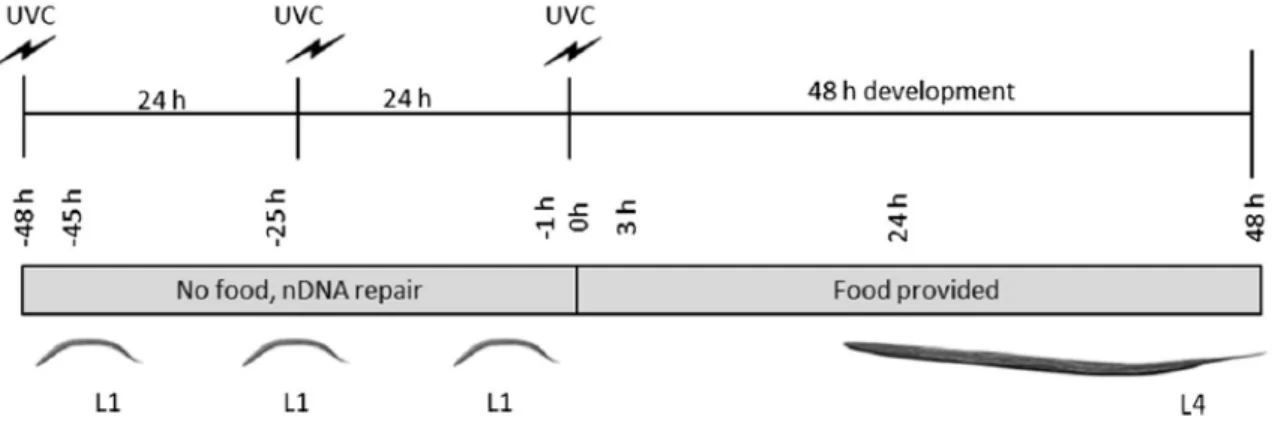
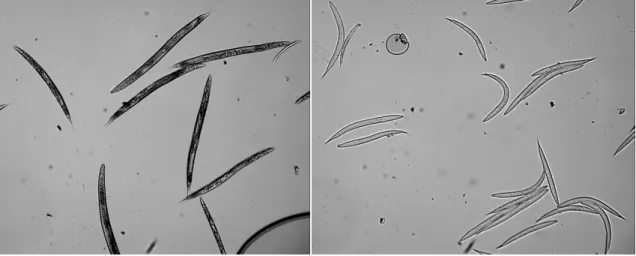
Figure 2. Schematic of UVC exposure protocol (adapted from Leung et al., 2013) Figure 3. Example of microscopy for Growth Assay
Figure 4. Growth of N2 Figure 5. Growth of sod-2 Figure 6. Growth of sod-3
Figure 7. Percent unexposed control growth of N2, sod-2, sod-3 Figure 8. Growth of N2
Figure 9. Growth of sod-2/3 Figure 10. Growth of sod-1/4/5
Figure 11. Percent unexposed control growth of N2, sod-2/3, sod-1/4/5 Figure 12. Mitochondrial copy number in N2, sod-2/3, sod-1/4/5 Figure 13. Nuclear copy number in N2, sod-2/3, sod-1/4/5
Figure 14. Mitochondrial/nuclear copy number in N2, sod-2/3, sod-1/4/5 Figure 15. Gene expression of hsp-6
Abbreviations
PAH – polycyclic aromatic hydrocarbon UVC – ultraviolet C radiation
mtDNA – mitochondrial DNA/genome ETC – Electron transport chain
OXPHOS – oxidative phosphorylation ROS – reactive oxygen species
nDNA – nuclear DNA/genome SOD – superoxide dismutase
MnSOD – manganese-binding superoxide dismutase Cu/ZnSOD – copper or zinc-binding superoxide dismutase hsp – heat shock protein
L1, L2, L3, L4 – first, second, third, fourth larval stage of C. elegans N2 – wild-type C. elegans strain
ER – endoplasmic reticulum
(UPRmt) – mitochondrial unfolded protein response
(UPRER) – endoplasmic reticulum unfolded protein response (UPRCYT) – cytosolic unfolded protein response
1. INTRODUCTION
1.1 Project Background
Mitochondria are fundamental to the health of organisms relying on aerobic cellular respiration for energy. Mitochondrial dysfunction is responsible for a wide variety of mitochondrial diseases that affect about 1 in 4,000 individuals and include diseases that can affect function of vital organs such as the brain, heart, and liver apparently due to their high energy requirements (1,2). Some environmental toxicants and pharmaceuticals such as chemotherapeutics and antiviral drugs have been shown to selectively target mitochondria (3). Exposure to polycyclic aromatic hydrocarbons (PAHs), a group of environmental toxicants found in cigarette smoke and fuel burning byproducts, can irreparably damage mitochondrial DNA (4,5). Unlike the nuclear genome, the mitochondrial genome does not have nucleotide excision DNA repair machinery, which can remove bulky DNA adducts caused by PAH exposure plus other photodimers such as the pyrimidine dimers caused by ultraviolet-C (UVC) irradiation. While there is evidence in both human fibroblasts and Caenorhabditis elegans (C. elegans) nematodes that mitochondrial DNA (mtDNA) damage is removed through autophagy (6,7) and that over time the DNA damage will be diluted by an increase in mitochondrial genome copy number (7), the mechanisms responsible for removing such mtDNA damage are not fully understood.
and the tRNA and rRNAs required for mitochondrial protein translation (9). OXPHOS is necessary for the production of ATP used as cellular energy.
Exposure to UVC during C. elegans development results in pyrimidine dimers that are irreparable in mitochondrial DNA but repairable in nuclear DNA (7). Persistent mitochondrial DNA damage results in larval developmental arrests. In C. elegans, development occurs as a progression through four larval stages referred to as L1, L2, L3, and L4 until they reach
adulthood and reproductive maturity (as shown in Figure 1). The progression from the L3 (third) to L4 (fourth) larval stage requires OXPHOS. Transition from L3 to L4 is delayed after UVC exposure, suggesting ETC dysfunction (6, 7). Additionally, altered phenotypes observed after exposure to UVC are decreased ATP production, decreased oxygen consumption, and a decreased ratio of mitochondrial-to-nuclear genome copy number that provides additional evidence of possible ETC dysfunction (7).
As in humans, the ETC in C. elegans consists of five protein complexes encoded by both the nuclear and mitochondrial genomes. These proteins form the ETC from a stoichiometric balance between transcripts from both genomes. The mechanism(s) responsible for ETC dysfunction after persistent mtDNA damage are not currently known. It is postulated that the contributing mechanisms include altered transcription caused by mtDNA damage, increased oxidative damage from reactive oxygen species (ROS), altered cell signaling, an imbalance between the nuclear and mitochondrial proteins of the ETC, and epigenetic modifications.
In this project, I investigated the role of ROS in the ROS-related biological processes of C. elegans after exposure to UVC. ROS is a term used for highly reactive oxygen species
including hydrogen peroxide, peroxide, hydroxyl ions, and superoxide anions. ROS species have beneficial roles in cells through their participation in cellular signaling and harmful roles in cells through their ability to cause oxidative damage to proteins, DNA, and lipids (11, 12).
Mitochondria are endogenous sources of ROS; for example, under normal function, the ETC reduces 1-2% of the oxygen it uses to superoxide anions (O—) (11, 13). The superoxide anions are primarily a byproduct from the conversion of O2 to H2O from the fourth ETC complex, cytochrome C oxidase. Irregular activity of the ETC caused by slower flow of electrons through the chain, the reversed flow of electrons, or an uncoupling of regulation of the electron gradient used by the ETC, can result in an increased production of superoxide anion by the first and third complexes (13-17). The superoxide anions remain in the mitochondria and are not believed to diffuse through the membrane into the cytosol because of their charge and highly reactive nature (11).
Cells have antioxidant enzymes to help prevent the damaging effects of ROS by
superoxide dismutase (SOD) which converts O— to H2O2, catalase which converts H2O2 to H2O and O2, and glutathione peroxidases which converts organic peroxidases to alcohols and H2O2 to H2O (11). Humans have genes encoding three different location-specific SOD enzymes while C. elegans have five. These include sod-2 and sod-3 which encode mitochondrial SODs that bind
manganese (MnSOD), sod-1 and sod-5 that encode cytosolic SODs which bind copper and zinc (Cu/ZnSOD), and sod-4 that encode extracellular SOD and also binds copper and zinc
(Cu/ZnSOD). These enzymes convert O— and H+ into H2O2, H2O, and O2.
The nuclear and mitochondrial genomes of C. elegans are mapped, which allows for the use of gene knockout mutants and transgenic strains for the study of their biological processes, many of which are conserved with higher eukaryotes (18). To selectively investigate how persistent mtDNA damage induced by UVC exposure could lead to increased superoxide anion production and oxidative stress from ETC dysfunction, I used several strains of gene knockout sod mutants. While SOD deficiencies do not necessarily result in increased oxidative stress,
studies have shown that sod mutants such as sod-2 have increased steady-state ROS and superoxide levels (19, 20). In this project, levels of ROS in these mutants are not directly
measured, so it can only be assumed and not concluded that superoxide levels are increased. The mutants are understood to have decreased defenses to superoxide anion reactivity. The mutants are used as a genetic approach to indirectly study the effects of environmental exposure to mitochondrial toxicants. Due to their altered genetic makeup, measurement of the effects seen in mutants are considered more conservative than what would occur from environmental exposures to a normal background.
In a preliminary experiment for this project, C. elegans mutants deficient in MnSODs (sod-2 and sod-3 single-gene mutants) exposed to UVC had a longer developmental arrest from the OXPHOS-requiring L3 to L4 transition compared to wild-type. This indicated that increased sensitivity to mitochondrial ROS (due to MnSOD deficiency) further inhibited the OXPHOS capacity of nematodes with persistent mtDNA damage.
To further investigate the biological processes underlying these observations, I investigated developmental arrest, growth inhibition, mitochondrial-to-nuclear genome ratio recovery, regulation of heat shock protein genes, and mitochondrial and DNA damage recovery of sod-2/3 and sod-1/4/5 mutants, and wild-type (N2) nematodes after exposure to UVC to test hypotheses. The sod-2/3 double-gene mutants were used to specifically explore the biological processes in the mitochondria that result from decreased defense to superoxide from the ETC. A sod-1/4/5 triple-gene mutants were used to explore ROS-related biological processes outside of
the mitochondria and also served as a unexposed control to the mitochondrial-specific mutants. Additionally, exposure to UVC results in a low level of ROS production. In this project, UVC exposure induced the persistent mtDNA damage studied. Use of the sod-1/4/5 mutants also allowed for investigation of ROS sensitivity outside of the mitochondria that would likely result from the UVC exposure protocol rather than ETC dysfunction, although superoxide anion is not reported as a primary ROS from UVC exposure (21). Explanation of interest in the specific biological outcomes listed, hypotheses, and evidence of these hypotheses are presented below.
superoxide. I also hypothesized that the non-mitochondrial sod-1/4/5 mutants would have a developmental progression similar to wild-type C. elegans because cytosolic or extracellular superoxides are not expected to be involved in the same mechanism of development arrest. In addition, I hypothesized that MnSOD mutants would have inhibited growth during development due to a decreased ability to produce energy for cells while sod-1/4/5 mutants would have a normal growth.
Leung et al. (2013) showed a decrease in mitochondrial-to-nuclear genome copy number ratio throughout the development after exposure to UVC (7). I hypothesized that sod-2/3 mutants would exhibit a decreased, or comparative to wild-type, mitochondrial copy number due to increased mtDNA damage from ROS in the mitochondria. I also hypothesized that sod-1/4/5 mutants would exhibit a decreased, or comparative to wild-type, nuclear genome copy number due to increased nuclear DNA (nDNA) damage from cytosolic ROS.
Heat shock proteins (hsp) are molecular chaperone proteins that are upregulated in response to stress (such as oxidative stress) and aid in the proper folding of proteins or degradation of lingering proteins through their role in the unfolded protein responses (22). I hypothesized that N2, sod-2/3, and sod-1/4/5 would all exhibit upregulation of hsp genes
Bess et al. (2012) showed an increase in mtDNA lesions after a single UVC exposure in wild-type nematodes (1). Therefore, the sod-2/3 mutants were expected to show a slight increase in mtDNA lesions due to increased oxidative mtDNA damage. The sod-1/4/5 mutants were expected to show a slight increase in nDNA lesions due to increased oxidative nDNA damage. 2. MATERIALS AND METHODS
2.1 Nematode Cultures
All nematode strains were grown and stored at 20°C on K-agar plates seeded with Escherichia coli strain OP50. Wild-type N2 (Bristol), sod-2 (gk257) I, and sod-3 (tm760) II nematodes were
obtained from the Caenorhabditis Genetics Center (CGC; Minneapolis, MN, USA). The sod-2/3 [sod-2 (gk257) I; sod-3 (tm760) X] double-mutant stain and sod-1/4/5 triple-mutant strain [sod-1
(tm776); sod-5 (tm1146) II; sod-4 (gk101) III] were obtained from Bart Braeckman (Ghent
University, Ghent, Belgium). Nematode eggs were collected from plates by dissolving gravid
adults with a 5% sodium hypochlorite solution. Eggs were hatched in K-medium with MgSO4,
CaSO4, and cholesterol to obtain developmentally synchronized L1 larvae.
2.2 UVC Exposure
Synchronized L1 nematodes were plated onto unseeded, non-peptone K-agar plates to prevent bacterial growth. This starvation developmentally arrested the nematodes at the L1 stage. For each plate of UVC-exposed nematodes, a plate of unexposed nematodes was maintained under the same conditions in order to provide unexposed controls. After hatching and plating,
nematodes were exposed to 7.5 J/m2 UVC irradiation three times at 0, 24, and 48 h, as previously described in Bess et al. (2012). The exposure time was calculated using a UVX Digital
increase consistency between experiments. Exposed and unexposed control nematodes were transferred to OP50-seeded plates after they received the third UVC exposure.
Figure 2. Schematic of UVC exposure protocol (adapted from Leung et al., 2013).
2.3 Larval Arrest Screening
2.4 Growth Assay
At 24, 48, 72, and 96 h after the last UVC exposure, 100-200 nematodes were rinsed from plates with K-medium and collected in 2-mL microcentrifuge tubes. Tubes were stored at -20°C for at least 20 min to kill the nematodes. Tube labels were covered with a randomized number to reduce potential bias when measuring samples. Nematode pellet (10 µL) was placed on a thin K-agar pad on a glass slide. Using an Axioskop fluorescent microscope (Zeiss, Germany) and 10X objective, 15 or 20 nematodes on each slide were measured by tracing the outer body-line from the tip of the tail to the middle of the mouth using NIS Elements Basic Research software (v. 3.2, Nikon Instruments, Inc., Melville, NY). Each plate was observed for gravid adults and egg hatching at each time point to recognize progeny that was present on slide samples. Averages and standard deviations were calculated for each set of 20 measurements/sample. Statistical analyses were carried out as described in section 2.8.
2.5 Mitochondrial and Nuclear Genome Copy Number
2.5.1 Sample Collection
2.5.2 Real-time PCR
Reactions were carried out largely as described previously by Leung et al. (2013) (7). Primers for the nuclear gene cox-4 were used to measure nuclear copy number and primers for the mitochondrial gene nd-1 were used to measure mitochondrial DNA copy number. Real-time PCR reactions contained 2 µL of lysed sample, 12.5 µL of SYBR Green PCR Master Mix (Applied Biosystems), 2.0 µL of forward and reverse primers at 5 µM (400 µM final
concentration) and 8.5 µL H2O. Samples were run in triplicate. Reactions were amplified in the 7300 Real Time PCR System (Applied Biosystems) for 2 min at 50°C, 10 min at 95°C, 40 cycles of 15 sec at 95°C, and then 60 sec at 60°C. Dissociation temperature curves were generated and assessed for each sample to ensure a singular product.
A sample of sterilized 20 glp-1 nematodes in 20 µL were diluted to make a standard curve of 1568, 784, 392, 196, 98, and 49 nuclear genome copies and run as described above. A plasmid with a mitochondrial genome insert was diluted and used to prepare a standard curve of 64,000, 48,000, 32,000, 24,000, 16,000, 12,000, 8,000, 6,000, and 4,000 mitochondrial genome copies (23).
The real-time PCR cycle threshold (Ct) values were averaged across biological
2.6 Heat Shock Proteins - Gene Expression Measurements
2.6.1 Real-time PCR Primers and Optimization
Sequences of the C. elegans heat shock protein genes were obtained online from
http://www.wormbase.org/. Two isoforms of the hsp-60 gene were noted. The modified
sequences were inputted to the Primer 3 online software for primer design
(http://bioinfo.ut.ee/primer3/). Default settings were accepted after modifying the desired product length to be 75 – 200 base-pairs. Output-primer sequences were considered if the annealing temperatures were less than 1.5 degrees between the forward and reverse primers, GC content was near 50%, and the primers covered the intron/exon junctions. Three test primers were ordered for each gene (Integrated DNA Technologies, Coralville, IA).
All test primers were used in the real-time PCR reactions with reverse transcribed existing N2 RNA. All primers were run in reactions with annealing/extension temperatures of 56°C, 58°C, 60°C, and 62°C to find optimal temperatures (allowed for Ct values between 19-22) and primers that created single products (dissociation stages and analysis were added). Product sizes were analyzed by gel electrophoresis. Two percent agar gels were produced with agar, 50 µL SB buffer (1x), and 5 µL Syber Safe (Invitrogen, Carlsbad, CA). A 5-µl sample of Hyper ladder V was used as a ladder (Invitrogen). Cyan yellow buffer (6x) was mixed with each sample at 1.25 µL cyan yellow buffer and 9 µL sample for a total of 10.15 µL in 10 µL wells. Product sizes were checked against the projected product lengths for the test primers and confirmed. Sequences of the best primer-pairs for each gene were as follows:
hsp-6: Forward: TCGTGTCATCAACGAGCCAA Reverse: AGCGATGATCTTATCTCCAGCG Product size: 76 base pairs
hsp-16.2: Forward: CGCCAAAGAAAGAAGCGGTT
Reverse: CTTCGACGATTGCCTGTTGA Product size: 60 base pairs
*This primer does not overlap an exon-exon junction hsp-16.41: Forward: TGGACGAACTCACTGGATCTG
Reverse: TGAGAGACATCGAGTTGAACCG Product size: 133 base pairs
hsp-60a: Forward: AGGCTCTTACCACTCTTGTTCT
Reverse: CTCCCGTCGCAATTCCCATA Product size: 123 base pairs
hsp-60b: Forward: CCAAGAAGGTCACCATCACC
Reverse: TCTGTTTGATCTCCACGCCC Product size: 64 base pairs
2.6.3 Nematode Sample Collection
and 0.1 mL of beta-mercaptoethanol. Samples were immediately frozen in liquid nitrogen and stored at -80°C until analysis. There were six biological replicates for 24 and 48 h, and four biological replicates at 72 h.
2.6.4 mRNA Extraction
Samples were thawed at 37°C and transferred to 1.7-mL microcentrifuge tubes filled with 0.5 mL of zirconia/silica beads (Next Advance, Inc, Averill Park, NY) Tube caps were double wrapped with Parafilm to prevent leaking during beadbeating. Samples were then placed into Bullet Blender (Next Advance, Inc, Averill Park, NY) and beaten for 30 sec at the speed of 10 followed by transfer to ice to cool for 1 min. This process was repeated for an average of 15 repetitions and samples were checked after 7th, 10th, and 15th repetition to ensure homogeneous lysis. Parafilm was replaced as needed. RNA was then extracted from lysed samples according to the instructions provided with RNeasy Mini Kit (Qiagen). RNA quantity and quality was
assessed with spectrometry (NanoDrop 8000 spectrophotometer; Thermo Scientific, Waltham, MA) RNA quality was assessed based on the reported 260/280 values (2.0 optimal for RNA) and 260/230 values (2.0-2.2 optimal for RNA).
2.6.5 Reverse-transcription
The reverse-transcription reactions were carried out using the High Capacity cDNA Reverse Transcription Kit (Applied Biosystems, Grand Island, NY) according the manufacturers
instructions. Reactions used 75, 120, or 500 ng of isolated RNA depending on the total quantity isolated for each sample. The reaction was carried out in a thermal cycler (Biometra T1,
2.6.6 Real-time PCR
Real-time PCR reactions contained 2 µL of cDNA diluted to 2 ng/µL from the
reverse-transcription reactions, 12.5 µL of SYBR Green PCR Master Mix (Applied Biosystems), 2.0 µL primers at 5 µM (400 µM final concentration), and 8.5 µL H2O in optical 96-well plates
(MicoAmp Opitcal, Applied Biosystems). Samples were run in triplicate. Reactions were
amplified in the 7300 Real-Time PCR System (Applied Biosystems) for 2 min at 50°C, 10 min at 95°C, 40 cycles of 15 sec at 95°C, and then 60 sec at 56°C. Dissociation temperature curves were generated and assessed for each sample to ensure a singular product. Reactions were also run for housekeeping genes cdc-42 and pmp-3.
The Ct values for each gene were averaged by the sets of biological triplicates or duplicates. These averages were converted to the fold-change of amplification compared to the Ct values of each housekeeping gene. Average fold-changes were averaged across experimental triplicates. The final average taken was the average of the fold-change respective to each
housekeeping gene. Statistical analyses were carried out as described in section 2.8.
2.7 DNA Damage Assay
2.7.1 Sample Collection
The same lysate samples used for copy number measurements (see section 2.5) were used for the DNA damage measurements.
2.7.2 Long-amplicon Quantitative PCR and PicoGreen dsDNA Quantification Reactions were carried out largely as described by Santos et al. (2006), with the only
Ipswich, MA) according to the manufacture’s instructions for PCR amplification. The PCR protocol was cycle optimized by running template dilutions at 50%, 25%, and 12.5% to
determine at which cycle the PicoGreen fluorescence readings matched these dilutions for each strain and time point.
2.7.3. Data analysis
Analyses were carried out as described by Santos et al. (2006). DNA lesions are reported as lesion per kilo-base of DNA. These values are scaled to copy number.
2.8 Statistical analysis
3. RESULTS
3.1 Larval Arrest Screening
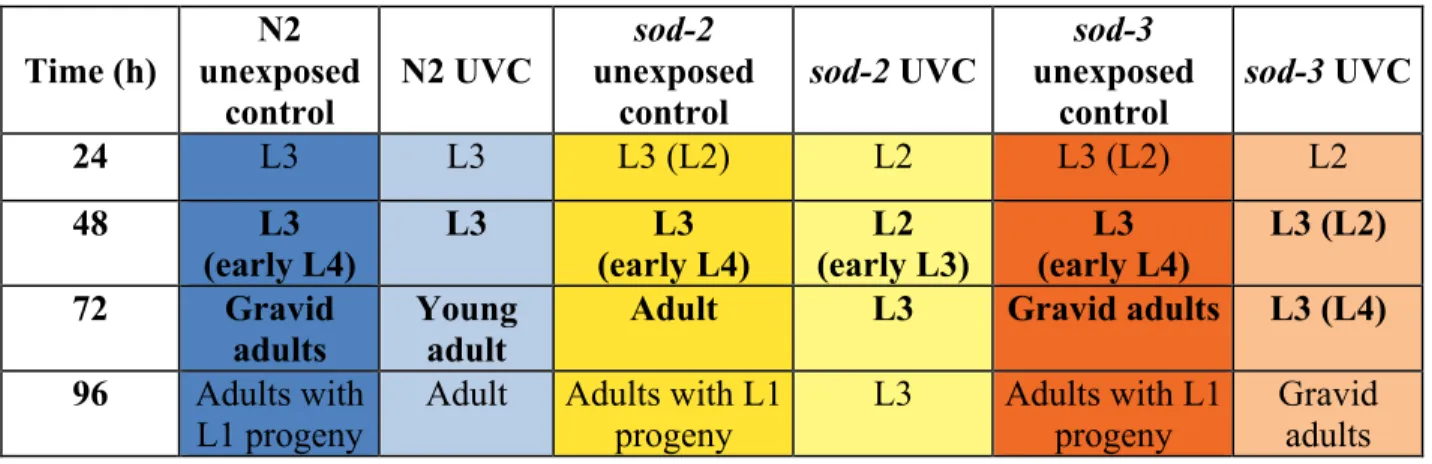
Variation within strain and treatment development was apparent during observations. The most frequently observed development stage is reported and the second most observed stage is listed in parenthesis to provide understanding of the direction of variation (Table 1 and Table 2). Variation in growth was largest in UVC-exposed mutants, with up to ~40% of nematodes differing in either direction from the stage listed first.
Table 1. Average larval development stages for N2, sod-2, and sod-3 (n = 24) at 24, 48, 72,
or 96 h after the last UVC exposure.
Time (h) N2 unexposed control N2 UVC sod-2 unexposed control
sod-2 UVC
sod-3
unexposed control
sod-3 UVC
24 L3 L3 L3 (L2) L2 L3 (L2) L2
48 L3
(early L4)
L3 L3
(early L4) L2 (early L3) L3 (early L4) L3 (L2)
72 Gravid
adults Young adult Adult L3 Gravid adults L3 (L4) 96 Adults with
L1 progeny
Adult Adults with L1 progeny
L3 Adults with L1 progeny
Gravid adults
Table 2. Average larval developmental stages N2, sod-2/3, and sod-1/4/5 (n = 24) at 24, 48,
72, or 96 h after the last UVC exposure
Time (h)
N2 unexposed
control N2 UVC
sod-2/3
unexposed
control sod-2/3 UVC
sod-1/4/5
unexposed control
sod-1/4/5
UVC
24 L3 L3 (L2) L3 L3 (L2) L3 L3 (L2)
48 L4 (young adult) L3 (late L4) L3 (early L4) L3 (L4) L4 (young adult) L3
72 Gravid adults Adult Young adults L3 (L4) Gravid adults Young adults
Wild-type larvae maintained at 20°C and not starved on non-peptone plates would be expected to reach the L4 stage at ~24 h, mature adulthood at ~48 h, and be gravid/lay eggs at ~72 h. In Table 1 and Table 2, the developmental progression of N2 unexposed controls after
starvation shows that overall development progresses more slowly during the first 48 h due to the period of starvation required for the UVC exposure protocol but then progresses naturally
3.2 Growth Assay
The images in Figure 3 show that nematodes are straight after freezing for measurement in the microscopy field.
Figure 3. Examples of the microscopy images as used for growth measurements
Figure 4. Growth of N2 after three consecutive exposures to 7.5 J/m2 UVC (n = 15). *Indicates statistically significant difference between unexposed control and UVC at
α = 0.05.
0 200 400 600 800 1000 1200
24 h 48 h 72 h 96 h
Growth
(
μ
m)
Time post-‐2inal UVC exposure
Unexposed UVC Exposed
*
Figure 5. Growth of sod-2 after 3 exposures to 7.5 J/m2 UVC (n = 15).
*Indicates statistically significant difference between unexposed control and UVC at
α = 0.05.
Figure 6. Growth of sod-3 after 3 exposures to 7.5 J/m2 UVC (n = 15). *Indicates
statistically significant difference between unexposed control and UVC at α = 0.05.
0 200 400 600 800 1000 1200
24 h 48 h 72 h 96 h
Growth
(
μ
m)
Time post-‐2inal UVC exposure
Unexposed UVC Exposed
*
*
*
0 200 400 600 800 1000 1200
24 h 48 h 72 h 96 h
Growth
(
μ
m)
Time post-‐2inal UVC exposure
Unexposed UVC Exposed
Figure 7. Percent unexposed control growth of N2, sod-2, and sod-3 after 3 exposures to 7.5
J/m2 UVC (n = 15).
*Indicates statistically significant difference between unexposed control and UVC
at α = 0.05.
Using the data presented in Figures 4, 5, and 6, three-factor ANOVA test for all three strains showed global ANOVA significance (p < 0.001). Two-factor ANOVA tests for each strain showed significant interactions between exposure and time for all strains. Post-hoc Tukey analysis within each strain a significant effect of UVC on N2 growth at 48 h; sod-2 at 48, 72, and 96 h; sod-3 at 72 and 96 h. Two-factor ANOVA tests using the percent unexposed control data in Figure 7 comparing N2 and sod-2 showed a statistically significant interaction between time and strain (p < 0.001) with a significant difference between N2 and sod-2 percent unexposed control growth at 48, 72, and 96 h (all times p < 0.0001). Two-factor ANOVA tests using the percent
0 20 40 60 80 100 120
24 h 48 h 72 h 96 h
Per
cent Co
ntr
ol G
ro
w
th (%)
Time post-‐2inal UVC exposure
N2 UVC Exposed sod-‐2 UVC
between time and strain (p < 0.001) with a significant difference between N2 and sod-2 percent unexposed control growth at 96 h (p < 0.0001). The data in Figures 4-7 show increased growth inhibition in both sod-2 and sod-3 compared to N2 with greater inhibition in sod-2 than in sod-3.
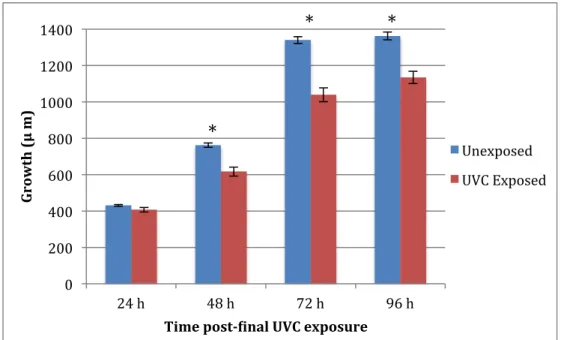
Figure 8. N2 growth after three consecutive exposures to 7.5 J/m2 UVC (n = 20). *Indicates statistically significant difference between unexposed control and UVC at
α = 0.05.
0 200 400 600 800 1000 1200 1400
24 h 48 h 72 h 96 h
Growth
(μ m)
Time post-‐2inal UVC exposure
Unexposed UVC Exposed
*
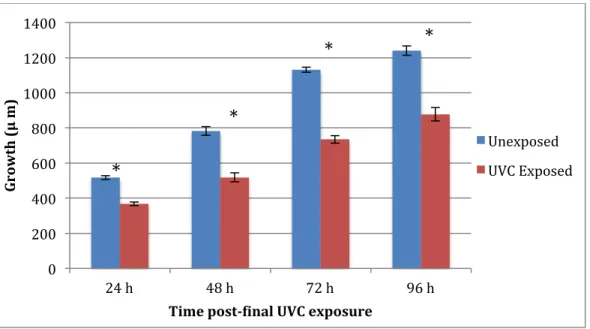
Figure 9. sod-2/3 growth after three consecutive exposures to 7.5 J/m2 UVC (n = 20).
*Indicates statistically significant difference between unexposed control and UVC at
α = 0.05.
Figure 10. sod-1/4/5 growth after 3 exposures to 7.5 J/m2 UVC (n=20).
*Indicates statistically significant difference between unexposed control and UVC at
α = 0.05.
0 200 400 600 800 1000 1200 1400
24 h 48 h 72 h 96 h
Growth
(μ m)
Time post-‐2inal UVC exposure
Unexposed UVC Exposed
*
*
*
*
0 200 400 600 800 1000 1200 1400
24 h 48 h 72 h 96 h
Growth
(μ m)
Time post-‐2inal UVC exposure
Unexposed UVC Exposed
*
Figure 11. Percent unexposed control growth of N2, sod-2/3, and sod-1/4/5 after 3 exposures
to 7.5 J/m2 UVC (n = 20).
*Indicates statistically significant difference between unexposed control and UVC at
α = 0.05.
Using the data presented in Figures 8, 9, and 10, three-factor ANOVA test showed significance (p < 0.001) between N2, sod-2/3, and sod-1/4/5 growth results for an interaction between strain and exposure, strain and time, exposure and time, but not all three factors (p = 0.9209). Three-factor ANOVA for N2 and sod-2/3 showed significant interactions between strain and exposure, exposure and time, and strain and time (all p < 0.001), but this could not be further investigated due to lack of global ANOVA significance (p = 0.9479). Two-factor
ANOVA tests for each strain showed significant interactions between exposure and time for all strains. In post-hoc Tukey analysis within each strain, N2 nematodes showed UVC irradiation has a significant effect on growth at 48, 72, and 96 h; sod-2/3 at all time points; sod-1/4/5 at 48, 72, and 96 h.
0 20 40 60 80 100 120
24 h 48 h 72 h 96 h
Per
cent Co
ntr
ol G
ro
w
th (%)
Time post-‐2inal UVC exposure
N2 UVC Exposed sod-‐2/3 UVC Exposed sod-‐1/4/5 UVC Exposed
*
*
*
*
*
*
*
Two-factor ANOVA tests using the percent unexposed control data presented in Figure 11 comparing N2 and sod-2/3 showed statistically significant effects of time and strain, but not a significant interaction between strain and time (p = 0.1681). Two-factor ANOVA tests using the percent unexposed control data comparing N2 and sod-1/4/5 also did not show a significant interaction between strain and time (p = 0.0868).
3.3 Mitochondrial and Nuclear Genome Copy Number
Figure 12. Mitochondrial copy number for N2, sod-2/3, and sod-1/4/5 (n = 9 for 24 and 48
h; n = 6 for 72 h).
*Indicates statistically significant difference between unexposed control and UVC at
α = 0.05.
Two-factor ANOVA tests for each strain showed significant interactions between exposure and time for all strains. Post-hoc Tukey analysis on each strain showed a significant effect of UVC on N2 at 72 h (p < 0.001), sod-2/3 at 48 and 72 h (p = 0.0025 and p ≤ 0.001, respectively), but not for sod-1/4/5 at an identifiable time point (p = 0.0831 for interaction between exposure and time).
The significant effect of UVC on N2 and sod-1/4/5 copy number is lost when 72 h is not considered.
Figure 13. Nuclear copy number for N2, sod-2/3, and sod-1/4/5 (n = 9 for 24 and 48 hours;
n = 6 for 72 hours).
*Indicates statistically significant difference between unexposed control and UVC at
α = 0.05.
ANOVA tests for each strain showed significant interactions between exposure and time for all strains. Post-hoc Tukey analysis on each strain showed a significant effect of UVC on N2 at 72 h (p ≤ 0.0003), sod-2/3 at 72 h (p ≤ 0.001), and sod-1/4/5 at 72 h (p <0.001). The significant effect of UVC on N2 and sod-1/4/5 copy number is lost when 72 h is not considered.
Figure 14. Mitochondrial-to-nuclear copy number ratio for N2, sod-2/3, and sod-1/4/5 (n =
9 for 24 and 48 h; n = 6 for 72 h).
*Indicates statistically significant difference between unexposed control and UVC at
α = 0.05.
For the mitochondrial-to-nuclear copy number ratio presented in Figure 14, three-factor ANOVA test for all three strains showed significant interactions between strain and
time/exposure and time/strain and exposure (although borderline at = 0.0489), but not global significance (p = 0.1017). Two-factor ANOVA tests for each strain showed significant
Post-hoc Tukey analysis on each strain showed a significant effect of UVC on sod-2/3 at 48 h (p = 0.0005), but not sod-1/4/5 at any time points.
3.4 Heat Shock Protein Gene Expression
3.4.1 hsp-6 Gene Expression
Figure 15. Gene expression for mitochondrial hsp-6.
*Indicates statistically significant difference between unexposed control and UVC at
α = 0.05.
3.4.2 hsp-60a Gene Expression
Figure 16. Gene expression for mitochondrial hsp-60a.
*Indicates statistically significant difference between unexposed control and UVC at
α = 0.05.
3.4.3 hsp-60b Gene Expression
Figure 17. Gene expression of mitochondrial hsp-60b.
*Indicates statistically significant difference between unexposed control and UVC at
α = 0.05.
3.4.4 hsp-4 Gene Expression
Figure 18. Gene expression of endoplasmic reticulum hsp-4.
For the data presented in Figure 18, three-factor ANOVA test for all strains did not indicate global ANOVA significance. Two-factor ANOVA tests for each strain did show significant interactions between exposure and time for any strain. Only sod-1/4/5 showed
3.4.5 hsp-16.2 Gene Expression
Figure 19. Gene expression of cytosolic hsp-16.2.
3.4.6 hsp-16.41 Gene Expression
Figure 20. Gene expression of cytosolic hsp-16.41.
3.5 DNA Damage
During cycle optimization of samples for long amplicon quantitative PCR, fractional
amplification reactions did not fluoresce with PicoGreen in acceptable fractional values. Optimal cycle numbers were concluded as 27 cycles for 24 and 26 cycles for 48 h based on acceptable values for 100% template QPCR amplification. QPCR reactions were not performed with UVC-exposed samples.
Table 3. Mitochondrial Long Amplicon Fractional Amplification PicoGreen Fluorescence.
Values are shown for two biological replicates of unexposed controls. Standard errors of averaged technical replicates were large, highlighting high variability between fluorescent readings. Data is not shown for nuclear damage cycle optimization; results similarly variable .
Strain, Hours post-final
UVC exposure
50% template amplification
25% template amplification
12.5% template amplification
N2, 24 h 0.2797, 0.3363 0.1558, 0.1493 0.0916, 0.1210
sod-2/3, 24 h 0.3494, 0.3042 0.2104, 0.1976 0.1382, 0.1138
sod-1/4/5, 24 h 0.2640, 0.2844 0.1618, 0.1652 0.1044, 0.1005
N2, 48 h 0.3355, 0.1249 0.1258, 0.0824 0.0851, 0.0521
sod-2/3, 48 h 0.5545, 0.6998 0.3113, 0.3046 0.2097, 0.1301
4. DISCUSSION
4.1. Larval Arrest Screening
The longer arrest for sod-2 larvae compared to sod-3 larvae is likely explained by the difference in expression levels for the two genes, with sod-2 encoding the major MnSOD protein (at ~90% of total MnSOD) and sod-3 encoding the minor MnSOD protein (25). The sod-3 mutants are expected to be less sensitive to mitochondrial ROS than sod-2 because sod-3 is the minor MnSOD (25). It has also been reported that deletion of one MnSOD gene does not cause a significant increase in the level of expression of the other MnSOD gene, suggesting that more significant arrest in sod-2 compared to sod-3 is not confounded by a compensatory upregulation of the other MnSOD (26). As stated, this observed developmental arrest was considered
preliminary evidence of ETC dysfunction since OXPHOS is necessary for the transition from L3 to L4 (7), and these results prompted the further study of mitochondrial ROS from persistent mtDNA as a mechanism contributing to ETC dysfunction.
The stage-scoring results presented in Table 2 show that the sod-2/3 mutants are temporarily arrested in the L3 stage compared to unexposed control and wild-type exposed groups. However, they were not more delayed in development compared to sod-2 and sod-3 mutants as hypothesized and were actually less delayed compared to sod-2. This could be explained by reported increases in the gene expression of other antioxidant and detoxification genes in sod-2/3 mutants including five different glutathione-S-transferase genes that detoxify xenobiotics and cyp-13 that regulates DNA degradation and cell death (26). The sod-1/4/5 UVC-exposed nematodes showed a slight delay in development during the first 48 to 72 h compared to sod-1/4/5 unexposed controls with a slight arrest at the L3 stage. However, the observable delay
comparison to N2 nematodes exposed to UVC, but were significantly less delayed compared to the sod-2/3 nematodes exposed to UVC. These results match the hypothesis that sod-2/3 would be more arrested than N2, but sod-1/4/5 would not, and suggest that there may not be an increase in ETC dysfunction or other activated developmental delay mechanisms resulting from
decreased defenses to cytosolic ROS after exposure to UVC.
The inconsistency between the N2 unexposed control and UVC-exposed developmental stage scoring results reported in Table 1 and Table 2 (with N2 UVC-exposed nematodes
progressing more quickly; Table 2) is likely explained by normal variation in nematode
development and matches the variation between the reported growths of each group. Increasing the sample size could reduce this variation between the sets of experiments.
4.2 Growth
Growth measurement results showed growth inhibition due to UVC exposure in all strains, matching previously reported data in N2 (7). The growth sod-2 and sod-3 mutants was inhibited and statistically different from same-strain unexposed controls and from N2 when the data was analyzed as percent growth of unexposed control. The increased sensitivity of sod-2 mutants to UVC exposure compared to sod-3 is again seen with sod-2 growth being significantly different from wild-type as percent growth of unexposed control at 48, 72, and 96 h compared to only at 96 h in sod-3.
The sod-2/3 growth measurements showed that growth was inhibited after UVC exposure, but differences from N2 at specific time points could not be investigated due to the lack of a significant interaction between strain and time when compared in a two-factor ANOVA analysis as explained in section 3.5. The lower percent-unexposed control growth for sod-2 compared to sod-2/3 matches the longer developmental delay in development observed in the sod-2 samples compared to sod-2/3. The significant difference between sod-2 or sod-3 and N2
but not between sod-2/3 and N2 may be due to the variation between the two sets of N2 data from the separate experiment sets. The similar results for N2 and sod-1/4/5 growth match the similarity observed in the development assay in Table 2, suggesting that the UVC exposure is not inducing changes to the extracellular and cytosolic ROS levels that cause growth inhibition different from wild-type growth comparisons.
A relationship between growth and development is understood, as C. elegans increase in size dramatically between larval and adult stages. Comparisons between the results and
conclusions of the development and growth analyses match in significance with respect to UVC effects and mutant to wild-type comparisons.
4.3 Mitochondrial and Nuclear Genome Copy Number
Leung et al. (2013) reported a significant effect of UVC exposure on mtDNA copy number in glp-1 mutant nematodes that lack a functioning germ-line when cultured at 25°C (7). In this
project, all strains tested were expected to show a decrease in mitochondrial copy number as the glp-1 results suggested (7); 2/3 copy number was expected to be lower than N2 and
sod-1/4/5. The results support only the latter hypothesis of decreased mitochondrial copy number,
degradation as a result of increased mitochondrial superoxide levels (assumed from decrease in MnSOD defenses), but not from increased cytosolic superoxide anion levels. If Leung et al. (2013) had not reported a decrease in mtDNA copy number, we could have hypothesized that mtDNA copy number increases due to UVC exposure as a compensatory reaction (7).
UVC exposure was expected to statistically decreased N2 and sod-1/4/5 mitochondrial copy number, but this was only the case at 72 h. At 72 h, unexposed control nematodes had reached reproductive maturity while UVC-exposed nematodes generally did not show gravidity or lay eggs. Although measuring rate of reproduction was not an aim of this project, observations were made about the rates of egg-laying rates between N2, sod-2/3, and sod-1/4/5. Compared to N2, sod-2/3 were observed to, on average, lay fewer eggs on average than N2 (and also on average 4-8 h later) while sod-1/4/5 were observed to lay the same number of eggs if not more. While this reproductive data is only based on visual observations and not quantitative
measurements, similar outcomes have been reported (24). Unexposed control group copy
number measurements were confounded by amplification of the genomes in eggs, and there is an effect-measure modification of genome copy number at 72 h between unexposed control and UVC-exposed of the same strain. The lack of significance at earlier time points suggests that UVC exposure is not changing mitochondrial copy number and/or is not resulting in increased cytosolic ROS that alters mtDNA copy number. The difference in effect of UVC exposure in N2 and sod-1/4/5 compared to glp-1 also suggests that a functioning germ-line may help sustain or recover mtDNA copy number after mtDNA damage even before reproduction starts at 72 h.
decreased defenses to superoxide in neither mitochondrial nor the cytosol have no additional effect on nDNA copy number, and is consistent with results reported previously (7).
When represented as mitochondrial-to-nuclear genome copy number ratio, the data is normalized for differences in cell size and cell number and therefore, the data is controlling for the genomes in eggs. As copy number ratios, only the sod-2/3 at 48 h data was statistically affected by UVC exposure. This result suggests that antioxidant defenses to mitochondrial superoxide are necessary to maintain mtDNA copy number and likely suggest that mitochondrial superoxide is increased as a result of UVC exposure. One possible mechanism contributing to this change in sod-2/3 mtDNA copy number could be oxidation of pol γ, the mitochondrial DNA polymerase. This is supported by a study in which human fibroblasts resulted in decreased mitochondrial copy number due to oxidation of pol γ from exposure to H2O2 (27). There may also be altered or insufficient cellular signaling regarding mitochondrial genome replication and pol γ activity, such as is the case with mitochondrial transcription factor A that signals for pol γ upregulation under oxidative stress conditions in human fibroblasts (28, 29). However, the signaling mechanisms of pol γ conditions of oxidative stress in C. elegans are not as well understood (7).
4.4 Heat Shock Protein Gene Expression
4.4.1 Mitochondrial hsp gene expression (hsp-6, hsp-60a, hsp-60b)
I hypothesized that the persistent mtDNA damage resulting from UVC exposure would result in an upregulation of hsp genes encoding mitochondrial hsp. It was predicted that the mtDNA damage could induce a mitochondrial unfolded protein response UPRmt if [1]damaged DNA did not allow for proper protein translation and folding (22), [2] if increased ROS from ETC
dysfunction oxidized proteins (19, 30) causing them to unfold/improperly fold, or [3] imbalance in the stoichiometric balance between nuclear-encoded and mitochondria-encoded genes of the ETC left proteins lingering in the mitochondrial matrix (16). The sod-2/3 mutant was expected to have increased upregulation from that of wild-type due to the decreased defenses to the oxidative damaging ability superoxide anions in the mitochondria.
The first proposed mechanism by which UVC irradiation could induce a UPRmt response (damaged DNA does not allow for proper protein translation and folding), can be further
can be activated by “a stoichiometric imbalance between nDNA- and mtDNA-encoded oxidative phosphorylation proteins,” although the evidence for a specific pathway linking the two events was not reported (16). One possible explanation for this mechanism not related to ROS
production could be that the imbalance results in abandoned nuclear-encoded or mitochondrial encoded proteins in the mitochondrial matrix. Signaling events between the mitochondria and nuclear transcription factors such mammalian nuclear respiratory factor-1 that regulate transcription of nuclear-encoded mitochondria proteins (through mitochondrial transcription factor A) could also be a factor, but this signaling has not been identified in C. elegans (7).
The lack of a significant difference between unexposed control and UVC-exposed nematodes (except at 72 h for N2 and sod-1/4/5) did not provide evidence of ETC dysfunction characterized by the proposed possible mechanisms of UPRmt activation. The upregulation at 72 h for N2 and sod-1/4/5 cannot be explained. It is possible that the UVC-exposed nematodes are experiencing the beginning of increased mitochondrial activity compared to unexposed controls at 72 h that results in an increased initial mitochondrial stress response because they are just moving forward from the L4 stage. The UPRmt is reported to be most active during the L4 stage when the rate of mitochondrial genome replication is highest during development (33). Prior to the L3 to L4 transition, transcription of ETC proteins is reduced (6). Once this ETC translation increases at the L4 stage at 72 h, mtDNA damage due to UVC irradiation could result in UPRmt activation by one of three events specified earlier in this section. Surprisingly, there was no statistically significant effect of UVC irradiation on mitochondrial hsp gene expressions in sod-2/3. As stated earlier, sod-2/3 mutants exhibit upregulation of other antioxidant and
reduction in mitochondrial copy number or larval development delay seen in UVC-exposed sod-2/3 could result a lower baseline of mitochondrial activity and, therefore, ETC dysfunction
would have a lesser impact on the UPRmt threshold (33).
Induction of the UPRmt and hsp transcription are part of a series of cell signaling events that occur after a threshold of unfolded or lingering proteins is sensed in the matrix. This multi-step signaling pathway is not fully understood and may provide further understanding on induction of the UPRmt (33).
4.4.2 Endoplasmic reticulum and cytosolic hsp gene expression
I hypothesized that no strains would show upregulation of the endoplasmic reticulum (ER)-localized hsp-4 as part of the endoplasmic reticulum unfolded protein response (UPRER). The UPRER is thought to be primarily induced when the ER attempts to fold mutated proteins that are encoded for by the nuclear genome and the unfolded or improperly folded proteins accumulate in the ER lumen (34). Mutated proteins are the result of DNA mutations that alter the sequence of amino acids of proteins encoded for by a mutated nDNA template. The nDNA damage resulting from UVC exposure or from increased cytosolic ROS is not expected to mutate nDNA to a degree where nDNA mutations would result in mutated proteins; the nDNA photodimers
resulting from UVC and/or possible oxidative nDNA from increased cytosolic ROS are expected to be repaired by robust nDNA repair machinery. The results support this hypothesis, with sod-1/4/5 as the only strain showing a statistically significant effect of UVC as seen in Figure 16. It is
UVC exposure rather than ETC dysfunction (ETC produced superoxide cannot cross the mitochondrial membrane), any upregulation would be expected to decrease over time as the damage is repaired and proteins are turned-over.
I hypothesized that all strains would show upregulation of the cytosolic 16.2 and hsp-16.41 after UVC exposure due to the ability of UVC irradiation to increase ROS levels (35). The sod-1/4/5 mutant was expected to be the most sensitive to cytosolic ROS. The results did not
show statistically significant effect of UVC exposure on any strain. However, the results showed tremendous variation between experiment replicates and high standard errors when the real-time PCR hsp gene values were normalized to the house keeping genes. The cytosolic hsp is a
4.5 DNA Damage
I hypothesized that the variable and low amplification of the fractional template amounts used during cycle optimization is due to a loss of DNA template integrity from improper storage conditions of the lysates. However, that hypothesis does not explain why 100% template amplification reactions sometimes reached expected fluorescent PicoGreen values somewhat. The low amplification of 12.5% template amplification reactions may also be a result of noise of the assay obscuring measurements of already low template levels (although above the limit of detection).
While incomplete at this time, the DNA damage assay remains an important experiment in this study of ROS resulting from ETC dysfunction and UVC exposure. Oxidative damage to DNA could include oxidative damage to bases and sugar phosphates in addition to single or double-strand breaks (36, 37). In nDNA, nucleotide excision repair and base excision repair are expected to repair this damage, while only base excision repair can repair this damage in mtDNA. It is expected that the great majority of this oxidative damage would be repaired by base excision repair (36, 37). The long amplicon QPCR protocol for this assay has been reported to detect oxidative DNA damage in mitochondria (36, 38).
A previous study has shown that nuclear DNA damage is repaired in N2 nematodes by 48 h post-final UVC exposure using the same UVC exposure protocol described here, while
mtDNA damage persists (1). This assay could provide evidence for the hypotheses that
increased oxidative nDNA damage because it can be repaired more robustly than in mtDNA in addition to receiving protection from nucleoside histone protein packaging (36).
4.6 Future Directions
These results presented here have provided evidence to pursue many future experiments to build upon and expand the questions of how mitochondrial function or dysfunction results from
persistent mtDNA damage and how increased ROS results from mtDNA damage and contributes to ETC dysfunction. Experiments to successfully complete the DNA damage assay and an additional growth assay replicate are currently being pursued.
Additionally, function of the electron transport chain could be assessed through
measuring ATP levels and oxygen consumption. The results of these assays could be compared to previous data from experiments measured throughout life of N2 and glp mutant strains to further understand the effects of SOD deficiency (7). A luciferase assay kit can measure ATP levels in which ATP is quantified as a measure of the light emitted when luciferin reacts with oxygen in lysed nematode samples with luciferase (39). Oxygen consumption can be measured using a Seashorse Bioscience Extracellular Flux Analyzer (Seahorse Bioscience) or other methods (30).
This could be performed by mRNA extraction and cDNA quantification with real-time PCR as reported in this project.
Additionally, as mentioned previously, oxidation of polymerase γ could result from increased ROS from ETC dysfunction or UVC exposure. This oxidation could inhibit polymerase γ activity, leading to decrease mtDNA genome copy number. Report of
quantification oxidation of polymerase γ has been found in treatment of human fibroblasts with H2O2, but not in C. elegans (27). This procedure could likely be adapted for C. elegans.
5. CONCLUSION
Collectively, the results of this project have shown that UVC exposure to nematodes created mitochondrial-specific effects, strengthening evidence of altered ETC function. While the use of the MnSOD mutants does not provide causation that these results are due to increased ROS production by the ETC, they do provide evidence to further test this hypothesis in future experiments. The results from the non-mitochondrial mutant analyses suggest that UVC
irradiation can be used for the selective study of mitochondrial DNA damage/dysfunction in C. elegans. However, investigation of effects of UVC exposure other than the mtDNA studied
should continue.
The pursuit to understand the mechanisms connecting persistent mtDNA damage and ETC function or dysfunction should be expanded as this topic is relevant to cancer, aging,
diabetes, and hundreds of mitochondrial diseases. While some mitochondrial diseases result from mtDNA mutants of unknown origin or membrane depolarization, others are due to unexplained mitochondrial dysfunction. As we expand our knowledge of environmental toxicants and environmental exposures, we must specifically expand our knowledge about mitochondrial function and dysfunction. This will be necessary to identify mitochondrial toxicants and
REFERENCES
1. Bess, A. S., Crocker, T. L., Ryde, I. T., & Meyer, J. N. (2012). Mitochondrial
dynamics and autophagy aid in removal of persistent mitochondrial DNA damage in Caenorhabditis elegans. Nucleic acids research, 40(16), 7916-7931.
2. The North American Mitochondrial Disease Consortium. (n.d.). Overview of mitochondrial diseases. Retrieved from
http://rarediseasesnetwork.epi.usf.edu/namdc/learnmore/index.htm
3. Meyer, J. N., Leung, M. C., Rooney, J. P., Sendoel, A., Hengartner, M. O., Kisby, G.
E., & Bess, A. S. (2013). Mitochondria as a target of environmental
toxicants. toxicological sciences, 134(1), 1-17.
4. Li, N., Sioutas, C., Cho, A., Schmitz, D., Misra, C., Sempf, J., ... & Nel, A. (2003). Ultrafine particulate pollutants induce oxidative stress and mitochondrial damage.
Environmental health perspectives, 111(4), 455.
5. Meyer, J. N. (2010). QPCR: a tool for analysis of mitochondrial and nuclear DNA damage in ecotoxicology. Ecotoxicology, 19(4), 804-811.
6. Bess, A. S., Ryde, I. T., Hinton, D. E., & Meyer, J. N. (2013). UVC Induced Mitochondrial Degradation via Autophagy Correlates with mtDNA Damage Removal in Primary Human Fibroblasts. Journal of biochemical and molecular toxicology, 27(1), 28-41.
7. Leung, M. C., Rooney, J. P., Ryde, I. T., Bernal, A. J., Bess, A. S., Crocker, T. L., ... & Meyer, J. N. (2013). Effects of early life exposure to ultraviolet C radiation on
mitochondrial DNA content, transcription, ATP production, and oxygen consumption in developing Caenorhabditis elegans. BMC Pharmacology and Toxicology, 14(1), 9.
8. Hillier, L. W., Coulson, A., Murray, J. I., Bao, Z., Sulston, J. E., & Waterston, R. H.
(2005). Genomics in C. elegans: so many genes, such a little worm. Genome
research, 15(12), 1651-1660.
9. Okimoto, R., Macfarlane, J. L., Clary, D. O., & Wolstenholme, D. R. (1992). The
mitochondrial genomes of two nematodes, Caenorhabditis elegans and Ascaris
suum. Genetics, 130(3), 471-498.
10. Murgatroyd, C., & Spengler, D. (2010). Histone tales: echoes from the past, prospects
for the future. Genome biology, 11(2), 105.
11. Thannickal, V. J., & Fanburg, B. L. (2000). Reactive oxygen species in cell
signaling. American Journal of Physiology-Lung Cellular and Molecular
12. Di Giulio, Richard T., and Joel N. Meyer. "Reactive oxygen species and oxidative stress." The toxicology of fishes (2008): 273-324.
13. Liu, Y., Fiskum, G., & Schubert, D. (2002). Generation of reactive oxygen species by
the mitochondrial electron transport chain. Journal of neurochemistry, 80(5), 780-
787.
14. Lewis, W., Copeland, W. C., & Day, B. J. (2001). Mitochondrial DNA Depletion, Oxidative Stress, and Mutation: Mechanisms 0f Dysfunction from Nucleoside Reverse Transcriptase Inhibitors. Laboratory investigation, 81(6), 777.
15. Lee, H. C., & Wei, Y. H. (2005). Mitochondrial biogenesis and mitochondrial DNA maintenance of mammalian cells under oxidative stress. The international journal of biochemistry & cell biology, 37(4), 822-834.
16. Houtkooper, R. H., Mouchiroud, L., Ryu, D., Moullan, N., Katsyuba, E., Knott, G., ... & Auwerx, J. (2013). Mitonuclear protein imbalance as a conserved longevity mechanism. Nature, 497(7450), 451-457.
17. Miwa, S., & Brand, M. D. (2003). Mitochondrial matrix reactive oxygen species
production is very sensitive to mild uncoupling. Biochemical Society
Transactions, 31(6), 1300-1301.
18. Leung, M. C., Williams, P. L., Benedetto, A., Au, C., Helmcke, K. J., Aschner, M., &
Meyer, J. N. (2008). Caenorhabditis elegans: an emerging model in biomedical
and environmental toxicology. Toxicological Sciences, 106(1), 5-28.
19. Yang, W., & Hekimi, S. (2010). A mitochondrial superoxide signal triggers increased
longevity in Caenorhabditis elegans. PLoS biology, 8(12), e1000556.
20. Lee, S. J., Hwang, A. B., & Kenyon, C. (2010). Inhibition of Respiration Extends
C. elegans Life Span via Reactive Oxygen Species that Increase HIF-1
Activity. Current Biology, 20(23), 2131-2136.
21. Zhang, X., Rosenstein, B. S., Wang, Y., Lebwohl, M., & Wei, H. (1997). Identification of possible reactive oxygen species involved in ultraviolet
radiation-induced oxidative DNA damage. Free Radical Biology and Medicine,
23(7), 980-985.
22. Haynes, C. M., & Ron, D. (2010). The mitochondrial UPR–protecting organelle protein homeostasis. Journal of cell science, 123(22), 3849-3855.
23.Bratic, I., Hench, J., Henriksson, J., Antebi, A., Bürglin, T. R., & Trifunovic, A.
(2009). Mitochondrial DNA level, but not active replicase, is essential for
24.Doonan, R., McElwee, J. J., Matthijssens, F., Walker, G. A., Houthoofd, K., Back, P., ... & Gems, D. (2008). Against the oxidative damage theory of aging: superoxide dismutases protect against oxidative stress but have little or no effect on life span in Caenorhabditis elegans. Genes & development, 22(23), 3236-3241.
25.Gems, D., & Doonan, R. (2009). Antioxidant defense and aging in C. elegans. Cell Cycle, 8(11), 1681-1687.
26. Back, P., Matthijssens, F., Vlaeminck, C., Braeckman, B. P., & Vanfleteren, J. R. (2010). Effects of sod gene overexpression and deletion mutation on the expression profiles of reporter genes of major detoxification pathways in Caenorhabditis elegans. Experimental gerontology, 45(7), 603-610.
27. Graziewicz, M. A., Day, B. J., & Copeland, W. C. (2002). The mitochondrial DNA polymerase as a target of oxidative damage. Nucleic acids research, 30(13), 2817- 2824.
28. Lee, H. C., & Wei, Y. H. (2005). Mitochondrial biogenesis and mitochondrial DNA maintenance of mammalian cells under oxidative stress. The international journal of biochemistry & cell biology, 37(4), 822-834.
29. Virbasius, J. V., & Scarpulla, R. C. (1994). Activation of the human mitochondrial transcription factor A gene by nuclear respiratory factors: a potential regulatory link between nuclear and mitochondrial gene expression in organelle biogenesis.
Proceedings of the National Academy of Sciences, 91(4), 1309-1313.
30. Van Raamsdonk, J. M., & Hekimi, S. (2009). Deletion of the mitochondrial
superoxide dismutase sod-2 extends lifespan in Caenorhabditis elegans. PLoS
genetics, 5(2), e1000361.
31. Yoneda, T., Benedetti, C., Urano, F., Clark, S. G., Harding, H. P., & Ron, D. (2004). Compartment-specific perturbation of protein handling activates genes encoding mitochondrial chaperones. Journal of cell science, 117(18), 4055-4066.
32. Durieux, J., Wolff, S., & Dillin, A. (2011). The cell-non-autonomous nature of electron transport chain-mediated longevity. Cell, 144(1), 79-91.
33. Haynes, C. M., Yang, Y., Blais, S. P., Neubert, T. A., & Ron, D. (2010). The Matrix Peptide Exporter HAF-1 Signals a Mitochondrial UPR by Activating the
34. Shen, X., Ellis, R. E., Lee, K., Liu, C. Y., Yang, K., Solomon, A., ... & Kaufman, R. J. (2001). Complementary Signaling Pathways Regulate the Unfolded Protein
Response and Are Required for C. elegans Development. Cell, 107(7),
893-903.
35. Zhang, X., Rosenstein, B. S., Wang, Y., Lebwohl, M., & Wei, H. (1997).
Identification of possible reactive oxygen species involved in ultraviolet
radiation-induced oxidative DNA damage. Free Radical Biology and
Medicine, 23 (7), 980-985.
36. Yakes, F. M., & Van Houten, B. (1997). Mitochondrial DNA damage is more
extensive and persists longer than nuclear DNA damage in human cells following oxidative stress. Proceedings of the National Academy of Sciences, 94(2), 514- 519.
37. Cooke, M. S., Evans, M. D., Dizdaroglu, M., & Lunec, J. (2003). Oxidative DNA damage: mechanisms, mutation, and disease. The FASEB Journal, 17(10), 1195- 1214.
38. Santos, J. H., Meyer, J. N., Mandavilli, B. S., & Van Houten, B. (2006). Quantitative PCR-based measurement of nuclear and mitochondrial DNA damage and repair in mammalian cells. In DNA Repair Protocols (pp. 183-199). Humana Press.
39. Braeckman, B. P., Houthoofd, K., De Vreese, A., & Vanfleteren, J. R. (2002).
Assaying metabolic activity in ageing Caenorhabditis