-1-
Introduction
The tumor suppressor p53 plays a significant role in a variety of cellular functions including DNA
repair, cell cycle modulation, and programmed cell death, also called apoptosis.
1Mutations or
functional inactivation of p53 is a hallmark in many cancer types, such as breast and colorectal cancer,
affecting greater than 22 million people.
1Approximately half of these patients display mutant p53 that
has lost its tumor suppressor function, while the other half exhibit decreased p53 levels due to
overexpression of the E3 ubiquitin ligases murine double minute 2 (MDM2) and MDMX. MDM2
decreases p53 levels by acting as a transcriptional inhibitor and as an E3 ligase facilitating degradation
of p53 via the proteasome.
1In fact, there is overwhelming molecular and genetic evidence that the
major role of MDM2, and its related complexes, is the targeting of p53 for proteasomal degradation.
4Conversely, overexpression of p53 has been linked to the up-regulation of genes involved in cellular
growth and apoptosis. Due to this, p53 has become an attractive therapeutic target by being the most
frequently mutated gene in human cancer that not only plays a vital role in cellular function, but also
has been proven to rescue apoptotic pathways in cancer cells.
56In eukaryotic cells, the pathway for protein degradation via ubiquitination is commonly referred to as
the ubiquitin proteasome system (UPS).
7Ubiquitination requires an increasingly complex enzymatic
cascade involving E1
ubiquitin activating
enzymes, E2 ubiquitin
conjugating enzymes, and
E3 ubiquitin ligases (Figure
1). First, free ubiquitin
becomes conjugated to an
E1 enzyme via a
high-energy thioester bond
(Figure 1B). Next, the
ubiquitin is transferred from
E1 to the active site on an
E2 ubiquitin conjugating
enzyme, forming an E2~Ub
complex (Figure 1C).
Finally, an E3 ubiquitin
ligase facilitates the transfer
of ubiquitin from E2 to a
lysine residue on the target
protein (labeled substrate,
Figure 1D). The E3 ligase
recognizes and
ubiquitinates the protein
through the recognition of a
short amino acid sequence
termed a degradation
sequence, or degron.
8Finally, multiple ubiquitins
-2-
are sequentially added to the protein to form a polyubiquitin chain (a process termed
polyubiquitination), effectively targeting the protein for degradation by the 26S proteasome complex
(Figure 1G).
The development of therapeutic methods relating the numerous
biomolecular interactions of p53 in oncogenic signaling
pathways has been steadily progressing in recent years. For
instance, efforts to restore the deregulated p53 pathway, such as
small-molecule inhibitors of the p53-MDM2 interaction, p53
chaperone drugs, p53 gene therapy, and MDM2 inhibitors, are
currently in clinical trials.
6Although a myriad of therapeutic
opportunities to restore p53 function have been attempted, the
most common approach has been to inhibit the function of
proteins that reduce p53 amount and activity in cells. A majority
of efforts and clinical trials are focused around small drugs that
block the protein-protein interaction between p53 and HDM2,
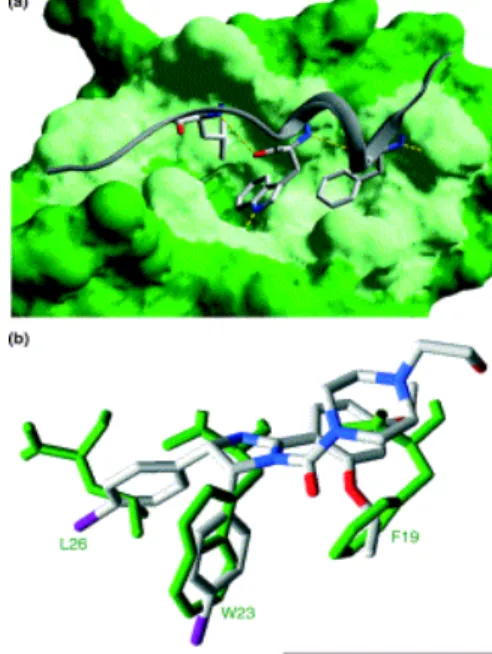
the human protein analog of MDM2. Drug discovery research
has found peptides with higher affinities for the MDM2/HDM2
binding domain than p53, reinforcing the notion that the binding
pocket of MDM2 can be inhibited effectively, as exemplified in
Figure 2. The vast library of MDM2 inhibitors includes nutlin,
benzodiazepinedione, chromenotriazolopyrimidine, terphenyls,
chalcones, MI-219, RG7112, and many others that exhibit good
pharmokinetic and pharmacodynamics properties.
6Additionally,
a class of novel compounds termed stapled peptides has been
developed to inhibit the p53-MDM2 interaction with more
comprehensive and potent effects. The stapled peptide
sMTide-02 was proven to display greater specificity and potency in its
biological mechanism of MDM2 inhibition than previously
identified inhibitors like nutlin and SAH-8.
9Molecules such as
these stapled peptides are still under biochemical investigation in
the hopes of reaching clinical trials and becoming powerful
therapeutic tools. In addition to expanding the p53 related
therapeutics library, research has progressed toward therapeutic
characterization and evaluation, demonstrating that p53-targeted
therapeutics must be sensitively controlled in order to achieve
maximum tumor cell eliminations without bringing about toxicity to normal proliferating tissues. For
instance, using murine models, researchers have indicated that therapies restoring wild-type p53
function can lead to apoptosis in normal, healthy tissues. Accordingly, one must control the intensity
and duration of p53 response via precise activation or rescue p53 function.
6This expanding library of MDM2 inhibitors, combined with ongoing efforts to further explore the
inhibitory mechanism of the MDM2-p53 binding interaction demonstrates how the ubiquitin-mediated
degradation of p53 via MDM2 activity has become the focal point of p53 related cancer drug
discovery. The establishment of this biomolecular target niche, combined with the potential issues and
restraints regarding therapeutic mechanism sensitivity, highlights the dire need for precise analytical
-3-
tools to evaluate the p53-MDM2 interaction in the UPS.
10In order to address this need, this project
aims to develop a new biomolecular probe able to measure MDM2 activity. Specifically, the biosensor
will be based on a degradation sequence of p53, allowing for recognition and binding by the E3 ligase
MDM2.
Previous work in our lab has focused on the identification and characterization of novel recognition
substrates based on naturally occurring degrons from various proteins involved in the UPS related to
oncogenic signaling pathways. These degron-based substrates incorporated naturally occurring degrons
to facilitate E3 ligase recognition, binding, and ubiquitination. The degron-based substrates
consist of
four essential components: the degron for E3 ligase recognition and binding, an ubiquitination site
lysine, a linking region to prevent steric hindrance issues, and a fluorescent tag for visualization
(Figure 3).
2The fluorescent tag, normally 5,6 carboxyfluorescein, allows for visualization of the
reporter through either gel electrophoresis, HPLC, or capillary electrophoresis. This previous study
resulted in the optimization of a previously described synthetic degron, termed Bonger
2, to identify the
minimal amino acid sequence still capable of ubiquitination. We found that a four amino acid
sequence (RRRG) could be efficiently ubiquitionated, which exhibits the potential to be incorporated
into a novel proteasome reporter. This work was recently published in PLOS ONE
2, but was not
included in this document due to size considerations.
Additionally, as part of this study, we developed
a degron-based substrate based on amino acids 92 to 112 from p53, as a reporter for evaluating MDM2
activity. This specific sequence was demonstrated be necesarry for MDM2 mediated degradation.
2Our previous work demonstrated that the p53 degron-based substrate exhibited a high degree of
ubiquitination as well as rapid reaction kinetics in comparison to other degron-based substrates, which
has prompted further exploration of this region of p53
for use in an E3 ligase MDM2 reporter.
2A successful reporter for MDM2 activity needs to be
easily synthesizable and resistant to intracellular
peptidases, enzymes that hydrolyze the peptide bonds
of small proteins, which requires that the
degron-based substrate consists of a minimal sequence of
amino acids capable of binding to the target protein.
This is important because the substrate needs to
incorporate a peptidase-resistant sequence, termed a
protectide, to prevent rapid degradation by
intracellular peptidases. Previous work in the Waters
lab has identified several protectides and utilized them to stabilize peptide-based kinase reporters.
11To
address these goals, we aim to identify the minimal functional degron sequence based on the
previously tested p53 degron-based substrate by utilizing a shotgun synthesis approach to create a
library of substrates of varying lengths, which will be tested for MDM2-mediated ubiquitination. The
shotgun method involves synthesizing smaller, overlapping sequences of the known p53 degron and
testing them with an
in vitro
ubiquitination assay using multiple analytical techniques. Novel
information about the minimal functional degron and its subsequent ubiquitination by MDM2 in an
in
vitro
assay will provide the basis for the design of a novel MDM2 reporter.
-4-
Materials and Methods
Substrate synthesis and purification
.
Substrates were synthesized as previously described.
2Briefly, peptides were synthesized by solid
phase peptide synthesis (SPPS) on a Creosalus Thuramed Tetras Automated Peptide Synthesizer using
150 mg of CLEAR-amide resin. Amino acids were activated with HBTU (4 eq), HOBT (4eq), and
DIPEA (5eq) in DMF and NMP. Deprotection of the peptide N-terminus was conducted in 2% DBU
and 2% piperidine in DMF for 2 x 15 min each. Amino acid coupling steps were performed twice for
30 min or 1 hr for natural amino acids and once for 4 hr in the case of Fmoc-Lys(ivDde)-OH.
Acetylation of peptide N-termini was accomplished with 5% acetic anhydride and 6% 2,6-lutidine in
DMF for 40 minutes. The Fmoc-Lys(ivDde)-OH side chain was deprotected with 3% anhydrous
hydrazine in DMF for 3 cycles of 5 min each. Removal of the protecting group was confirmed by a
Kaiser test. Conjugation of the fluorescent tag was performed with either 5,6-carboxy-fluorescein
(4eq) or 6-carboxy-fluorescein (4eq) combined with PyBOP (4eq), HOBT (4 eq), and DIPEA (4eq) in
DMF reacting in a dark environment overnight.
2The peptide was cleaved from the resin using a
mixture of TFA, TIPS and H2O in a 95:2.5:2.5 ratio, reacting for a minimum of 3 hr. After the TFA
was evaporated, the product was precipitated with cold ether, extracted into water, and lyophilized.
Primary purification of peptides was performed via Reverse Phase HPLC using a C-18
semi-preparative column in a Waters 2998 HPLC with photo iodide ray detector running absorbance
detection at 214 nm and 490 nm. Gradients were run from polar, hydrophilic Solvent A (95% water,
5% acetonitrile 0.1 % TFA) to non-polar/hydrophilic solvent B (95% acetonitrile 5% water 0.1%TFA).
The lyophilized peptide was reconstituted in 10-15 mL of Solvent A and filtered using a Millex 0.22
µL syringe driven filter. A trace was run using a 60 minute gradient of 0-100% B with a 200 µL
sample injection. Traces were analyzed in collaboration with Adam Melvin to identify which peaks to
collect. Peaks present in both 214 and 490 nm that were substantially greater than background noise,
indicating the presence of fluorescein in combination with a peptide backbone were determined to be
of importance and thus collected. The peptide was then purified via the above method using 1.0 mL
injections and collecting the significant peaks. Eluent fractions containing substrate from primary
purification were rotovapped using a Buechi Rotovapor R-200, lyophilized, reconstituted in solvent A,
and subjected to secondary purification via reverse phase HPLC on the Waters 2998 HPLC. For
secondary purification, a trace was run using a 100 minute gradient of 0-100% B with a 200 µL sample
injection, and then analyzed according to peak presence at 214 nm and 490 nm. Subsequent injections
were increased to 1 mL and the remaining peptide was purified collecting only the top 50% of desired
peaks to ensure purity. Eluent fractions containing the desired substrate were rotovapped and
-5-
Ubiquitin pull down assay
Peptide ubiquitination was evaluated using HeLa S100 cytosolic lysate-based ubiquitination assays
combined with an antibody pull down specific for ubiquitin as previously described
2. The assay was
carried out at 37°C for 2 hrs at a total reaction volume of 100 µL. The assay consisted of buffer (10mM
Tris-HCl Ph7.6 and 5mM MgCl2), 2mM DTT, 20 µg/mL ubiquitin aldehyde (Boston BioChem), 400
µg/mL methylated ubiquitin (MeUb) (Enzo Life Sciences), 1X ATP-ERS (Boston BioChem), 100 µM
proteasome inhibitor MG-132 (EMD Chemicals), 2mg/mL HeLa S100 cytosolic lysates as the source
of E1, E2, and E3 enzymes, 4.2 µg of peptide substrate, and the inhibitors Complete ULTRA and
PhosSTOP (Roche). After incubation, samples were incubated with Control-Agarose beads
(LifeSensores), diluted in TBS-T buffer (20mM Tris-HCl pH 8.0, 150mM NaCl, and 0.1% Tween-20),
for 60 min on a tube rotator at 4°C. Samples were then centrifuged to pellet the Control beads at 1800g
for 5 min. The supernatant was transferred to a new tube to which a solution of Agarose-TUBES1
(LifeSensor), diluted in TBS-T buffer, was added and then incubated overnight on a tube rotator at
4°C. The purpose of these beads was to bind ubiquitin and anything conjugated to ubiquitin following
a standard pull down or immunoprecipitation assay. Ubiquitin-bound beads were washed 5X with
TBS-T buffer and samples were cleaved from the bead with 50 µL 2X tricine sample buffer, heated for
5 min at >90°C, and isolated by centrifugation at 13000g for 5 min. Subsequently, samples were
analyzed by gel electrophoresis (SDS-PAGE) using precast Bio-RAD Mini-PROTEAN
®16.5%
Tris-Tricine Gels. A fluorescent protein ladder (Benchmark, Life Technologies) was used as a means of
comparing the molecular weight of samples run in the gel to predetermined values. Gels were run in
1X Tris-Tricine Running Buffer (at 120V for ~ 90 minutes) and imaged at the Lineberger Cancer
Center using a GE Typhoon Imager. Scans were run with a photo multiplier tube (PMT) of 600 V and
at 800 V using the Green 526 SP filter set and a pixel size of 100 microns was used.
In vitro ubiquitination assay
.
Peptide ubiquitination was further evaluated using an
in vitro
ubiquitination assay. The reaction
consisted of 10 mM Tris-HCl (pH 7.6), 2 mM MgCl2, 2 mM DTT, 300 µM ubiquitin, 1X ATP-ERS
(Boston Biochem), 1 µM Ube1 (E1, Boston Biochem), 10 µM UbcH5b (E2, Boston Biochem), 1 µM
HDM2 (E3, Boston Biochem), and varying concentrations of peptide substrate (1 µM, 5 µM, 10 µM,
20 µM, and 30 µM) in a total reaction volume of 20 µL at 30 °C for 2 hrs. The reaction was halted by
the addition of 40 µL Tricine Sample Buffer (BioRad), and samples were loaded onto SDS PAGE gels,
electrophoresed and visualized as previously described using a GE Typhoon Imager.
2Analysis of peptide ubiquitination by analytical HPLC
-6-
of each component present in the sample by a calculated comparison of the peak area of the sample to
the 10 µM FAM standard.
W
1/2AVG=
W
1/2A+
W
1/2B2
=
(0.134
+
0.131)
2
=
0.133
(Eq. 1)
R=0.589Δtr W1/2AVG
=0.589(9.60−8.74)
0.133 =3.81
(Eq. 2)
N
=
5.55
t
R2
w
1/22=
5.55(8.74
2)
(0.134)
2=
23611
(Eq. 3)
H
=
L
N
=
250
nm
23611
=
0.11
nm
(Eq. 4)
Analytical parameters included resolution
(R), number of theoretical plates (N), and
plate height (H) and were calculated as
follows. Using the average width, W1/2
AVG, of two peaks of interest at half height(Eq. 1), values for resolution, , were
determined by multiplying the difference
in resolution of the two peaks,
Δ
tR, by a
constant and dividing by W1/2 AVG (Eq. 2).
The number of theoretical plates was
determined by taking the square of the
retention of one peak tR and multiplying
by a constant and dividing by its width at
half height, W1/2 (Eq. 3). Finally,
theoretical plate height was calculated by
dividing the column length, L, by the
number of theoretical plates (Eq. 4).
Results
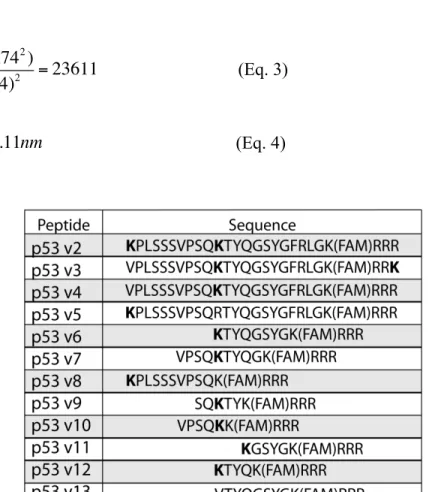
Iterations of the p53 degron-based substrate are differentially ubiquitinated
All peptide substrates synthesized and tested in this study (Table 1) are based on the p53 degron
identified by Gu and colleagues found to be necessary for MDM2 mediated degradation.
12We
previously developed a substrate based on this degron and found that it exhibited pronounced
ubiquitination kinetics.
2Further, we found that it could be multi-monoubiquitinated when multiple
lysine residues were incorporated into the N- and C-termini (e.g., p53 v2 and v3, Table 1).
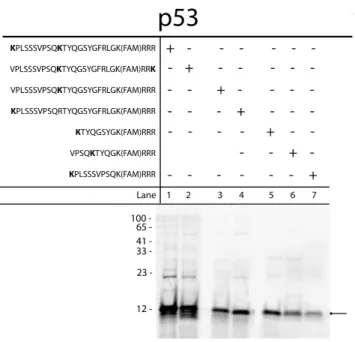
8-7-
ubiquitination refers to the conjugation of one
ubiquitin molecule to one lysine residue on the
substrate while multi-monoubiquitination refers to
the conjugation of one ubiquitin molecule to
multiple lysine residues within the substrate. Full
length substrates (p53v2-v5, Table1) all exhibited
varying degrees of mono-ubiquitination (Figure 5,
lanes 1-5), and those with multiple free lysine
residues exhibited multi-monoubiquitination
(Figure 5, lanes 1-2). Due to the
multi-monoubiquitination of the full length substrate
with multiple ubiquitination site lysines, shortened
overlapping fragments based on the degron
sequence were designed with a single
ubiquitination site lysine to assess if they could be
mono-ubiquitinated using a pull down assay
incorporating HeLa cytosolic lysates. Three
substrates (p53 v6-v8, Table 1) were designed for
this study to isolate the minimal portable degron,
the smallest functional region of the degradation
sequence to be used for reporter targeting.
Substrate p53 v6 was comprised of the amino
acids immediately following the internal lysine
residue and exhibited the strongest degree of
ubiquitination of the shortened sequences (Figure 5, lane 5). Other abridged substrates, p53 v7 and v8,
were also ubiquitinated to a lesser extent (Figure 5, lane 6-7). Due to the differential ubiquitination of
these primary fragments in the ubiquitination pull down assays, it was decided to break these
sequences into further fragments to continue the characterization of the minimal functional degron.
It was decided to move away from the previously discussed pull down assay towards an
in vitro
ubiquitination assay designed to incorporate only the E1, E2, and E3 enzymes to minimize off target
effects from the array of proteins and enzymes found in cellular lysates. Instead of using HeLa S100
cytosolic lysates as a source enzymes, this new design incorporated purchased E1, E2, and E3 enzymes
as the functional reaction components, eliminating the possibility of substrate degradation by
intracellular proteases. By using purchased enzymes instead of cytosolic lysates, we were able to
ensure that the only E3 ligase present in our assay was HDM2, providing specificity for the interaction
of p53 and HDM2, which is of prime interest for our reporter. The entire library of substrates was
subjected to this assay and exhibited varying degrees of ubiquitination (Figure 6). By comparing
relative band intensities (Figure 6), it was concluded that p53v6 and p53v11 exhibited the highest
degrees of ubiquitination. Although SDS-PAGE analysis of the assay samples demonstrated
reproducible results, proving the successful ubiquitination of library substrates, the established
analytical limitations of this method prevented it gauging substrate ubiquitination at the desired level
of precision.
-8-
Characterization of HPLC separation conditions to quantify p53-based substrate ubiquitination
Based on the results
obtained from the
SDS-PAGE analysis of the
library of degron-based
substrates (Figure 6), it
was decided to utilize a
more precise analytical
tool to provide more
quantifiable data on the
degree of peptide ubiquitination. We decided to employ reverse phase analytical HPLC because it is a
well-established, reliable analytical technique that also offers a high degree of precision measurement
and the ability to quantitatively compare the degree of substrate ubiquitination. To effectively utilize
HPLC as an analytical metric, we had to first identify the separation conditions for unmodified (or
parent) peptide from ubiquitinated peptide for an octadecyl carbon chain (C18)-bonded silica analytical
column. Separation conditions were determined using ubiquitination assay samples from the p53 v11
peptide, a potent substrate based on our previous results. Based on previously established results from
studies using HPLC to separate peptides and proteins,
13we employed a gradient of 99.9% water,
0.1%TFA to 99.9% ACN, 0.1%TFA over a 15 minute time course using fluorescence detection to
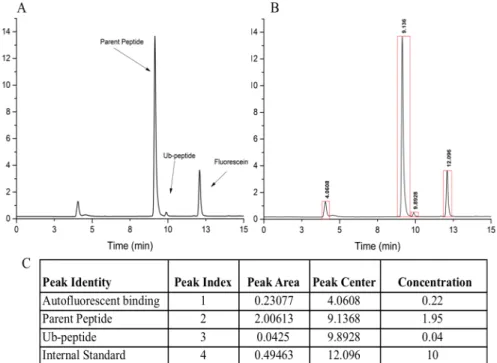
distinguish vital components of the assay sample. Parent peptide and ubiquitinated peptide
(Ub~peptide) both contain a fluorescein tag, therefore fluorescence detection serves as the most
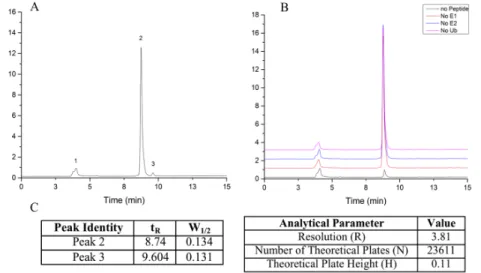
effective method of identifying peaks of interest. Three peaks were present on chromatographic traces
of assay sample corresponding to parent peptide (Figure 7A, 2), Ub~peptide (Figure 7A, 3), and an
unidentified non-reactive species (Figure 7A, 1). Multiple control experiments were performed (Figure
7B) removing E1 enzyme, E2
enzyme, ubiquitin, or parent
peptide, in order to identify the
peaks corresponding to parent
peptide and ubiquitinated peptide.
We determined that peak 1, with a
retention time of ~4 minutes, was
due to auto-fluorescence of a
non-reactive assay component which
did not affect the migration and
analysis of the ubiquitinated
product. Peak 2, with a retention
time of ~9 minutes, was identified
as the parent peptide, while the
smaller peak three, with a
retention of ~10 minutes was
determined to be ubiquitinated
substrate. While we are confidant
of this identification, further
analysis using mass spectrometry
of peak eluent is planned to
completely characterize the
Figure 7. Experimental characterization of HPLC separation conditions. A) A sample HPLC trace of p53 v11 parent (1) and ubiquitinated (2) peptide were identified by the numbered peaks B) Control experiments, comprised of assay conditions lacking peptide (black), ubiquitin (purple), E1 (red), and E2 (blue) respectively, that verify the identity of characterized peaks C) Retention times and half widths of peaks relevant to the calculation of separation parameters, as well as calculated values that characterize the quality of separation.
-9-
identity of each peak. However the results are pending due to backlog at the UNC Proteomics Facility.
After successful characterization of peak identities in each assay sample, it was decided to incorporate
an internal standard of 10 µM fluorescein. Comparison of assay sample traces spiked with internal
standard to traces of pure fluorescein identified and confirmed that our chosen internal standard peak
migrated with a retention time of ~12 minutes (Figure 8 A). We selected fluorescein as an internal
standard because it has a different retention time than any peaks of interest from our assay sample, and
it is important to correlate peak area to product concentration. The resolution between two adjacent
peaks, indicative of the ability of HPLC conditions to separate a mixture, was calculated to be 3.81
(Eq. 2). Additionally, a theoretical plate number of the separation was found to be 23,611 (Eq. 3) with
a theoretical plate height of 0.11 nm (Eq. 4). These parameters are evidence of the quality and
efficiency of the experimentally derived separation conditions. The successful discovery of analytical
HPLC separation conditions allowed us to move forward with the project and more quantitatively
screen the p53 substrate library for degree of ubiquitination.
Quantification of p53-based substrate ubiquitination using HPLC
With functional and effective separation conditions for the analysis of the
in vitro
ubiquitination assay
samples, we set out to characterize substrate ubiquitination using analytical HPLC. To properly
characterize peptide ubiquitination we selected to calculate Michaelis-Menten kinetics by evaluating
ubiquitin conjugation of the
p53 based substrates of varying
concentrations. When
chromatography is performed
with an internal standard of
known concentration, peak
areas can be used to calculate
the concentration of each
species of interest. Through
integrating the desired signal
peak, shown by the boundary
bars in Figure 8B, one can
obtain the selected peak’s area.
Subsequently, the peak area of
the known internal standard
can be used to calculate a
relative concentration for the
peak of interest. Preliminary
data extrapolated from HPLC
analysis of substrates p53 v6
and p53 v7 subjected to
in vitro
assay conditions are listed in
Table 2. Data was obtained by
quantifying peak area relative
to known internal standard in
order to determine the concentration of parent peptide and ubiquitinated peptide. In getting numerical
values for the concentration of ubiquitinated peptide and parent peptide, we will be able to more
accurately see the degree of ubiquitination of various substrate library members. Additionally, this will
-10-
allow for the precise characterization of reporter
ubiquitination due to varying the initial concentration
of parent peptide. Data representative of the
concentrations of parent peptide and Ub~peptide will
subsequently allow us to calculate the
Michaelis-Menten constants, Km and kcat, to precisely evaluate
substrate performance. Preliminary experiments using
p53 v6 and p53 v7 demonstrate that the concentration
of Ub~peptide appears to increase in direct
correlation to the initial concentration of parent
peptide (Table 2). Unfortunately, it appears that the
concentrations of parent peptide vary to some degree
and do not correspond to the amount of parent peptide
substrate originally used in the assay (Table 2). We
are currently investigating this phenomenon to
explore this inconsistency and determine the cause
and its analytical implications. Nevertheless, the
preliminary data obtain here provides the basis for a
successful analysis of substrate ubiquitination to
identify the minimal peptide sequence capable of
MDM2-mediated ubiquitination. Continued
collection and analysis of peptide ubiquitination is
currently underway to analyze the entire p53 substrate
library.
Discussion
In this project we attempted to identify and characterize the minimal amino acid sequence based on the
naturally occurring degron found to be necessary for MDM2-mediated ubiquitination of p53. Based on
the previous success of work with a p53 degron-based substrate, we employed a shotgun sequencing
approach to synthesize a library of substrates of varying lengths and ubiquitination site lysine locations
to find an ideal, yet minimized, recognition sequence for MDM2. Substrates were subjected to a HeLa
S100 cytosolic lysate-based pull down assay and an enzyme only
in vitro
ubiquitination conditions,
both analyzed by SDS-PAGE, to evaluate peptide ubiquitination. Subsequent analysis of the
in vitro
ubiquitination assay was performed by analytical HPLC to perform a more precise quantification about
the degree of peptide ubiquitination. Initial examination of the p53 peptide-based substrates via the
pull down assay showed successful mono-ubiquitination and multi-monoubiquitination of full length
substrate sequences (Figure 5), validating the functionality of the p53 degron sequence proposed by Gu
et al
12for use in a degron-based substrate to assess MDM2 activity. Next, the p53-based sequence,
relatively large to be successfully utilized as a peptide-based reporter, was further broken down to
identify if smaller iterations could retain the same degron potential. Evaluation of smaller fragments
(p53 v6-8) by the ubiquitin pull down assay showed that these substrates exhibited varying degrees of
ubiquitination (Figure 5), proving their functionality for use as a smaller functional degron. Substrate
p53 v6, which was shown to be more strongly ubiquitinated than the other two fragments, was
hypothesized to contain the smallest functional degron. With this successful minimization of the p53
degron, efforts were made to further minimize this sequence to isolate the smallest portable degron.
Table 2. Preliminary data from HPLC analysis of in vitro ubiquitination assay samples. Concentrations of parent peptide and ubiquitinated peptide product in samples of substrates subjected to in vitro assay conditions. Values were determined by peak area comparison to known internal standard. Concentrations of parent peptide not subjected to assay conditions are also included. Preliminary analysis explored the substrates p53v6 and p53v7 and their degree of ubiquitination.
Assay Initial Concentration (µM) Parent Peak Concentration (µM) Ub-Peptide Peak Concentration (µM)
Parent 10 µM 1.3 N/A
1 µM 0.43 0.0045
5 µM 0.94 0.02
10 µM 1.95 0.041
20 µM 3.55 0.063
p53v6 30 µM 5.89 0.088
Parent 10 µM 1.17 N/A
1 µM 0.47 0.0021
5 µM 0.99 0.02
10 µM 1.55 0.031
20 µM 2.9 0.05
30 µM 4.66 0.062
Parent 10 µM 1.54 N/A
1 µM 0.44 0.006
p53v7 5 µM 0.82 0.011
10 µM 1.89 0.015
20 µM 3.21 0.039