JOHN COLLINS
Evaluation of an Optical Remote Sensing Device for Laboratory Validation of Optical
Remote Sensing/Computed Tomography TheoryUnder the direction of Lori A. Todd, Ph.D.
ABSTRACT
Optical remote sensing/computed tomography technology has been demonstrated
in theoretical studies to be a feasible methodology for measuring gases and vapors in
workplace air. This non-invasive, near real-time sampling system scans a room and
reconstructs concentration maps with good spatial and temporal resolution. This
system would require an optical remote sensor capable of providing accurate
measurements over the beam pathlength.This research evaluated the accuracy of a commercially-available, optical
remote sensing (ORS) device to determine its feasibility for use in the laboratory
validation of optical remote sensing/computed tomography theory. Experiments were
performed using direct-reading validation methods to assess accuracy in both uniform
and non-uniform gas concentrations of SF5 using both a single and a reflected beam.
The effect of pathlength on accuracy was determined, and the effect of inputting
incorrect values of pathlength and detector signal levels into the control system was
also determined. The efficiency of the mirrors used to reflect the beam was also
determined.
ACKNOWLEDGMENT
I dedicate this thesis to my wife, Maria, my parents, and my grandmother, Ruth Collins. They must know that without their presence, love and encouragement, this
accomplishment would be meaningless.
I wish to thank all my friends who have helped me in so many ways: Kwanseog Ahn, Renee Anthony, Maryanne Boundy, Mike Flynn, Taehyung Kim, David Leith, Marc Plinke, Gurumurthy Ramachandran, Pete Raynor, and Volker
Schurman, et al.
I also want to thank my advisor. Dr. Lori Todd for her help and guidance
PAGE
LIST OF TABLES... viii
LIST OF FIGURES...ix
LIST OF ABBREVIATIONS...xii
LIST OF SYMBOLS...xiii
CHAPTER L INTRODUCTION... 1
Traditional Methods of Workplace Exposure Assessment... 1
Deficiencies of Traditional Assessment Methods... 2
An Alternative to Conventional Assessment Methods...3
Optical Remote Sensing and Computed Tomography...4
Statement of Problem... 4
IL BACKGROUND...7
Methods of Detection in Optical Remote Sensing... 7
Types/Applications of Optical Remote Sensors... 9
Long-Path Differential Absorption Laser... 10
Differential Absorption Light Detection and Ranging... 10
Differential Optical Absorption Spectrometers... 11
Gas Cell Correlation Spectrometers... 12
Other Spectrometers... 12
Fourier Transform Infrared Spectrometers... 13
History of ORS Calibration Methods... 14
m. EXPERIMENTAL... 17
TABLE OF CONTENTS (Cont'd)
CHAPTER PAGE
III. Experimental (Cont'd)
Selection of ORS Device... 18
Theory of Operation... 18
Optical Alignment of the INFRASAFE...20
Usable Range of the INFRASAFE...22
Modifications to INFRASAFE Required for Indoor Use...23
Validation of the ORS Device... 25
Calibration... 25
Calibration of the INFRASAFE... 25
Validation Instruments... 26
Calibration of the Validation Instruments...28
Calibration Cell... 28
Mirror Stand for the Reflected Beam Experiments... 30
Overview of Experiments... 31
Experimental Design... 32
Gas Administration... 37
Equipment Configuration... 37
Sample Collection... 38
Experimental Procedure... 38
Single and Reflected-Beam Experiments Using a Homogeneous Environment... 38
Single and Reflected-Beam Experiments Using a Heterogeneous Environment...41
Experiments to Determine the Effect of Pathlength...44
Experiments Using Incorrect Input Pathlength Values...44
TABLE OF CONTENTS (Cont'd)
CHAPTER PAGE III. EXPERIMENTAL (Cont'd)
Experiment to Determine Mirror Reflectivity... 45
IV. RESULTS...47
Calculation of Actual Path-Averaged Concentrations... 47
Analysis of Calibration Data...48
Experiments Conducted in the Single-Beam Configuration... 49
Experiments Conducted in the Reflected-Beam Configuration... 50
Experiments to Determine the Effect of Pathlength... 50
Experiments Using Incorrect Pathlength Values... 51
Experiments Using Incorrect Baseline Signal Levels... 51
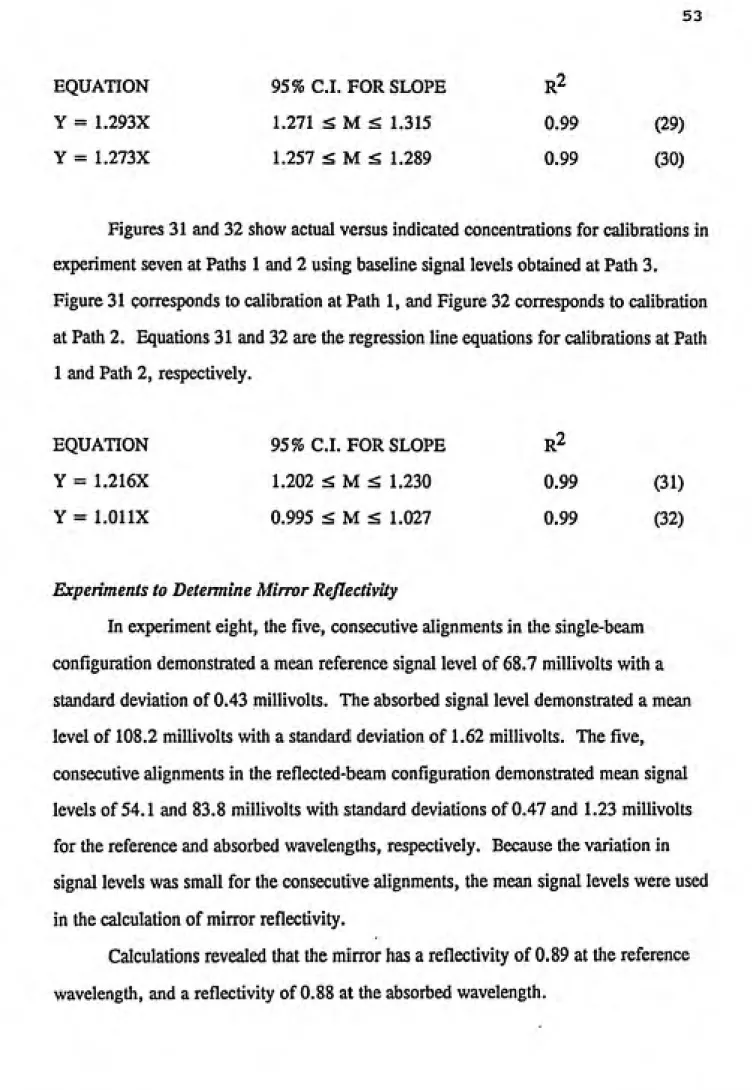
Experiments to Determine Mirror Reflectivity... 53
V. DISCUSSION... 78
Creation of Homogeneous Test Environments... 78
Accuracy of the INFRASAFE in the Single-Beam Configuration...78
Accuracy of the INFRASAFE in the Reflected-Beam Configuration...79
Accuracy with Single Beam versus Accuracy with Reflected Beam... 79
Effect of Pathlength... 80
Use of Mathematical Correction for Incorrect Pathlength Values... 80
Use of Incorrect Baseline Signal Levels... 80
Experiments to Determine Mirror Reflectivity... 83
Deviation From Linearity... 84
A Different Statistical Treatment of Calibration Data... 84
VL CONCLUSIONS... 85
VIL RECOMMENDATIONS FOR FUTURE WORK... 87
TABLE OF CONTENTS (Cont'd)
CHAPTER PAGE
VII. RECOMMENDATIONS FOR FUTURE WORK (Cont'd)
Temperature/Humidity Effect Experiments...88
Design, Construction, and Evaluation of a Scanning Device... 88
Standard Method for Routine Calibration of the INFRASAFE...88
Modifications to INFRASAFE Software... 89
Ultimate Use of FTIR System...89
Construction of an Exposure Chamber... 89
Construction of Additional Mirror Stands... 89
REFERENCES ... 91
APPENDIX A ECD DEVICE USER'S GUIDE...97
APPENDIX B VALIDATION INSTRUMENT CALIBRATION CURVES... 104
APPENDIX C INFRASAFE ALIGNMENT PROCEDURE... 123
TABLE PAGE
Table 1: Calculated values of standard deviation (S.D.) and coefficient of
variation (C.V.) for path samples collected in experiment one...56
Table 2: Calculated values of standard deviation (S.D.) and coefficient of
LIST OF FIGURES Figure 1: Figure2: Figure3: Figure4: Figure5: Figure 6: Figure7: Figure8: Figure9: Figure 10 Figure 11 Figure 12 Figure 13 Figure 14: Figure 15: Figure 16: Figure 17:
Network of Intersecting Beams...5
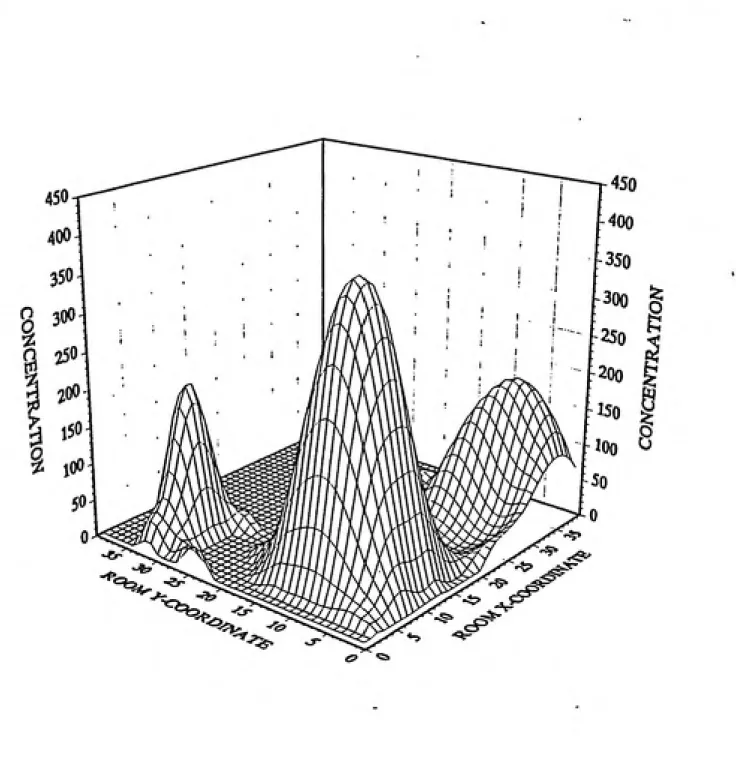
Map of Workplace Gas Concentrations...6
Schematic of Transmitter...19
Schematic of Receiver...21
Actual versus Indicated Concentrations prior to modification of INFRASAFE... 24
Schematic of ECD Device...27
Three Position Scan in a Square Chamber... 35
Single-Beam Configuration... 39
Reflected-Beam Configuration...40
Illustration of calibration cell injection procedure...,...43
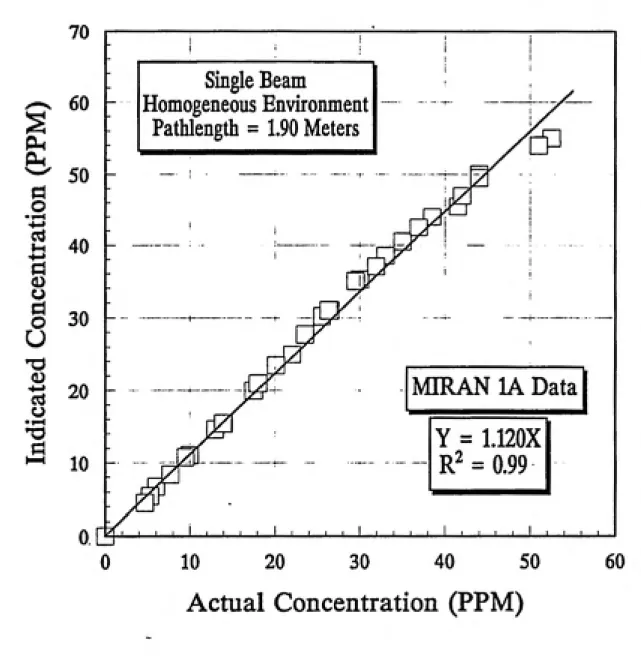
Actual versus Indicated Concentrations from calibrations using a single beam in a homogeneous test environment (MIRAN)...54
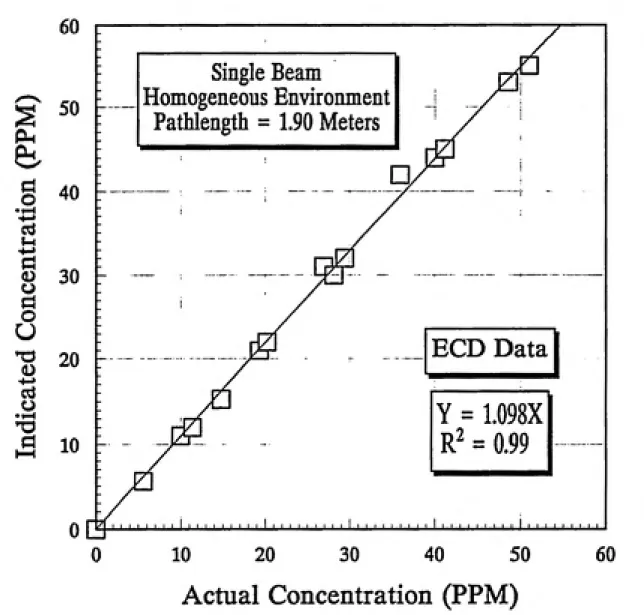
Actual versus Indicated Concentrations from calibrations using a single beam in a homogeneous test environment (ECD Device)...55
Actual versus Indicated Concentrations from calibrations using a single beam in a heterogeneous test environment (ECD Device) ...57
Actual versus Indicated Concentrations from calibrations using a reflected beam in a homogeneous test environment (ECD Device) ...58
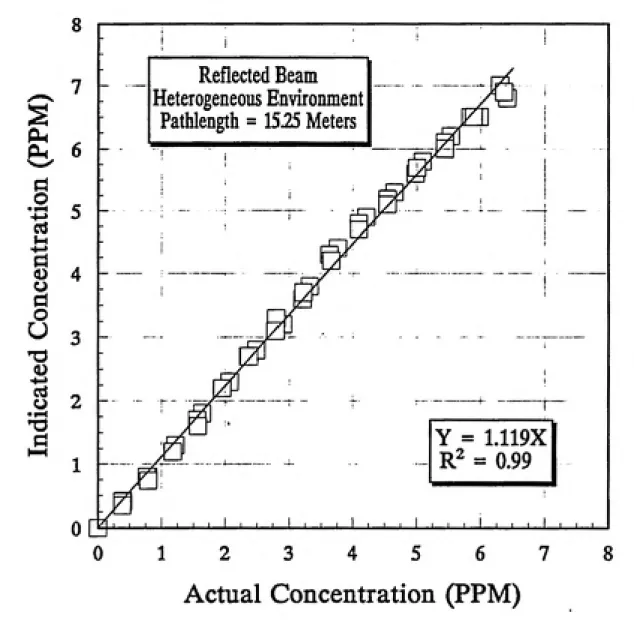
Actual versus Indicated Concentrations from calibrations using a reflected beam in a heterogeneous test environment (ECD Device) ...60
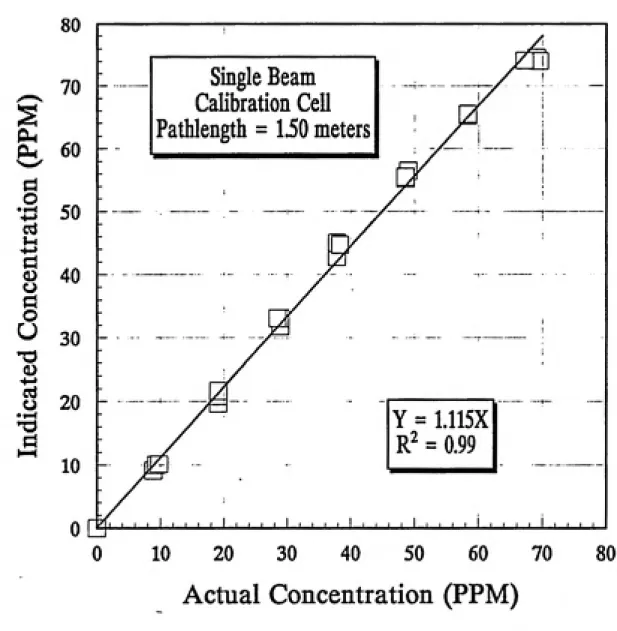
Actual versus Indicated Concentrations from calibrations evalu¬ ating the effect of pathlength at a pathlength of 1.50 meters (ECD Device) ...61
Figure 18: Actual versus Indicated Concentrations from calibrations evalu¬ ating the effect of pathlength at a pathlength of 4.50 meters
(BCD Device) ... 63
Figure 19: Actual versus Indicated Concentrations from calibrations evalu¬ ating the effect of pathlength at a pathlength of 6.00 meters
(BCD Device) ...64
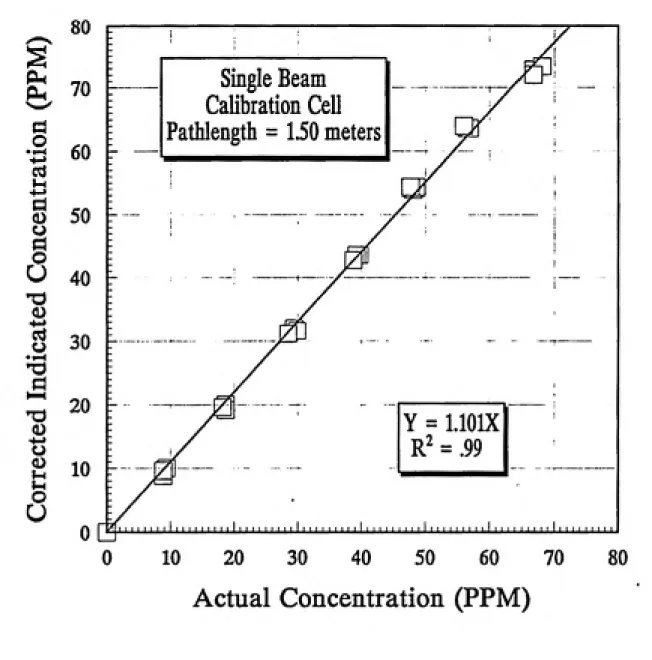
Figure 20: Actual versus Corrected Indicated Concentrations from cali¬
brations using incorrect pathlength value of 6.00 meters at
a pathlength of 1.50 meters (BCD Device) ...65 Figure 21: Actual versus Corrected Indicated Concentrations from cali¬
brations using incorrect pathlength value of 6.00 meters at
a pathlength of 3.00 meters (BCD Device) ...66
Figure 22: Actual versus Corrected Indicated Concentrations from cali¬
brations using incorrect pathlength value of 6.00 meters at
a pathlength of 4.50 meters (BCD Device)...67 Figure 23: Actual versus Indicated Concentrations from calibrations
using pathlength value of 6.00 meters at a pathlength of
6.00 meters (BCD Device)...68
Figure 24: Actual versus Indicated Concentrations from calibrations at
Path 1 using actual baseline signal levels (BCD Device) ...69 Figure 25: Actual versus Indicated Concentrations from calibrations at
Path 2 using actual baseline signal levels (BCD Device)... 70 Figure 26: Actual versus Indicated Concentrations from calibrations at
Path 3 using actual baseline signal levels (BCD Device) ...71
Figure 27: Actual versus Indicated Concentrations from calibrations
at Path 2 using baseline signal levels of Path 1 (BCD Device) ...72
Figure 28: Actual versus Indicated Concentrations from calibrations
at Path 3 using baseline signal levels of Path 1 (BCD Device) ...73 Figure 29: Actual versus Indicated Concentrations from calibrations
at Path 1 using baseline signal levels of Path 2 (BCD Device) ...74 Figure 30: Actual versus Indicated Concentrations from calibrations
at Path 3 using baseline signal levels of Path 2 (BCD Device) ...75 Figure 31: Actual versus Indicated Concentrations from calibrations
LIST OF FIGURES (Cont'd)
Figure 32: Actual versus Indicated Concentrations from calibrations
at Path 2 using baseline signal levels of Path 3 (BCD Device)...77
Figure 33: BCD Device calibration curve for experiment one ...105
Figure 34: BCD Device calibration curve for experiment one ...106
Figure 35: BCD Device calibration curve for experiment one ...107
Figure 36: BCD Device calibration curve for experiment three...108
Figure 37: BCD Device calibration curve for experiment three... 109
Figure 3 8: BCD Device calibration curve for experiment three... 110
Figure 39: BCD Device calibration curve for experiments two and four...Ill Figure 40: BCD Device calibration curve for experiments two and four...112
Figure 41: BCD Device calibration curve for experiments two and four...113
Figure 42: BCD Device calibration curve for experiments two and four...114
Figure 43: BCD Device calibration curve for experiments two and four...115
Figure 44: BCD Device calibration curve for experiments two and four...116
Figure 45: BCD Device calibration curve for experiments five, six, and seven...117
Figure 46: BCD Device calibration curve for experiments five, six, and seven...118
Figure 47: BCD Device calibration curve for experiments five, six, and seven...119
Figure 48: MIRAN calibration curve for experiment one... 120
Figure 49: MIRAN calibration curve for experiment one... 121
cc/min cubic centimeters per minute CT Computed Tomography
d.c. direct electrical current
DIAL Differential Absorption Laser
DOAS Differential Optical Absorption Spectrometer ECD electron capture detector
FTIR Fourier Transform Infrared
GC gas chromatograph
I.D. inner diameter IR Infrared
LDL lowest detectable level, (ppm-m) LIDAR Light Detection and Ranging
1pm milliliters per minute, flowrate MDL maximum detectable level, (ppm-m)
mV millivolts
ORS Optical Remote Sensing
ORS/CT Optical Remote Sensing and Computed Tomography
ppm concentration in parts per million, volume basis
ppm-m concentration density in parts per million meters, volume basis SF5 sulfur hexafluoride
STEL short-term exposure limit, (ppm) TLV threshold limit value, (ppm)
LIST OF SYMBOLS
I intensity of transmitted beam
Iq intensity of incident beam
A absorption coefficient of a gas or vapor
C concentration of a gas or vapor, (ppm volume) L pathlength, distance traversed by beam
°ief reflectivity of mirror at reference wavelength °abs reflectivity of mirror at absorbed wavelength
Rj-ef reference signal level in reflected-beam configuration, (millivolts) Sj-gf reference signal level in single-beam configuration, (millivolts)
Rabs absorbed signal level in reflected-beam configuration, (millivolts)
'^abs absorbed signal level in single-beam configuration, (millivolts)
'^mult ref resultant reflectivity at reference wavelength upon multiple reflections
"mult abs resultant reflectivity at absorbed wavelength upon multiple reflections
"j-gf single-mirror reflectivity at reference wavelength
"abs single-mirror reflectivity at absorbed wavelength N number of mirrors used
Y path-averaged concentration displayed by device, (ppm) X actual path-averaged concentration, (ppm)
M slope of regression line B y-intercept of regression line
La pathlength of cell a, (meters)
Ca actual concentration in cell a, (ppm)
Lj pathlength between receiver and transmitter, (meters) Lcell pathlength of single-compartment calibration cell, (meters)
Traditional Methods of Workplace Exposure Assessment
In assessing worker exposure to airborne gases and vapors, industrial hygienists
conduct sampling using both time-integrating and direct-reading methods.(1) Typically, two types of sampling are performed, personal and area sampling.
Time-integrating methods involve passing a known volume of air through media
that collects contaminants from the sampled air over a specified time period. This results in one number representing the time-weighted average exposure. Typically, the collected samples require laboratory analysis. The direct-reading method involves the collection of a small point-sample of air which is measured in real-time; laboratory
analysis is not necessary. Portable direct-reading instruments that can provide real-time monitoring of changing contaminant levels dse. invaluable to the industrial hygienist for
locating sources of emission of hazardous gases, checking the performance of control
equipment, and determining whether or not or not peak exposure limits are being
exceeded in certain areas.
Personal sampling involves attaching the sampling device directly to a worker for a specified period of time to collect air from the worker's personal breathing zone.
A measurement is obtained of the worker's time-weighted average exposure during the
workshift. Area sampling involves placing one or more sampling devices at strategic
locations in the workplace. Depending upon the equipment used, either time-integrated
samples or direct-reading measurements can be obtained from isolated locations in the
that occur throughout the day. Monitoring these fluctuations is very important for evaluating exposures to acute chemical hazards and highly toxic materials. Monitoring this peak exposure information including the concentration, time, and place of
occurrence is important to the industrial hygienist in assessing and controlling these
hazards.
The loss of time and concentration information in integrated sampling results in poor temporal resolution of chemical concentrations. The individual numbers obtained
for isolated workers or isolated locations in a room results in poor spatial resolution. In direct-reading sampling, the availability of time and concentration
information results in good temporal resolution. Direct-reading instruments used in
area sampling have the advantage of real-time measurement of a contaminant and can
determine the concentration of a peak exposure if the exact location is known; if the exact location is not known, direct-reading instruments may entirely "miss" peaks. Because a finite number of small, point samples are usually collected, the spatial
resolution is typically poor. A large number of simultaneous measurements collected
throughout the workplace would be required to gain spatial resolution; this is generally
not feasible due to the high cost of direct-reading instruments.
The lack of good temporal and spatial information is a distinct limitation to
gaining a better understanding of exposures, contaminant generation, and contaminant flow in the workplace. This research begins to investigate an alternative method that would ultimately result in both good temporal and spatial resolution of airborne
contaminants in the workplace. This method involves the use of optical remote sensing equipment for measuring airborne chemicals in real-time over a large space and the use
of the mathematical techniques of computed tomography to produce two-dimensional
electromagnetic energy projected by a transmitter over some path into a receiver which directs the energy into one or more detectors. The molecules of a gas or vapor interact with the beam of electromagnetic energy allowing for their detection and measurement.
This detection technique is referred to as open-path monitoring; the optical beam is open to the atmosphere allowing gases and vapors to drift through it. No actual sample
collection or laboratory analysis is required. Optical remote sensing equipment uses
either a single beam or a reflected beam that uses mirrors to extend the path. The
distance travelled by the beam from transmitter to receiver is referred to as the
pathlength. To date, the application of ORS equipment to the detection of gases and
vapors has focussed primarily on the outdoor environment where pathlengths of up to one kilometer or more are used; the indoor application of this equipment has received far less examination.
With ORS equipment, a gas or vapor entering any part of the beam path is detected and measured in real-time; this results in good temporal resolution. When either a single or a reflected beam is used, greater spatial coverage is obtained than with the finite number of point samples taken in traditional area sampling. Although a
larger area of the workplace is sampled in real-time, each single beam provides one
number representing the integrated concentration over the pathlength; good spatial resolution is not provided. If multiple beams are used in the workplace, and the mathematical techniques of computed tomography are applied to these remotely-sensed data, two-dimensional maps of the gas concentrations in a room are created and good
generated from near real-time measurements taken using the ORS equipment and strategically placed mirrors to allow the workplace to be scanned with an intersecting network of reflected beams.(2) Figure 1 illustrates this network of beams in a room. The maps created would provide spatial and temporal information concerning
fluctuations in exposures. An example of a concentration map that might be generated
is presented in Figure 2.
Before this new technique can be applied in the workplace, it must first undergo theoretical and experimental validation. Theoretical validation of this method using computer simulations has been the subject of research by Todd.(2) Experimental
validation is the subject of this research.
Statement of Problem
The ultimate goal of this research was to evaluate an ORS device for the
eventual laboratory validation of the ORS/CT theory. It needed to be determined whether or not a commercially-available ORS device possesses the accuracy to measure open-path concentrations of a gas or vapor in the indoor environment. As stated
before, most ORS devices have been designed for outdoor use.
Before proceeding with a network of reflected beams, an ORS device had to be selected and then calibrated using an independent validation method to verify that a single beam accurately measured gas concentrations. A single test gas was used to serve as a model for other gases and vapors in the workplace. This research initially
8 J00
-fe>
1 i
i -350
•i
-300
8 . i -250
i i i ... 200 i/TVAAA'
150
OvAf A/X/yUW -
100)A(XftWi
-500
I
Methods of Detection in Optical Remote Sensing (ORS)
The methods used by ORS devices for detecting gases or vapors include Raman
scattering, fluorescence, and absorption.(3,4,5) These methods were reviewed to determine which was the most feasible for this indoor research.
In the Raman scattering method, light energy strikes the gas molecules and is scattered at wavelengths unique for each pollutant. The intensity of scattering at each
wavelength gives an indication of the respective pollutant concentrations. The
disadvantage of this method is the isotropic nature of Raman scattering which
necessitates the use of very large optics in these instruments. (4) This limits its use to high concentration applications where a very large space is available to locate the instrument. This method is not particularly useful for monitoring in the workplace where low concentrations of contaminants may need to be measured.
Fluorescence results when certain types of molecules release excess energy in the ultraviolet or visible regions after becoming excited by absorption of energy at a different wavelength. This method is not favored in the indoor environment because
high concentrations of gases may be present causing the molecules to collide with one
another before emission; this results in quenching, the reduction of fluorescent
output. (5)
For optical remote sensing of the workplace, the most useful method of detection is absorption because many gases and vapors of interest in the workplace
possess good absorption characteristics that allow for their detection and
wavelengths unique to each molecule. (9) The absorption of energy by a gas or vapor is
governed by Beer's Law, Equation (1).
I/Io = e -^^L (1)
where,
I is the intensity of the transmitted beam, lo is the intensity of the incident beam,
A is the absorption coefficient of the gas or vapor, C is the concentration of the gas or vapor, and
L is the pathlength, or distance traversed by the beam.
When ORS equipment is used, all variables of the equation are known except
for the gas or vapor concentration, C. ORS devices using absorption measure the
path-integrated concentration, the product of average gas concentration along the path and the pathlength. When the device indicates a path-integrated concentration of 100
ppm-meters, no information concerning the distribution of gas within the beam is available; the same reading results from a uniform concentration of 10 ppm over a pathlength of 10 meters as that from a plume of 100 ppm contained within just 1 meter of the path.
Dividing the path-integrated quantity by the pathlength yields the average gas concentration over the path. This is referred to as the path-averaged concentration. Software available with some ORS devices enables the direct measurement of
path-averaged concentrations.
ORS devices using absorption can use light energy in the visible, infrared (IR),
or ultraviolet (UV) spectral regions.(6,7,8) Absorption of visible light (380 to 800
nanometers) by a molecule results in energy changes involving the valence electrons. Most gases do not absorb visible light energy. IR energy (0.8 to 50 micrometers), the
nanometers) absorption causes energy changes that involve the ionization of atoms and molecules. UV can be used to detect certain gases that cannot be detected with IR such
as chlorine gas and hydrogen sulfide.
Types and Applications of ORS Devices
Several different types of ORS devices have been developed over the past 25 years which use absorption to determine the concentrations of gases and vapors over an open-path. (7) These instruments are generally classified according to the type of electromagnetic energy used for detection: monochromatic or spectrally broad-band.
Monochromatic devices emit light energy of a narrow spectral range while spectrally
broad-band devices emit energy of a much wider range. A review of these instruments
was required to determine the most suitable, commercially-available device for use in
this research.
Monochromatic devices typically operate by differential absorption: absorption
at a wavelength of maximum absorption is compared to absorption at a second
wavelength that is not absorbed by the gas of interest. The difference in absorption is directly related to gas concentration. Typically, these devices are dedicated to
detection of a single gaseous contaminant at a time. The monochromatic class of ORS devices includes Long-Path Differential Absorption Laser (DIAL) and Differential Absorption Light Detection and Ranging (DIAL or Differential Absorption LIDAR)
instruments.
Spectrally broad-band devices can detect concentrations of many different gases by scanning over a spectral region and comparing the generated scan to a reference
scan; a spectrally broad-band device can also be dedicated to single gas detection by
wavelengths to reach the detectors. Spectrally broad-band instruments consist of
differential optical absorption spectrometers, the correlation spectrometers, and other
spectrometers including the Fourier-transform infrared (FTIR) spectrometer.(6,7,8)
Long-Path Differential Absorption Laser
The long-path Differential Absorption Laser (DIAL) remote sensor uses a pair of continuous-wave (cw) lasers to create a coUimated beam of electromagnetic radiation that can often be tuned to a particular wavelength for the molecular species of
interest.(7,8,10) This technique may also use pulsed lasers. The instrument uses
differential absorption to detect a gas by operating one laser at the wavelength of
maximum absorption for the pollutant of interest and a second laser operating at a non-absorbing wavelength. The long-path monitoring technique employs a topographical target or retroreflector to define a path over which the average gas concentration is determined.(10) Types of lasers used include carbon dioxide lasers, tunable diode lasers, and neutral gas lasers. (6,7,12) The selection of the laser depends on the
pollutant being monitored. Presently, the use of this technique is limited to research
and these devices are not commercially-available. (6)
Differential Absorption Light Detection and Ranging
Differential Absorption Light Detection and Ranging (LIDAR) is a second type
of monochromatic optical remote sensor; it also uses differential absorption to measure gas concentration. The main distinctions between it and Long-Path Differential
Absorption Laser monitoring are the use of a pair of pulsed lasers and the absence of
targets or retroreflectors.(7,8) LIDAR depends on atmospheric backscatter for the
return signals to determine both concentration and distance to a pollutant cloud. This added capability of ranging makes LIDAR a more popular technique than the
include: 1) dye lasers for sulfur dioxide, ozone, and nitrogen dioxide; 2) carbon dioxide lasers for ozone and ethylene; 3) helium neon lasers for methane; and 4) tunable diode lasers for a wide variety of gases. (8)
Since the mid 1960's, LIDAR has been used to measure trace gases in the
atmosphere. (11-19) More recently, a LIDAR system has been used to perform range-resolved monitoring of atmospheric atomic mercury pollution. (20,21) Using the
LIDAR technique, researchers were able to construct a three-dimensional map of the
pollutant cloud. LIDAR has also been used to make long-term measurements of
stratospheric ozone concentration profiles from 20 to 50 km altitudes.(22) For the
remote sensing of sulfur dioxide, LIDAR offered a sensitivity of a few parts per billion at ranges in excess of one kilometer. (23)
Currentiy, the use of LIDAR is limited to research applications, and no LIDAR systems are commercially-available. (7)
Differential Optical Absorption Spectrometers
The Differential Optical Absorption Spectrometer (DOAS) is a type of
spectrally broad-band optical remote sensor. This device uses a scanning spectrometer
operating in the near UV and visible spectra and is well suited to the monitoring of
compounds having weak IR spectra. Absorption spectra over a long path are generated
and compared to a library spectra of known gases. (6) This instrument typically uses either a remotely located UV-visible light source or a collocated light source with a retroreflector to create a long path.
Researchers at the Lund Institute of Technology have used a DOAS system for
atmospheric mercury monitoring.(24) Mercury levels in the parts per trillion range
were assessed. The U.S EPA has operated a DOAS system at pathlengths up to 1824
gases over a total optical pathlength of 800 meters. (27) These devices are commercially-available. (7)
Gas Cell Correlation Spectrometers
The Gas Cell Correlation Spectrometer is a second type of spectrally broad-band optical remote sensing device. This instrument uses a rotating gas filter consisting of a sample cell and a reference cell.(6,7,28,29,30) The difference in energy transmission between the two cells relates the concentration of the gas in the sample cell to that in
the reference cell.
Gas Cell Correlation Spectrometers have been used for atmospheric
monitoring.(31-32) A correlation spectrometer that uses the sun as a light source,
COSPEC, was developed in the 1970's and has been used to make remote SO2 mass
flux measurements.(29) A second type of correlation spectrometer, GASPEC, was also
developed.(28) In the early 1980's, another system was used by NASA to perform
carbon monoxide measurements in the troposphere. (30) Some of these devices are
commercially-available. (7)
Other Spectrometers
Broad-band spectrometers have been commercially-available since the 1970's.
These systems typically consist of a separate transmitter and receiver and use
differential absorption in the IR or UV to detect the presence of a gas. These
spectrometers are normally dedicated to the detection of a single contaminant by using
filters; however, some instruments may scan a spectral region for the detection and
measurement of a number of gases.
parts per million over a 100 meter pathlength.(34) MDA Scientific has developed a similar instrument dedicated to single gas monitoring.(33)
Spectrometers operating in the UV are also available and have been used outdoors to detect nitrous and sulfurous emissions from coal and oil fired industrial
plants.(34)
Fourier Transform Infrared Spectrometers
The Fourier Transform Infrared (FTIR) Spectrometer is another type of
spectrally broad-band optical remote sensing device that has been extensively used since
the late 1970's. This device operates in the IR spectral region and uses a pair of
mirrors, one stationary and one movable, and an interferometer to "transform" the spectral distribution of wavelengths into a form that can be mathematically converted to
a conventional infrared intensity spectrum.(6,7,35) The main advantage of using this instrument is that the entire spectral region is scanned very quickly. The generated interferograms obtained in the field are then compared to laboratory spectra for known
compounds.
FTIR spectroscopy has been extensively used over the past 10 years in
open-path, outdoor air monitoring. It has been used to measure California smog and has been applied to the remote measurement of emissions from industrial operations where pathlengths of up to a kilometer or more were used.(37-43)
Recently, a transportable, FTIR instrument was built that is able to detect and quantitate individual gases and vapors at or below their respective TLV's.(44) This
instrument was designed to operate indoors at pathlengths of up to 40 meters. Most
recently, the same researchers tested an FTIR optical remote sensor in a controlled
ventilation chamber using acetone vapor as a test gas and found the device to be quite
History of ORS Calibration Methods
Calibrating an ORS device presents a unique set of problems as compared to the
calibration of other monitoring instruments due to the open-path monitoring technique. Other monitoring instruments typically have a sample cell into which a sample of air is extracted and becomes stable in its isolation from the environment. ORS devices, however, measure gases and vapors over a path that is entirely open to the atmosphere
and, therefore, unstable. The atmosphere causes fluctuations in the concentrations over the beam path making it nearly impossible to achieve a stable concentration for
calibrating the device.
The calibration of ORS devices has been performed by other investigators by using stationary or moving point monitors placed along the path (43,46,47), or by
using calibration cells placed in the beam path.(40,48-51)
Typically, in the outdoor application, ORS devices calibrated over a long path
have used several, stationary point samplers such as gas canisters placed along the beam path.(46) Each sampler simultaneously collected a time-integrated sample during a specified sampling period. The integrated measurements were then averaged to obtain a path-averaged concentration. (43) A second method was proposed that used a single, moving point sampler to traverse the open path. (46) The moving sampler
performed a time-integrated measurement as it traversed the beam path during a specified period of time. Recently, this technique was used to compare FTIR
spectrometer measurements of volatile organic compounds in an outdoor, industrial setting.(47) Point samplers were mounted on the back of a bicycle and moved along
the path at a constant speed.
In calibration, accurate measurement of actual gas concentration within the
beam path is necessary to effectively validate the ORS device. The methods typically used for calibrating ORS devices outdoors over a long path using integrated
In the outdoor environment, gas concentration variability within the beam can
be significant; the concentrations are almost never uniform, or homogeneous. The
concentration can vary as a function of position along the beam path and as a function
of time. The collection of a finite number of time-integrated samples along the path
may result in entirely "missing" plumes of gas that cross the path. Although the ORS device can detect a plume crossing its path, the plume may drift between two point monitors and be entirely undetected. This may cause the point-sampling validation
equipment to underestimate the actual gas concentration along the path. Even if the plume is not missed, the use of time-integrating validation methods results in a loss of information concerning the fluctuating concentration of this plume because gas
concentrations are averaged over time. In addition, time integrating methods may have
sampling and analysis errors that are different from direct-reading methods that could
bias the results. For these reasons, calibrating the ORS device which operates in real¬ time with the use of a finite number of time-integrated, point samples is not ideal.
The disadvantages of using a moving point-monitor to calibrate ORS devices
over a long path are similar to those of using stationary point monitors. Again, a time-integrated sample is collected resulting in a loss of plume concentration information.
Also, the possibility of missing gas plumes is significant because the point monitor cannot cover the entire beam simultaneously. As with the previous method, this also
involves calibrating the ORS device which operates in real-time with a time-integrating
method.
Another method used to calibrate ORS devices involves the use of calibration
cells placed in the beam path. (40,48-51) This has been conducted both in the field and
in the laboratory. Calibration cells are commercially-available and are equipped with transmissive windows to allow the beam to pass through the cell which is filled with a
known concentration of calibration gas. In the calibration of a FTIR spectrometer,
syringe. (47) Interference-free air was then flowed into the cell until a specified
pressure was attained. Reference spectra were then recorded as the beam was passed
through the cell containing a uniform, known concentration. Actual gas concentration is usually not verified with other equipment but is calculated based on the volume of
gas injected and the volume of the cell.
Gas flow cells have also been used to calibrate ORS devices. These are a type of calibration cell where a constant flow of calibration gas is passed through the cell
which is placed in the beam path. An IR spectrometer was recently calibrated using
mixtures of pure carbon dioxide and carbon monoxide mixed with nitrogen which were
passed through the flow cell using mass-flow controllers. (49) The ratio of flowrates was used to calculate the concentration of each species withm the cell.
The use of calibration cells in calibrating ORS devices does not suffer from the concentration variability problems associated with the long-path, point sampling methods because the concentration within the cell is uniform, or homogeneous. As
stated before, calculated concentrations are generally not verified with a validation
method but are assumed to be correct. (49) The disadvantage of this method is that the
accuracy of the ORS device in a non-uniform, or heterogeneous environment, is not
The objective of this work was to evaluate the accuracy of a selected optical
remote sensing device for the laboratory validation of Optical Remote
Sensing/Computed Tomography theory. The accuracy of a selected optical remote
sensing device was examined by performing calibrations in the indoor environment at
relatively short pathlengths using two, direct-reading validation methods.
For this research, several decisions had to be made before work could begin. The test gas, ORS device, calibration methods, and validation equipment had to be selected. Before the experiments could be conducted, a calibration cell and a mirror
stand had to be designed and built.
Selection of the Test Gas
Several factors were involved in the selection of the test gas for use in the
experiments: 1) The gas must have good absorption characteristics in the infrared
allowing for its detection and measurement, 2) It should not be routinely present in
indoor air, and 3) The selected gas should have low human toxicity.
Sulfur hexafluoride (SF5) was selected for use in this research. It has excellent
absorption characteristics in the infrared region and is generally absent from the indoor
environment. The gas has a low toxicity; it has a high threshold limit value (TLV) of
Selection of the ORS Device
The selection of SFg dictated that the chosen ORS device must be sensitive to
this gas. Because this work involved using a single gas to model other gases and
vapors, an instrument capable of detecting and measuring multiple gases simultaneously
was not needed. This narrowed the selection to an instrument dedicated to the
detection of a single gas in the infrared spectral region. Of great concern was the eye safety of the light energy used by the ORS device. Laser-based devices were
eliminated from consideration because this high-intensity light source poses a significant risk of eye damage.
The INFRASAFE Single-Gas Open-Path Spectrometer (Six-inch optics model) manufactured by MDA Scientific, Inc. of Lincolnshire, Illinois was chosen for this research. The INFRASAFE is sensitive to SF5 over a wide range of concentrations
and can be dedicated to its detection.(33) It operates in the infrared spectral region and has a low-intensity source of electromagnetic energy, a glowbar. The components of
this device are sufficiently small for use in the laboratory.
Theory of Operation
The INFRASAFE uses differential absorption in detecting the presence of a
specific gas. For this research, the INFRASAFE was equipped with filters designed
for SF5 detection. Other filters are available from the manufacturer to enable detection
of different gases.
The INFRASAFE is composed of three major components: the transmitter which provides and coUimates the infrared energy, the receiver which focuses the beam
to the reference and absorbed detectors, and the control system which converts the voltage signal levels obtained at the detectors to a path-averaged gas concentration.
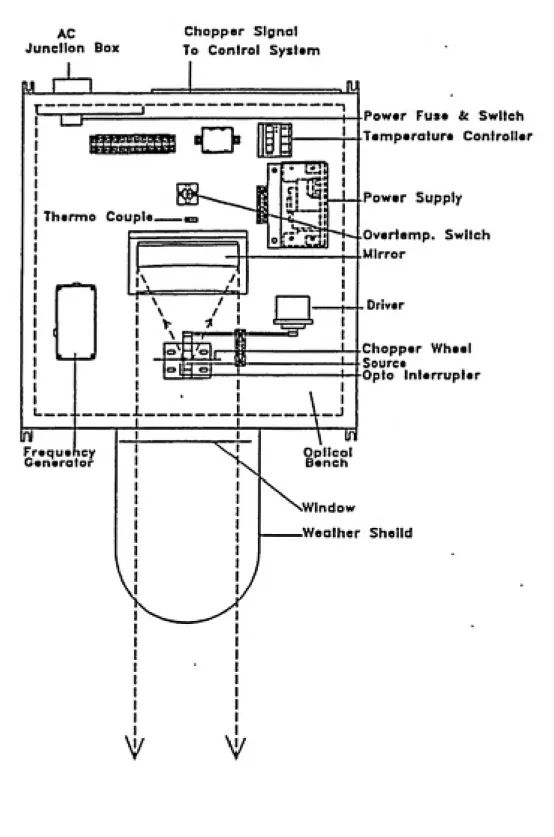
The optical components housed within the transmitter are illustrated in Figure 3
AC
Junelion Box
Chopper Signal To Control Syslam
^^BHHBMaj ͣ P H
-Tharmo Couple
L...ki^
Fraquahcy
Ganarator
Optical
Bench
Powar Fuse & Switch
Tamparaiura Controllar
Power Supply
Overlemp. Switch Mirror
Driver
Chopper Wheel Source
Opto Interrupter
Window
Weather Shelld
operates at 20 volts d.c. and reaches temperatures up to 1300 degrees Celsius. The light produced by the source is spectrally broad-band and includes the visible and infrared regions. The chopper wheel rotates, alternately blocking and passing energy to the mirror. The transmitter mirror coUimates the modulated light energy from the
source into a six-inch diameter circular beam of light; the beam is dispersive,
increasing in diameter as a function of distance from the transmitter. A temperature controller maintains the interior at a constant temperature to minimize the effects of fluctuating ambient temperatures on optical alignment and to prevent moisture
condensation on mirror surfaces.
The components within the receiver are illustrated in Figure 4 and include the
primary and secondary mirrors, the beam splitter, and the reference and absorbed detectors. The beam first strikes the primary mirror and then converges onto a smaller secondary mirror. It then passes through a transmissive beam splitter where it is
divided and sent to each detector. Narrow band-pass filters mounted on front of the
detectors pass energy at a wavelength of 10.6 micrometers to the absorbed detector and energy at a wavelength of 10.17 micrometers to the reference detector. Both detectors are mounted on X-Y-Z translation stages which allow for precision adjustments. Likewise, optics within the receiver are adjustable for tilt (up and down) and pan (left
and right) to facilitate the process of optical alignment. A temperature controller
maintains the interior at a constant temperature.
The Control system consists of an 80286 computer which uses software to
convert detector signal levels into path-averaged gas concentrations in parts per million
(ppm) over a known pathlength which is input into the program.
Optical Alignment of the INFRASAFE
Prior to operation of the INFRASAFE, the device must be optically aligned; the
U.
.Powar Switch an4 Fu»m
Oataelor CabI* Strain RalUf (2)
LT
-Pow«r S
Ton Housing
cr
r?
Jtfl
Tamparatur*
Conlroilar
-Prlnnory Mirror
XYZ Translation Slag* Dataeior Housing
' Absorbad
tnlarfaranea Flllar
Biom Spllttar
Rafaranea
Intarfaranea Fllisr
' Optical Baneh
Saeondorir Mirror
Tnl
ͣ
window
Waathsr Stilald
in millivolts (mV) at both detectors without SFg in the beam path. These maximum
signal levels are referred to as the baseline signal levels and are input into the control
system.
After alignment, the distance between the receiver and transmitter apertures, the
pathlength, is measured, and its value is input into the control system.
The INFRASAFE control system is capable of operating with a single pair of
baseline signal levels and a pathlength value. Because the dispersive nature of the
infrared beam results in a lower intensity of light reaching the receiver as pathlength is
increased, baseline signal levels tend to decrease as pathlength is increased. If the
device is moved to a new position providing a different pathlength, the system must be
re-aligned and these new levels and pathlength value should be input into the control
system.
Usable Range of the INFRASAFE
The INFRASAFE has both a maximum detectable level (MDL) and a lowest
detectable level (LDL) which define a usable range for each chemical over which the
device can reliably operate. For SFg detection, the manufacturer claims a LDL of one
ppm-meter. The claimed MDL is 100 ppm-meters. (33) Beyond the MDL, the
reference signal begins to be absorbed to a significant degree resulting in a loss of
accuracy.
The LDL and MDL are specified in terms of path-integrated concentrations.
Because the INFRASAFE displays path-averaged gas concentration, the LDL and MDL
need to be converted to the path-averaged quantity by dividing each level by the
pathlength. For example, the upper path-averaged concentration limit using a
pathlength of 10 meters is the MDL, 100 ppm-meters, divided by 10 meters, or 10
Modincations to INFRASAFE Required for Indoor Use
Initial work with the INFRASAFE immersed in a room-size chamber filled with
SFg revealed that the lid seals of both components were not sufficiently air-tight to
prevent intrusion of the gas. This gas intrusion resulted in unintended absorption and
prevented the INFRASAFE from returning to a reading of zero ppm when all gas was
evacuated from the chamber. Figure 5 illustrates this problem. The ascending set of
data was taken as concentration in the chamber was increasing, and the descending set
of data was taken as the chamber concentration was decreasing. These two sets of data
should lie on the same line, but gas that had leaked into the housings while the chamber
concentration was increasing prevented the INFRASAFE from returning to a reading of
zero ppm.
To solve this problem, the receiver and transmitter housing lid seals were removed, and a continuous bead of silicone rubber was applied in place to create a
nearly air-tight seal.
The receiver has a longer internal pathlength, the distance light travels between the internal optics, than does the transmitter; therefore, gas intrusion into this
component caused more unintended absorption than in the transmitter.
To further prevent gas intrusion, a nitrogen purge system was installed in the receiver housing to create a slight, internal, positive pressure. The receiver housing
was fitted with inlet and outlet fittings, and nitrogen from a compressed gas cylinder
purged the housing via a two-stage regulator at an optimum flowrate of one liter per
minute. This flowrate did not affect the signal levels and created an internal pressure
of one-half inch of water. A flowrate in excess of 1.5 1pm resulted in cooling of the
a
o
ͣ
->
d
O
a o
U 90
80
70
60
50
40
-30
d 10
0
[-r
Single Beam
Unimproved Seals
Pathlength = 1.90 Meters
t
>Oa
[ ^ J^y^ i 1
L...my^ -^^... ...'
X i
I y^/
ͣ
Descending
n Ascending
\^ W
r-f^
, , 1 . , , , 1 , , , < 1 , , , < 1 , 1 , , 1 , , . , 1 ,0 10 20 30 40 50 60
Actual Concentration (PPM)
70
Figure 5 Actual versus Indicated Concentrations prior to modification of
Validation of the ORS Device Calibration
Before the ultimate goal of using the INFRAS AFE in the laboratory validation
of ORS/CT theory could be realized, the device required calibration to verify that the
measured gas concentrations displayed by the instrument were correct. For this
research, two methods of calibrating the device were devised which were improvements
over typical ORS calibration methods.Calibration of the INTRASAFE
After review of the calibration methods described in the optical remote sensing
literature, two improved methods were developed. In experiments using a
homogeneous environment where the concentrations were uniform, several point
samples were taken along the beam path and analyzed by a direct-reading instrument.
Each sample was collected individually, and sampling was completed very quickly.
The path averaged concentration was calculated by averaging the point-samples.
In experiments using a heterogeneous environment, where concentrations vary
in space along the beam path, calibration was performed using a calibration cell with
five separate compartments. This was used to create a stable, heterogeneous
environment. The contents of each cell were analyzed with a direct-reading
instrument.
Compared with the time-integrated, point-sampling methods used by other
researchers to calibrate open-path instruments, for this research, in the calibrations
using a homogeneous environment, direct-reading, point samples were collected along
the beam path. Stable, homogeneous environments were created in a 850 cubic foot
chamber. Because this environment was homogeneous, gas concentration variability
over the path was eliminated; no plumes of gas were present that could have been
different, homogeneous gas concentration was present in each compartment of the
calibration cell. This simulated a heterogeneous environment when the beam passed
through all the cells. The stability afforded by the individual compartments eliminated
the problem of concentration variability along the path. The concentration in each cell
was validated by a direct-reading instrument.Validation Instruments
The two instruments chosen for calibrating the INFRASAFE, a MIRAN lA
infrared gas analyzer and an electron capture detector (ECD) device with a gas
chromatograph (GC) column, were both sensitive to sulfur hexafluoride and were direct-reading. The MIRAN was used only in the experiments using a single beam in a
homogeneous test environment. The ECD device was used in all of the experiments.
The MIRAN lA is a miniature, infrared, gas spectrophotometer with a 5.6 liter
sample cell.(53) The unit is supplied with a fan to draw air through the sample cell.
Sample analysis with the MIRAN was limited by its comparatively large cell volume;
only two points along the beam path were sampled with the MIRAN because of the
length of time required to purge the cell contents and acquire the next sample. Another
limitation of the MIRAN's large cell volume was that it prevented the attainment of a
small, point sample; the MIRAN actually draws air from a much larger space. These
limitations and a desire to validate the INFRASAFE with a non-infrared method of
analysis led to the construction and use of the ECD device.
An ECD device with a chromatographic column was constructed of materials
from Valco Instrument Co. of Houston, Texas, Radio Shack, Inc., and ITI, Inc. (see
Appendix A). Figure 6 is a schematic of this device.
O.S cc sample loop
vent (or pump)
QC valve actuator
Insulated
enclosure
Eleclron capture
detectof
Electrometer Recorder
6 port
GC valve
_f
X°*
Ion Track
SF,
column Needle
valve
3-way
solenoid valves
y I Rotameter
V eocc/min
V^
within the gas sample. (54) The concentration of the gas sample is related to electrical
measurements made at the chamber's electrodes.
With the ECD device, sample volume was small and was determined by the size
of the syringe selected for use. The design of the instrument permitted the use of
syringes that were thirty-milliliter or smaller. With this device, multiple syringe
samples could be collected quickly and then injected into the instrument.
After selection of the validation instruments, a procedure was designed for their
routine calibration.
Calibration of the Validation Instruments
Both validation instruments were calibrated for each experiment during this
research. A calibration gas was made by injecting measured volumes of 30% SF5 by
syringe into a closed-loop calibration loop of known volume. Three complete
calibrations were performed before and after an experiment. The average reading at
each test concentration was plotted over the calibrated range. Checks of stability were
made during the experiments by testing a few points on the calibration curve. The MIRAN was calibrated using the closed-loop calibration circuit
recommended by the manufacturer. This loop consists of a diaphragm pump, tubing, a
septum, and the MIRAN's 5.6 liter sample cell. The pump circulated the air through
the loop which had a total volume of 5.65 liters. This same 5.65 liter, closed-loop was
used to calibrate the ECD device. Routine calibration of this instrument was
particularly important during the first few weeks of operation after building the device
because its sensitivity tended to increase the more it was used.
Calibration Cell
layers of window material. As the beam passes through the cells, each layer of
window material absorbs a percentage of the incident infrared energy resulting in a less
intense beam. It was necessary to minimize this energy loss to retain a good signal to
noise ratio.
For the window material, layers of 0.5 mil thick clear polyethylene film were
selected; a single layer of this film absorbs about 10% of the incident infrared energy.
Saran film was considered, but the use of this film resulted in absorption of
approximately 30% of the incident energy per layer.
A calibration cell was constructed that had five, separate compartments; this
required the use of six layers of polyethylene film for windows. Five compartments
would allow the simulation of a heterogeneous environment without unacceptable
reductions in signal levels. A compromise had to be reached between the number of
compartments and signal level reduction by the polyethylene film.
The cell housing consisted of a sectional, rectangular wooden frame. Each of the five compartments comprising the unit had an internal volume of 5.85 liters and provided a pathlength of 14 centimeters. The individual compartments of the cell were designated as cells A, B, C, D, and E. The entire cell provided a pathlength of 70
centimeters.
The interior surfaces of each cell were coated with two coats of polyurethane to
prevent absorption of sulfur hexafluoride. A fan (10,800 RPM, 6V DC electric motor
fitted with a plastic mixing blade) was mounted inside the top of each compartment to
rapidly mix the injected gas. Electrical wires were routed through 1/16" diameter holes
drilled in the bottom of the side wall. Silicone gasket material formed the mating
surface between each cell. All interior joints in each compartment were covered with a
bead of silicone material to prevent gas leakage. On each side of the cell, a three foot
long, l/4"-20, threaded steel rod was inserted through holes drilled horizontally
used to draw the components together as a unit. A septum was installed in the center of one side wall of each of the five compartments for injection and withdrawal of gas with a syringe. In the top wall of each compartment, two 5/16" diameter holes were drilled for the purpose of purging with vacuum equipment; these holes were plugged
during the course of each experiment.
Before this cell could be used in the experiments, it had to be tested to ensure that injected concentrations did not change during the time required to complete one trial of an experiment. It was determined that thirty minutes were sufficient to complete one trial. To test gas stability over this time period, each compartment was
injected with one ml of 30% SF5. Ten-ml syringe samples were taken every ten
minutes and analyzed with a direct-reading instrument. No detectable change in
concentration occurred in any compartment over a thirty minute period.
To create a single-compartment calibration cell, the layers of polyethylene film could be removed leaving only a film window at each end. This resulted in a single-compartment cell that provided a pathlength of 70 cm with an internal volume of 29.25
liters.
After the calibration cell had been designed, it was necessary to design and construct a stand to hold a pair of mirrors to reflect the transmitted beam in the
reflected-beam experiments.
Mirror Stand for the Reflected Beam Experiments
An adjustable mirror stand was designed and constructed to reflect the
transmitted beam into the receiver. This device consisted of a wide metal base, an
aluminum pole, two sliding pole brackets, two mirror mounts, and two first-surface
mirrors.
A wide, weighted metal base 15 inches wide and 20 inches long was fitted with
pole brackets were constructed which could be clamped at any position on the pole. A
reverse-angle mirror mount (Cat. no. 337,922; Edmund Scientific Co., Inc.,
Barrington, NJ) was attached to each bracket; a 169 by 194 millimeter first-surface mirror (Cat. no. B41,405; Edmund Scientific Co., Inc., Barrington, NJ) was fastened to the face of each mount. The mirror mounts provided precise adjustment of the mirrors for both tilt and pan. The mirrors were mounted orthogonally to deflect the
transmitted beam 180 degrees into the receiver.
Overview of Experiments
Throughout this work, the INFRASAFE was calibrated by comparing the
open-path measurements to point-sample measurements taken along the beam open-path with the
direct-reading validation equipment. The following experiments were performed:
1. Calibration of the INFRASAFE using a single beam in an environment containing a uniform, or homogeneous, gas concentration.
2. Calibration of the INFRASAFE using a single beam in an environment
containing a non-uniform, or heterogeneous, gas concentration.
3. Calibration of the INFRASAFE using a reflected beam in an environment
containing a homogeneous gas concentration.
4. Calibration of the INFRASAFE using a reflected beam in an environment
containing a heterogeneous gas concentration.
5. Calibration of the INFRASAFE using a single beam and a calibration cell
6. Calibration of the INFRASAFE using a reflected beam and the input of
incorrect pathlength values
7. Calibration of the INFRASAFE using a reflected beam and the input of
incorrect baseline signal levels.
8. Experiments to determine the reflectivity of the mirrors used in this
research.
Experimental Design
Experiment one was performed to verify that the INFRASAFE accurately
measured path-averaged concentrations in the simple case of the homogeneous environment using a single beam. This was an important first step in examining the
accuracy of the INFRASAFE indoors. If the device failed to accurately measure gas
concentrations in this simple environment, it could not be expected to work well in the
more complex and realistic case of a heterogeneous environment.
Experiment two was performed to verify that the INFRASAFE accurately measured path-averaged concentrations using a single beam in the heterogeneous environment, an environment typical of workplace air. The five-compartment
calibration cell was used to create a stable, heterogeneous environment.
Experiments three and four were performed to verify that the device performed
accurately in the reflected-beam configuration. In practice, mirrors will probably be
used to reflect the beam in the workplace. Experiment three was conducted to verify
that the INFRASAFE accurately measured path-averaged gas concentrations in the
the INFRASAFE in the heterogeneous environment. Experiment four used the
five-compartment cell to simulate a stable, heterogeneous environment.
In the validation of ORS/CT theory in a chamber, a scanning device will
probably be used to project the beam over several different paths to create a network of reflected beams. In this network, the pathlengths of the beams will not be equal;
therefore, it was important to determine that the INFRASAFE accurately measured
path-averaged concentration over different pathlengths. Experiment five was
performed to determine whether or not the accuracy of the INFRASAFE was affected
by using different pathlengths. This experiment determined whether or not the algorithm used by the control system software accurately corrected for the different
input pathlengths and involved calibrations at four different pathlengths, 1.50, 3.00,
4.50, and 6.00 meters. Prior to each calibration, the correct baseline signal levels and
the correct pathlength value were input into the control system.
In the creation of a network of beams, several different pathlengths will probably be encountered. However, the configuration of the INFRASAFE's control
system software permits the input of a single pathlength value. This limitation of the
software requires that the displayed concentration information be mathematically
corrected when the actual pathlength used is different from the input pathlength.
Experiment six was conducted to determine whether or not path-averaged
concentrations displayed by the INFRASAFE could be mathematically corrected by
multiplying displayed concentrations by the input pathlength and dividing by the actual
pathlength. This experiment involved calibrations at the same four pathlengths as used
in experiment five. In this experiment, prior to each calibration, the correct baseline
signal levels were input in the control system for each pathlength, but the pathlength
value was held constant at 6.00 meters. As a result, incorrect pathlength values were
In the creation of a network of beams, the unequal pathlengths will each result in a different pair of baseline signal levels due to the dispersive nature of the
INFRASAFE's beam. The software used by the INFRASAFE is also limited to the input of a single pair of baseline signal levels. Therefore it was important to determine whether or not the input of baseline signal levels obtained at one pathlength could be used to accurately measure concentrations when another pathlength is encountered even though the levels are incorrect for that pathlength? The purpose of experiment seven was to determine whether or not the INFRASAFE could accurately measure path-averaged concentrations if it is supplied with incorrect baseline signal levels.
In experiment seven, baseline signal levels corresponding to one pathlength were entered into the control system and calibrations were performed at two other pathlengths using the single-compartment calibration cell. This cell was used because a homogeneous test environment using pathlengths longer than those attainable in the
exposure chamber was desired.
Several assumptions were made in designing experiment seven. To determine
the different pathlengths to be used, it was first assumed that the INFRASAFE will be used in a square workroom. The components were assumed to be located adjacent to
one another in one comer of the room. It was further assumed that three different
pathlengths would be encountered in the room, Paths 1, 2, and 3 as illustrated in
Figure 7. In this scan, an angle of 22.5 degrees would be formed by two adjacent paths, and Path 3 would be the longest pathlength created. The longest pathlength
attainable in the lab using the reflected-beam configuration was 16.8 meters; for the
purpose of the experiment, this maximum pathlength was assumed to be the length of
Path 3. The geometry of the scan then dictated the lengths of Paths 1 and 2 to be 11.9
and 12.9 meters, respectively.The creation of a network of beams will probably involve mirrors to project the
A PATH 1 =11.9 meters
PATH 3 = 16.8 meters PATH 2 = 12.9 meters
reflecting the beam so that signal strength is not seriously deteriorated resulting in a
poor signal to noise ratio. Experiment eight was performed to quantify the reflectivity
of the mirrors used in this research so that energy loss due to multiple reflections might
be estimated.In experiment eight, the INFRASAFE was used in the determination of mirror
reflectivity. The INFRASAFE was aligned in the single-beam configuration at a
specified pathlength, and the baseline signal levels were recorded. The device was then
aligned at the same pathlength but in the reflected-beam configuration using the mirrors
to reflect the beam. The baseline signal levels at this position were recorded. By
comparing the signal levels obtained at these two configurations, the mirror reflectivity
was calculated; any decrease in signal levels in the reflected-beam configuration were
attributed to mirror losses, and the extent of these losses in the absorbed and reference wavelengths were calculated using the relationship in Equations (2) and (3).
"ref = (Rref/Sref)^^^ (2)
"abs = (Rabs/Sabs)^^^ (3)
where,
ͣ
^ref is the reflectivity of the mirror at the reference signal wavelength (10.17
lim),°abs is the reflectivity of the mirror at the absorbed signal wavelength (10.6 iim),
Rref is the reference signal level in volts in the reflected-beam configuration,
Sj-ef is the reference signal level in millivolts in the single-beam configuration,
Rabs is the absorbed signal level in volts in the reflected-beam configuration, and
It was not known to what extent signal levels obtained at a specified pathlength
could vary fi^om one alignment to another. Therefore, in experiment eight, five
consecutive alignments were performed in each configuration. The smaller the variation in baseline signal levels among the consecutive alignments, the more
accurately mirror reflectivity could be determined.
Gas Administration
An 850 cubic foot exposure chamber in the School of Public Health was used in experiments conducted in a homogeneous environment. Gas was released into the chamber from a compressed-gas cylinder using a 2-stage regulator. A radial-blade, mixing fan was placed inside the chamber near the gas inlet to ensure adequate mixing
and the creation of a homogeneous environment.
The experiments using a heterogeneous environment were conducted in the laboratory using the five-compartment calibration cell placed in the beam path. Gas flowed through a line equipped with a septum into a flexible exhaust trunk using a
two-stage regulator and was extracted through this septum with thirty-milliliter
polypropylene syringes (Model 9662, Beckton Dickenson, Rutherford, NJ) fitted with
r'-18 gauge stainless steel needles.
Equipment Configuration
Experiments conducted in the single-beam configuration were performed with
the INFRASAFE receiver and transmitter located at opposite ends of the chamber or
laboratory as illustrated in Figure 8. Experiments conducted in the reflected-beam
configuration were performed with the receiver and transmitter located in a rack; the
transmitter was positioned directly beneath the larger, heavier receiver as illustrated in
Figure 9. The vertical distance between beam centers of the transmitter and receiver
Sample Collection
In experiments using a homogeneous environment, Tygon sample lines (1/32" I.D.) twelve feet in length were suspended so that the inlets were located just at the
edge of the optical beam at equally-spaced increments along the path. All sample lines
were routed through a porthole in the exposure chamber. Four lines were used in the
single-beam configuration experiments; eight lines were used in the reflected-beam configuration experiments. These single-beam and reflected-beam sampling
configurations are illustrated in Figures 8 and 9, respectively.
Thirty-milliliter polypropylene syringes were fitted to needles cut to a length of one-half inch thereby eliminating the sharp point capable of puncturing the sample line.
Stability of SF5 within a polypropylene syringe has been shown to be quite good.
Laboratory trials by another investigator revealed that sample deterioration due to leaks
or absorption by the syringe material did not exceed 2% over a two-week period.(55) Before the samples were taken, the syringes were fully filled and emptied three
times to condition the interior walls. This practice has been shown to reduce
adsorption on the syringe wall. (56) During sampling, the syringes were individually
drawn and then capped to await analysis.
In the experiments using a heterogeneous environment, polypropylene syringes
were used to draw gas from each compartment of the calibration cell. The same
practice of syringe conditioning was followed. Each of the five compartments was
sampled individually, and syringes were capped for analysis.
Experimental Procedure
Single and Reflected-Beam Experiments Using a Homogeneous
INFRASAFE
Sample
Lines
_™ MIRAN
ECD
Reflected Beam Set-up
v^y