MOTOR VEHICLE CRASHES AND ADVERSE MATERNAL AND FETAL OUTCOMES AMONG PREGNANT DRIVERS IN NORTH CAROLINA
Catherine Joy Vladutiu
A dissertation submitted to the faculty of the University of North Carolina at Chapel Hill in partial fulfillment of the requirements for the degree of Doctor of Philosophy in the Department of Epidemiology, of the Gillings School of Global Public Health.
Chapel Hill 2012
Approved by: Dr. Charles Poole
Dr. Stephen W. Marshall
Dr. Carri Casteel
ii © 2012
iii
ABSTRACT
CATHERINE JOY VLADUTIU: Motor vehicle crashes and adverse maternal and fetal outcomes among pregnant drivers in North Carolina
(Under the direction of Dr. Charles Poole)
Motor vehicle crashes are the leading cause of hospitalized maternal injury
morbidity and mortality and traumatic fetal mortality among pregnant women in the United States, yet little is known about their determinants. Ongoing pregnancy-related crash surveillance is lacking and crash-related maternal and fetal outcomes are underreported.
Using linked vital records and crash reports we estimated the risk and examined risk factors for being a pregnant driver in a crash and examined the association between crashes and adverse pregnancy outcomes among 878,546 pregnant North Carolina residents, 16-46 years, who reached the 20th week of pregnancy and delivered a singleton infant between 2001 and 2008. We also examined injury risk factors among pregnant drivers who were in crashes after the 20th week (n=11,052).
iv
membranes (RR=1. 48, 95% CI 0.96, 2.27) were observed following pregnant drivers’ second or subsequent crashes, compared to no crashes. Pregnant drivers who were unbelted (RD=20.2, 95% CI 12.7, 27.8) or were in crashes severe enough for substantial vehicle damage (RD=18.1, 95% CI 15.9, 20.4) or airbag deployment (RD=27.9, 95% CI 24.8, 31.0) were at greatly increased risk of injury.
v
To my husband, Matthew, for your tremendous support and encouragement over the past several years. I am incredibly grateful for your willingness to relocate to North Carolina; your determination to keep me company while I worked into the late evening hours; your patience and comfort during stressful times; your care for Noah while I studied; and most importantly, your ability to make me smile and to help me enjoy life to the fullest. Without you, this dissertation would not have been possible.
To my son, Noah, for your smiles, hugs, kisses, and daily reminders of how precious and wonderful life can be.
vi
ACKNOWLEDGEMENTS
I wish to acknowledge my advisor, Charles Poole, and my mentors and committee members: Stephen W. Marshall, Carri Casteel, M. Kathryn Menard, and Harold B. Weiss, for their support, encouragement, and generosity with their time and expertise. My experience at UNC has been much more rewarding and productive because of their support.
This work was supported in part by grant T32-HD052468-03 from the Eunice Kennedy Shriver National Institute of Child Health and Human Development, National
Institutes of Health; the Society for Public Health Education Student Fellowship in Injury Prevention and Control (funded by the National Center for Injury Prevention and Control, Centers for Disease Control and Prevention); the University of North Carolina Highway Safety Research Center Scholarship; and the Robert Verhalen Endowed Scholarship in Injury Prevention and Trauma Management. The datasets used for this dissertation include live birth and fetal death records and motor vehicle crash reports from the State of North Carolina. Vital records were provided by the North Carolina State Center for Health Statistics and crash reports were provided by the University of North Carolina Highway Safety Research Center. Both sources have been used with permission.
vii
help with improving my SAS programming skills; Eric Rodgman and Carol Martell at the Highway Safety Research Center for their help with crash data acquisition and preparation; and Matt Avery at the North Carolina State Center for Health Statistics for his help with vital records data acquisition and preparation. Thank you to the members of my dissertation support group: Emily Brouwer, Melinda Eaton, Bradley Layton, Kristen Rappazzo, and Meagan Vaughn, for their feedback, encouragement, and friendship over the past several years. I would also like to acknowledge all of my friends and family, both near and far, who have supported me during my graduate studies.
The final, definitive version of the literature review for this dissertation has been published in the American Journal of Lifestyle Medicine [Vladutiu CJ, Weiss HB. Motor vehicle safety during pregnancy. Am J Lifestyle Med, 2012; 6(3): 241-49.
viii
TABLE OF CONTENTS
LIST OF TABLES ... x
LIST OF FIGURES ... xii
LIST OF ABBREVIATIONS ... xiii
Chapters I. STATEMENT OF SPECIFIC AIMS ... 1
II. REVIEW OF THE LITERATURE ... 4
Epidemiology of crashes during pregnancy ... 4
Motor vehicle crashes and maternal outcomes ... 4
Motor vehicle crashes and fetal outcomes ... 7
Motor vehicle safety interventions ... 20
Conclusion ... 26
III. RESEARCH DESIGN & STUDY METHODS ... 28
Overview... 28
Data sources ... 28
Probabilistic record linkage ... 30
Measures ... 38
Statistical analysis for specific aims ... 44
IV. RESULTS: THE RISK OF BEING A PREGNANT DRIVER IN A MOTOR VEHICLE CRASH IN NORTH CAROLINA, 2001-2008 ... 57
Introduction ... 57
Methods ... 58
ix
Discussion ... 63
Tables ... 68
V. RESULTS: MOTOR VEHICLE CRASHES AND INJURIES AMONG PREGNANT DRIVERS IN NORTH CAROLINA ... 73
Introduction ... 73
Methods ... 74
Results ... 78
Discussion ... 80
Tables ... 84
VI. RESULTS: MOTOR VEHICLE CRASHES AND ADVERSE PREGNANCY OUTCOMES AMONG PREGNANT DRIVERS IN NORTH CAROLINA ... 89
Introduction ... 89
Methods ... 90
Results ... 94
Discussion ... 96
Tables ... 100
VII. DISCUSSION ... 104
Summary of findings... 104
Public health implications ... 106
Strengths and limitations ... 108
Conclusions ... 111
APPENDIX A - Results from the DAG analysis ... 112
APPENDIX B - Results from the GEE analysis (Specific Aim 2) ... 118
APPENDIX C - Results from the binomial regression analysis (Specific Aim 3) ... 120
x
LIST OF TABLES
Table 2.1. Summary of selected case reports involving a pregnant occupant in a motor vehicle crash, 1987-2009. ... 12 Table 2.2. Summary of findings from five population-based studies
that assessed the effect of motor vehicle crashes during pregnancy on fetal outcomes, 1993-2010. ... 17 Table 3.1 Summary of vital records data fields considered for the
record linkage ... 34 Table 3.2. Summary of match field specifications for comparing vital
records and crash data ... 36 Table 3.3. Variable specifications for vital records data ... 42 Table 3.4. Variable specifications for crash records data ... 43 Table 3.5. Statistical analysis plan, by specific aim, to examine motor
vehicle crashes and adverse maternal and fetal outcomes among pregnant drivers in North Carolina, 2001-2008. ... 55 Table 4.1. Maternal characteristics for being a driver in a serious or
severe motor vehicle crash after the 20th week of pregnancy in North Carolina (N=878,546), 2001-2008. ... 68 Table 4.2. Maternal characteristics for being a driver in a non-severe
motor vehicle crash after the 20th week of pregnancy in North Carolina (N=878,546), 2001-2008. ... 70 Table 5.1. Characteristics of pregnant drivers in crashes after the 20th
week of pregnancy in North Carolina (N=11,052), 2001-2008. ... 84 Table 5.2. Driver characteristics and the risk of injury among pregnant
drivers in crashes after the 20th week of pregnancy in North Carolina (N=11,052), 2001-2008. ... 86 Table 5.3. Vehicle characteristics and the risk of injury among pregnant
drivers in crashes after the 20th week of pregnancy in North Carolina (N=11,052), 2001-2008. ... 87 Table 5.4. Environmental characteristics and the risk of injury among
xi
Table 6.1. Maternal characteristics and pregnancy days completed after the 20th week, by crash involvement, among pregnant drivers in North Carolina, 2001-2008... 100 Table 6.2. Rates and adjusted rate ratios for preterm birth and stillbirth,
by crash involvement, among pregnant drivers in North Carolina, 2001-2008. ... 102 Table 6.3. Rates and adjusted rate ratios for placental abruption and premature rupture of the membranes, by crash involvement, among pregnant drivers in North Carolina, 2001-2008. ... 103 Table A.1. Variable relations for the directed acyclic graph (DAG) to
identify potential confounders of the association between crashes and adverse maternal and fetal outcomes ... 112
Table A.2. Minimally sufficient adjustment sets of covariates identified from the DAG analysis for the association between maternal
characteristics and the risk of being a pregnant driver in a crash ... 114 Table A.3. Minimally sufficient adjustment sets of covariates identified
from the DAG analysis for the association between driver and crash characteristics and the risk of injury ... 115 Table A.4. Minimally sufficient adjustment sets of covariates identified
from the DAG analysis for the association between crashes and the rate of adverse pregnancy outcomes ... 117
Table B.1. Binomial regression analysis to estimate the risk of injury among pregnant drivers in crashes after the 20th week of pregnancy in North Carolina, by inclusion of GEEs, (N=11,052), 2001-2008 ... 118 Table C.1. Unadjusted risk and adjusted risk ratio estimates for the
xii
LIST OF FIGURES
Figure 3.1. Probabilistic record linkage process ... 33 Figure 3.2. Flow chart to estimate the number of pregnant drivers who
were in severe or non-severe motor vehicle crashes after the 20th week of pregnancy in North Carolina, 2001-2008 ... 46 Figure 3.3. Flow chart to estimate the number of pregnant drivers who
were injured in motor vehicle crashes after the 20th week of pregnancy in North Carolina, 2001-2008 ... 50 Figure 4.1. The risk of being a driver in a motor vehicle crash after the
xiii
LIST OF ABBREVIATIONS
CI Confidence interval
CODES Crash Outcome Data Evaluation System DAG Directed acyclic graph
DMV Division of Motor Vehicles
GEE Generalized estimating equations HSRC Highway Safety Research Center LMP Last menstrual period
mph Miles per hour
NC North Carolina
NH Non-Hispanic
NNT Number needed to treat
PROM Premature rupture of the membranes
Pr Probability
RD Risk difference
RR Rate ratio
SA Specific aim
SCHS State Center for Health Statistics
UT Utah
I. STATEMENT OF SPECIFIC AIMS
In the United States, motor vehicle crashes are the leading cause of hospitalized maternal injury morbidity and mortality. It is estimated that 1.3% of pregnant women are involved in crashes annually in the U.S.1 However, this is likely an underestimate due to difficulties in capturing cases. Ongoing statewide pregnancy-related crash surveillance is lacking and administrative databases are limited, as police-reported crash records lack information on pregnancy status and live birth and fetal death records lack data on crash history. In addition, little is known about the frequency and determinants of crash-related maternal injuries during pregnancy. It is estimated that at least 92,500 pregnant women are injured in crashes each year,2 but crash-related maternal injuries are underreported. Injury information is often obtained from hospitalization records and only severe injuries are captured, yet pregnant women also sustain minor injuries that may not result in hospitalization.
2
understand the risk of crashes during pregnancy and the factors that contribute to crash-related maternal and fetal outcomes, more population-based research is needed,
particularly in states with relatively high crash risks among pregnant women.
The specific aims of this study were to:
1. Estimate the risk and describe the risk factors for being a pregnant driver in a motor vehicle crash after the 20th week of pregnancy in North Carolina (NC) between 2001 and 2008.
2. Estimate the risk and describe the risk factors for sustaining crash-related maternal injuries among pregnant NC drivers who were in crashes after the 20th week of pregnancy between 2001 and 2008.
3. Examine the association between motor vehicle crashes involving a pregnant NC driver and the rate of preterm birth, stillbirth, placental abruption, and
premature rupture of the membranes.
3
injuries among a cohort of 11,052 pregnant NC drivers who were in crashes after the 20th week of pregnancy. To address aim 3, we used Poisson regression to estimate rate ratios for the association between pregnant driver crashes and adverse pregnancy outcomes among a cohort of 878,546 pregnant NC residents.
This study adds to the small but growing literature on motor vehicle crashes during pregnancy while improving upon existing studies and their research methods. It also increases awareness of this important public health issue and highlights the need for ongoing statewide surveillance to track crashes and injuries during pregnancy. By
II. REVIEW OF THE LITERATURE
Epidemiology of crashes during pregnancy
Motor vehicle crashes during pregnancy are all too common. In the United States, the annual crash rate for pregnant women has been estimated as at least 13 per 1,000 person-years as compared to 26 crashes per 1,000 person-years among non-pregnant women.1 Although most state-specific crash rates among pregnant women are unknown, there are three states where population-based studies have been conducted to estimate pregnancy crash risks: Pennsylvania, Utah, and Washington State. In Pennsylvania and Utah, the motor vehicle crash risks were 1.1% (between 2002-2005) and 2.8% (between 1992-1999), respectively, among pregnant drivers, with a fairly even distribution of crashes across trimesters.3,7 In Washington State, the motor vehicle crash risk for pregnant front seat occupants (i.e., drivers and passengers) between 2002 and 2005 was 1.0%, with the majority of crashes occurring during the second trimester.4 Weiss & Sauber-Schatz7 suggest that the differences in these statewide crash risks during pregnancy may be due to several state specific factors, including birth rates, the mean maternal age during pregnancy, and the variation of age-specific crash risks for women of reproductive age.
Motor vehicle crashes and maternal outcomes
5
United States, aged 15 to 44 years, are injured and 6,130 women die as a result of motor vehicle crashes.14 Although the number of pregnant women injured in motor vehicle crashes in the United States has been estimated to be more than 92,000 annually, this number is likely an underestimate because many crashes are unreported, and pregnancy status may be unknown, especially early in pregnancy.2 In the United States, the rate of injury from motor vehicle crashes during pregnancy has risen over time. This is mainly a result of increases in exposure—that is, the increasing number of miles driven by pregnant women.1,15,16 Crashes result in many types of injuries. Minor injuries include dislocations, sprains, contusions, and open wounds.5 However, more serious adverse outcomes are possible. Blunt and penetrating abdominal trauma from crashes during pregnancy can result in splenic rupture, uterine rupture, pelvic fractures, placental abruption, and maternal death.5,17-19 The severity of these outcomes depends on a variety of factors, including the gestational age at the time of injury, crash severity, and seat belt use.3,5,15,19,20
A handful of population-based studies have been conducted that examined both national and state-specific pregnancy-associated hospitalizations and emergency
department visits from trauma during pregnancy.8-10,12,13,21 Although these studies described maternal injuries and death from all causes during pregnancy, motor vehicle crashes were recognized as the leading cause of maternal injury. In the United States, approximately 26% of injury hospitalizations during pregnancy resulted from motor vehicle crashes.9 This injury hospitalization risk is similar to the motor vehicle emergency
6
hospitalization was 243.4 per 100,000 live births; motor vehicle crashes were responsible for 30.4% of these injuries.21 Pennsylvania and California reported lower rates of motor vehicle-related injury hospitalizations among women during pregnancy, with rates of 227 injuries per 100,000 person-years in Pennsylvania and 67 prenatal injuries per 100,000 deliveries and 8 injuries to women at delivery per 100,000 deliveries in California.10,13
In addition to the studies that examined injury hospitalizations and hospital emergency department visits from all causes during pregnancy, a few population-based studies5,7,20,22 focused on adverse maternal outcomes from motor vehicle crashes. In New Mexico, Schiff et al.20 examined maternal death records between 1986 and 1995 and found that motor vehicle crashes accounted for 70% of all injury-related maternal deaths. Among the women who died, 77% were not wearing seat belts at the time of the crash. A second study conducted by Schiff and Holt5 in Washington State described the types of injuries sustained by pregnant women who were hospitalized following a motor vehicle crash. Among the 393 pregnant women who sustained crash-related injuries, those who were severely injured (i.e., those with an Injury Severity Score ≥9) were more likely than non-severely injured women to be hospitalized for fractures, dislocations, sprains, intracranial injuries, open wounds, and internal chest injuries.5 In contrast, a higher percentage of non-severely injured women were hospitalized for contusions.5 The most recent
7
An international population-based study estimated the incidence of maternal injuries and fatalities from motor vehicle crashes in Sweden between 1991 and 2001.22 Based on a sample of more than one million pregnancies, the incidence rates of maternal injury and death were estimated as 23 per 100,000 pregnancies and 1.4 per 100,000 pregnancies, respectively, which are lower than the overall U.S. and state-specific rates previously reported.22 However, it must be noted that the overall crash rate in Sweden is lower than the U.S. rate, which may explain the differences observed for pregnant women between the U.S and Swedish studies.23
Motor vehicle crashes and fetal outcomes
8
amniotic rupture, and fetal-maternal blood transfusion, which can lead to adverse fetal outcomes such as prematurity, low birth weight, fetal distress, and fetal death.3,5,17,19,21,22 Placental abruption from severe maternal trauma is a leading cause of fetal loss and accounts for a reported 60% to 70% of all fetal injury-related deaths.25,26 Even in minor or noncatastrophic trauma during pregnancy, the risk to the fetus may be significant. Preterm labor, placental abruption and death can occur among fetuses exposed to minor trauma.
Crash simulation studies
Several simulation studies of automobile crashes during pregnancy have been conducted, primarily at the University of Michigan Transportation Research Institute and the Virginia Polytechnic Institute and State University (Virginia Tech) Center for Injury Biomechanics, with an additional study conducted in Japan. These studies have used female anthropomorphic test devices (i.e. pregnant crash test dummies)27-31 and computational models32-38 to better understand the mechanisms of maternal and fetal injuries and death resulting from motor vehicle crashes. More recently, researchers in France have used post mortem human cadavers as an alternative to dummies for a more “realistic” pregnant model to further examine these injury mechanisms.39,40
Anthropomorphic devices
9
crash speed and restraint position.28,29 In 2001, modifications were made to improve the size and shape of the pregnant abdomen and to implement instrumentation to better quantify the effect of abdominal forces and fetal accelerations on fetal injury and death.27 Initial studies using these devices found that high-speed crashes increased abdominal force and fetal head accelerations, primarily with improper seat belt use.29 In addition, airbag deployment coupled with no restraint use increased the risk of fetal head injury. The combined effect of airbag deployment and shoulder and lap belt use (i.e. 3-point belt) was the most protective for a woman and the fetus.
A recent study of low-impact collisions measured the anterior and posterior abdominal pressure of pregnant dummy models and how it varied by seat belt use and location of impact. It was found that in frontal impact tests, seat belts reduced peak
abdominal pressure when contact was made with the steering wheel.31 In rear impact tests, seat belts reduced secondary contact with the steering wheel.31 In France, a study by
Delotte et al.39 examined injury mechanisms during crashes using a post mortem human cadaver. This study found that lap belt loading and backrest impact may result in fetal injury. Specifically, the impact of the lap belt on the pelvic bone may lead to fetal head compression and the impact of the backrest may result in increased fetal acceleration.
Computer simulations
Computational models of pregnant occupants in motor vehicle crashes derived from anthropomorphic test devices and human models have been used to investigate the
10
airbag deployment on maternal and fetal outcomes. Computer simulation studies
conducted between 2002 and 2008 by Duma et al.,32-35 Moorcroft et al.,36,37 and Manoogian et al.38 were used to predict the risk of adverse fetal outcomes from motor vehicle crashes during pregnancy. Duma et al.32,33 and Moorcroft et al.36,37 found that the risk of adverse fetal outcomes and uterine strain increased with crash speed, particularly among
unrestrained occupants. Specifically, Duma et al.32 found that at a speed of 13km/h, the estimated risk of fetal death ranged from 32% for restrained pregnant drivers to 44% for unrestrained pregnant drivers. At a higher speed of 35 km/h (approximately 22 mph), the risks of fetal death increased to 89% and 100%, respectively.32 Similarly, Moorcroft et al.37 found that at speeds of 35 km/h, the risk of serious adverse fetal outcomes exceeded 75% among unrestrained pregnant drivers. Moorcroft et al.36 further noted that uterine strain was a strong predictor of fetal injury, most likely because of placental abruption, with peak uterine strain ranging from 33% among restrained pregnant drivers with airbag deployment to approximately 61% among unrestrained drivers. In regard to maternal outcomes, the risk of abdominal injury and head trauma was the highest among unbelted drivers and lowest among restrained drivers with airbag deployment.36,37 Overall, in the computer models, 3-point belts in conjunction with airbags were the most effective for preventing maternal injury from motor vehicle crashes during pregnancy.
Case reports
11
vehicle crash during their pregnancy (Table 2.1). Among these reports, 139 women
Table 2.1. Summary of selected case reports involving a pregnant occupant in a motor vehicle crash, 1987-2009
Author, publication year
Location (# of cases)
Belt Status Airbag Status Maternal Outcomes Pregnancy Outcomes
Agran et al., 198741
California (N=9) unrestrained unknown one maternal death, maternal injuries
(face, chest, abdomen, head, knee, ribs, ankle)
placental abruption (N=9), low birth weight (N=7), fetal death (N=9, 22-39 wks), skull fracture (N=1)
Chetcuti & Levene, 198742
England (N=1) restrained unknown no maternal injury placental abruption, bradycardia
Stafford et al., 198843
Ohio (N=8) restrained
(N=2)
unknown minor maternal injuries placental abruption (N=8), skull fracture
(N=2), fetal death (N=2), infant death (N=2; 1 day)
Evrard et al., 198844
Rhode Island (N=1) restrained unknown internal hemorrhage, rib fracture, pelvic
fractures, splenic rupture, maternal death
fetal skull fracture, fetal death
Ford et al., 198945
Australia (N=1) restrained unknown ‘seat belt' and facial injuries,
hemorrhages
fetal death (30 wks)
Landers et al., 198946
Nebraska (N=1) unknown unknown pelvic fracture, uterine laceration crushed skull, fetal death
Lipton & Thomason, 199447
North Carolina (N=1)
unrestrained unknown closed head injury ectopic tubal pregnancy
van Enk & van Zwam, 199448
Netherlands (N=1) restrained unknown splenic tear uterine rupture, fetal death (32 wks)
Harrison et al., 199549
Washington (N=1) restrained unknown forehead lacerations, belt abrasions fetal death (22 wks)
Hartl & Ko, 199650
New York (N=1) unrestrained unknown no maternal injury placental abruption, fetal skull fracture
(41 wks) Dittrich,
199651
Saudi Arabia (N=1) unrestrained unknown femoral shaft fracture uterine rupture, fetal death (30 wks)
Rowe et al., 199652
Texas (N=1) restrained unknown unconscious, facial laceration,
abdominal ecchymosis
uterine rupture, placental expulsion, decapitated fetus, fetal death (22 wks) Sims et al.,
199653
Pennsylvania (N=3) restrained deployed maternal injuries (face, hand, arms) All full-term healthy births
Astarita & Feldman, 199754
California (N=1) restrained unknown abdominal pain, vaginal bleeding uterine rupture, fetal injury (abdomen,
liver, kidney, aorta, spine), fetal death (28 wks)
Matthews et al., 199755
Australia (N=1) restrained unknown pelvic fracture intracranial hemorrhage
Judich et al., 199856
Israel (N=1) unknown unknown chest and abdominal injury, maternal
death
uterine lacerations, membrane rupture, amniotic fluid embolism, fetal death (32 wks)
Schultze et al., 199857
Colorado (N=1) restrained deployed no maternal injury placental abruption, fetal death (28 wks)
Parida et al., 199958
Kentucky (N=2) restrained unknown Case 1: abdominal and thoracic
ecchymoses; Case 2: none reported
Case 1: fetal distress, preterm (31 wks), bowel injury, intraventricular
hemorrhage; Case 2: preterm (30 wks), low birth weight, bleeding, ecchymoses, intraventricular hemorrhage, renal failure, infant death (5 months) Bunai et al.,
200059
Japan (N=1) restrained unknown no maternal injury placental abruption, fetal death (24 wks)
Litmanovitz et al., 200060
Israel (N=3) unknown unknown Case 1: no maternal injury; Case 2: injury
(face, head); Case 3: facial injury
Case 1: preterm (36 wks), fetal distress; fetal intrathoracic injury; Case 2: preterm (30 wks), fetal distress; Case 3: placental abruption, preterm (29 wks), fetal distress, humerus fracture, lung contusion, hypoxic brain damage Klinich et al.,
200061
Michigan (N=16) restrained unknown maternal injury unknown
Fusco et al., 200162
New Jersey (N=1) restrained deployed scalp laceration uterine rupture, fetal skull fracture, fetal
death (39 wks) Weinberg et
al., 200163
Scotland (N=1) restrained unknown ankle fracture, subarachnoid
hemorrhage, rib fracture, lung contusions, skull fracture, cerebral edema, maternal death
uterine rupture, placental separation, fetal cervical spine fracture,
subarachnoid hemorrhage, cord contusion, fetal death (28 wks) Hnat et al.,
200364
Ohio (N=1) unknown unknown closed head injury, liver lacerations,
comatose (240 days)
healthy infant born at 37 weeks
Alley et al., 200365
Kansas (N=1) unrestrained unknown forehead abrasion, respiratory distress,
spleen laceration
placental abruption, preterm (28 wks), low birth weight, cerebral edema, infant
death (20 hours)
Rainio & Penttila, 200366
Finland (N=1) restrained un-equipped maternal injury (ribs, liver), death amniotic fluid embolism, full-term birth
(38 wks), brain damage, pneumonia, infant death
Hagmann et al., 200467
Switzerland (N=1) unrestrained unknown closed femur fracture preterm (30 wks), intracranial injuries
Karimi et al., 200468
Texas (N=1) restrained deployed abdominal bruising membrane rupture, preterm (29 wks),
hypotension, respiratory failure, brain injury, infant death
Kiryabwire et al., 200569
Australia (N=1) restrained unknown seat belt marks on the abdomen placental abruption, fetal distress,
subarachnoid hemorrhage, preterm (34 wks)
Metz & Abbott, 200670
Colorado (N=30) unrestrained
(N=15)
deployed Closed head injury (N=2), abrasions (N=5), fractures (N=4), neck strain (N=3), no injuries (N=17), abdominal contusions (N=2)
Placental abruption (N=1), bleeding (N=2), fetal death (N=1 at 28 wks)
Weir et al., 200871
Texas (N=1) restrained un-equipped abdominal ecchymosis Uterine rupture, fetal death (22 wks)
Klinich et al., 200872
Michigan (N=57) unrestrained
(N=10)
Maternal injuries: none (N=8), minor
(N=29), moderate (N=11), major (N=9). Fatalities: (N=6)
Placental abruption (N= 12), Fetal death (24-36+ wks) (N=12), preterm (N=6), fetal head injury (N=3), fetal distress, intraventricular hemorrhage
Nguyen et al., 200973
California (N=1) restrained deployed bruising (neck, abdomen) Preterm (26 wks), skull fracture, infant
death
15 Population-based studies
Only a few population-based studies have examined the association between motor vehicle crashes and fetal outcomes.3-6,22 Overall, findings from five epidemiological studies suggest that pregnant women are at increased risk of experiencing several adverse fetal outcomes after a motor vehicle crash, particularly low birth weight, preterm delivery, and fetal death (Table 2.2).
16
vehicle crashes, one study5 focused on women assessed after the crash using hospital discharge data and only captured the most severe crashes, and two studies4,6 only focused on pregnant women who were in a crash without including a non-crash comparison group.
Table 2.2. Summary of findings from five population-based studies that assessed the effect of motor vehicle crashes during pregnancy on fetal outcomes, 1993-2010.
Author, publication year Location, sample size Study Populationa
Adjustedb and Unadjusted Risk Ratio Estimates
1. Hyde et al., 20033 Utah, N=322,704
All pregnant women
Crash vs. no crash
Belted vs. no crash
Unbelted vs. no crash
Unbelted vs. belted
Preterm birth 1.02 0.94, 1.11 1.08 0.99, 1.18 1.13 0.91, 1.40 1.00 0.78, 1.29
Low birth weight 1.03 0.94, 1.14 1.06 0.95, 1.18 1.30 1.03, 1.64 1.18 0.89, 1.56
Fetal death -- -- -- -- -- -- 2.80 1.40, 5.60
2. Kvarnstrand et al., 200822 Sweden, N=1,094,559 All pregnant women Crash vs. no crash
Fetal death 3.55 2.43, 5.20
3. Schiff and Holt, 20055 Washington, N=17,889 All pregnant women hospitalized for crashes and a random sample of pregnant women not hospitalized for crash-related injuries Crash vs. no crash
Severely injured vs. no crash
Non-severely injured vs. no crash
Uninjured vs. no crash
Preterm birth 1.40 1.10, 1.90 1.60 0.80, 3.10 1.10 0.80, 1.80 1.60 1.00, 2.60
Low birth weight -- -- 1.40 0.60, 3.20 1.10 0.60, 1.80 1.80 1.00, 3.10
Fetal death -- -- 9.00 2.10,
37.10
1.30 0.20, 9.80 -- --
4. Schiff et al., 20104 Washington, N=3,348 All pregnant women in motor vehicle crashes Airbag available vs. airbag not
available
Airbag deployed vs. airbag not deployed
Preterm birth 1.10 0.80, 1.60 0.80 0.30, 1.90
Low birth weight 1.10 0.70, 1.60 0.80 0.30, 2.00
Fetal death -- -- -- -- 5. Wolf et al.,19936 Washington,
N=2,592
All pregnant women in motor vehicle crashes
Unbelted vs. belted
Low birth weight 1.90 1.20, 2.90
Fetal death 4.10 0.80, 20.30
aSchiff and Holt linked vital records to hospital discharge data, whereas the other 4 studies linked vital records to motor vehicle crash reports.
bHyde et al. adjusted for maternal age, tobacco and alcohol use, race, education, parity, prenatal care, and weight gain; Kvarnstrand et al. did not adjust for
covariates; Schiff and Holt adjusted for maternal age and tobacco use with the exception of the unadjusted relative risk estimate for fetal death comparing severely injured women to those not in a crash; Schiff et al. adjusted for maternal age, seat belt use, and vehicle model year; Wolf et al. adjusted for maternal age and gestational age at crash.
19 Seat belt studies
Seat belts are known to reduce occupant injury and death during crashes. Among pregnant women, studies have shown that seat belts are effective at reducing the risk of adverse maternal and fetal outcomes.3,6,72 However, these studies did not have data
regarding how seat belts were worn and how proper or improper use may affect the risk of these outcomes. Police reported crash records across all states lack information on proper seat belt use during pregnancy. The American College of Obstetricians and Gynecologists recommends that during pregnancy, women should wear seat belts properly by wearing a 3-point restraint, with the lap belt placed below the abdomen and the shoulder belt placed diagonally above the abdomen.74 Lap or shoulder restraints alone are not suitable. As suggested in the computational models and case reports, improper restraints can result in increased risk of uterine rupture or abdominal injuries that may further result in excessive maternal bleeding and/or fetal death. A recent case series of 57 pregnant women found that improperly restrained occupants had a higher risk of adverse fetal outcomes than properly restrained occupants.72 Using a risk curve estimated from crashes at a speed of 30 km/h, this study further estimated that there would be an 84% reduction in the risk of adverse fetal outcomes if women were properly restrained.72
Airbag studies
20
beneficial effect of airbags during pregnancy. In addition, it is unknown if airbags cause injuries during pregnancy since pregnant women may be unable to maintain the National Highway Traffic Safety Administration’s recommended 10-inch distance between
themselves and the airbag, particularly during later stages of pregnancy. A review of three case reports in Pennsylvania suggested that airbags in combination with seat belts do not increase the risk of injuries.53 In contrast, the findings from several other case reports have suggested that airbag deployment without seatbelt use may result in maternal and/or fetal injury or death.57,62,68,70,73 However, population-based studies are lacking. Only one state-based study has examined the effect of airbags on maternal and fetal outcomes.4 This study found that airbag deployment did not increase the risk of several adverse fetal outcomes in crashes during pregnancy in Washington State. Given the mixed findings from the
published case reports and the population-based study, more research is needed to quantify the effect of airbags on maternal and fetal morbidity and mortality. As a passive vehicle safety device, airbags require no behavioral adherence from drivers and passengers, and if effective, they can be important safety devices for preventing adverse outcomes from motor vehicle crashes during pregnancy, particularly in conjunction with 3-point restraints.
Motor vehicle safety interventions
Seat belt practices
21
of all reproductive-age women) report wearing seat belts.75 Several state-specific studies have been conducted to assess pregnant women’s beliefs and practices regarding seat belt use.2,75-81 Most studies found that although pregnant women report wearing belts, very few wear them properly. Women who refrain from wearing seat belts during pregnancy report that they find them uncomfortable or fear that they will cause injury to themselves or their fetus. For example, a study conducted in the early 1990s found that among 298 pregnant women in Michigan, 78% reported belt use during pregnancy.76 Among those who reported that they rarely or never use a seat belt, almost half reported that the belt was
uncomfortable, 29% never used seat belts by habit, and 16% feared hurting their fetus.76 In regard to proper belt use, at the first prenatal visit only 53% reported proper belt use, whereas 68% reported proper placement when asked at the third trimester visit.76
Another study conducted in the late 1990s assessed restraint use among 807 pregnant women in California.80 This study found that although most women (86%) reported restraint use during pregnancy, only half wore them properly. In addition, 9% believed that seat belts were harmful to their fetus.80 A third study conducted in 2001 among pregnant patients receiving care from 1 of 8 health centers in Jefferson County, Alabama, estimated a higher prevalence of reported belt use than was estimated in other studies.78 Approximately 96% of pregnant women reported that they wear seat belts, and 72% reported that they use belts properly.78 Among the women who did not always wear their seat belt, the most common reasons for underuse included discomfort (53%),
22
(12%), and fear of injury to themselves (4%).78 A second phase of this study assessed differences in restraint use and knowledge between county clinic patients and private practice patients.79 The authors found that a higher proportion of private practice patients used belts before and during pregnancy and used them correctly as compared with county clinic patients.
An Irish study assessed frequency and awareness of proper belt use among pregnant women in Northern Ireland between 2003 and 2004.77 Similar to the results from the U.S.-based studies, approximately 75% of the 154 respondents reported belt use during pregnancy while driving, and 47% reported proper belt use. One third of the women reported concerns about wearing a seat belt during pregnancy, and only 22% reported that they received belt use advice during pregnancy.
Although the reported prevalence estimates of seat belt use across several studies indicate that most pregnant women (i.e., 75% to 96%) wear seat belts during pregnancy, not all of these women (i.e., 47% to 76%) wear belts properly. In addition, among the pregnant women who reported that they rarely or never use a seat belt, a small percentage had misconceptions about the effects of belt use on themselves and their fetus. Proper education about the importance of belts and correct placement can minimize concerns and correct misconceptions that prevent women from wearing belts and can increase proper belt use. An evaluation of an educational intervention disseminated in prenatal care clinics in Alabama found that providing women with educational materials that address the
importance and proper use of seat belts resulted in increased knowledge of belt
23
placement of lap and shoulder belts.82 Earlier studies evaluating the effectiveness of educational interventions in childbirth classes and in obstetric clinics had similar
findings.80,83 One intervention resulted in increased frequency of seat belt use,83 and the other resulted in improved belt placement.80
As recommended by the American College of Obstetricians and Gynecologists, all pregnant women should receive prenatal seat belt counseling.74 However, this is usually not the case. Very few pregnant women report that they received prenatal counseling about belt use.2,75,76,78,80 A multistate study conducted across 22 states found that the prevalence of reported prenatal counseling about belt use ranged from 38% (Arkansas) to 59%
(Washington State).2 This range is consistent with the findings from several prenatal clinic-based studies. For example, in Michigan, approximately 55% of women who completed a survey at two prenatal visits (n=298) reported that they received information about belt use from their health care provider.76 In Alabama, only 37% of the 450 women who completed surveys at their prenatal visits reported that they received information on belt use during pregnancy.78 In California, even fewer women (21%) reported that they received
information on proper belt use from their health care provider.80
Additional Safety Interventions
24
particularly those targeted toward vehicle design, legislation development, and behavior modification.
Vehicle design
Existing vehicle crash protection systems can be improved for pregnant women and fetuses. The performance standards for vehicle safety designs are based on the stature and anatomy of average male drivers. As such, pregnant women may be uncomfortable with the positioning of certain vehicle devices (e.g., belts and steering wheels) and may
subsequently adjust these devices, thus putting themselves and their fetus at risk of injury. Therefore, automobile manufacturers should consider pregnant women when designing and testing vehicles and their safety devices in order to better accommodate the size and shape of these women.
25 Legislation
Although prior studies indicate that an estimated 75% to 96% of pregnant women report wearing seat belts, there are pregnant women who rarely or never wear belts. Legislative efforts to improve motor vehicle safety during pregnancy, such as primary seat belt laws, can help to ensure that pregnant women, like all occupants, are wearing their seat belts during pregnancy. In the general population, evidence from the 2009 National Occupant Protection Usage Survey shows that belt use in states with primary belt
enforcement laws (88%) is higher than belt use in states without primary belt enforcement laws (77%).85 Therefore, enforcement of mandatory belt laws and adoption of primary seat belt laws may encourage pregnant women to wear seat belts at all times.
Behavior modification
26
weather conditions, on well-maintained roads, and at average speeds in order to minimize their crash risk. Alternatively, some women may choose to reduce their driving frequency and distances during pregnancy (i.e., lowering exposure) to avoid the potential for crash involvement.
Conclusion
Although many pregnant women and their fetuses are injured in motor vehicle crashes each year in the United States, population-based research pertaining to the effect of crashes on maternal and fetal outcomes and interventions aimed towards the reduction of crashes and improved safety during pregnancy are limited. To date, only five population-based studies have examined the association between motor vehicle crashes and maternal and fetal outcomes;3-6,22 none of these studies described the circumstances surrounding the crash events. In addition, only two population-based studies3,6 have assessed the effect of seat belts, and one population-based study4 examined the effect of airbags on maternal and fetal outcomes from crashes during pregnancy. More research is needed to better
understand the circumstances surrounding crash events and the factors that contribute to crash-related maternal and fetal injuries. To facilitate this research, states should adapt pregnancy-related crash surveillance systems by utilizing probabilistic record linkage
27
been conducted in four states (North Carolina, Pennsylvania, Utah, and Washington). Collective efforts to improve surveillance systems and conduct epidemiological research can help identify pregnancy-related risk factors for maternal and fetal injuries from crashes, which will aid in developing and implementing the most effective interventions.
III. RESEARCH DESIGN & STUDY METHODS
Overview
This retrospective cohort study included three components: 1) linear risk regression to estimate the risk of being a pregnant driver in a crash after the 20th week of pregnancy and to estimate risk differences for crash determinants using linked vital records and crash reports for 878,546 pregnant NC residents, aged 16-46 years, between 2001-2008 (Specific Aim 1); 2) linear risk regression to estimate the risk of being injured in a crash and to estimate risk differences for injury risk factors using linked vital records and crash reports for 11,052 pregnant NC drivers who were in crashes after the 20th week of pregnancy (Specific Aim 2); 3) Poisson regression to estimate rate ratios for the association between crashes and adverse pregnancy outcomes using linked vital records and crash reports for 878,546 pregnant NC residents, aged 16-46 years, who completed a total of 115,797,259 pregnancy days after the 20th week (Specific Aim 3). Methods common to all components are described, followed by methods specific to each component. This study was approved by the Institutional Review Board of the University of North Carolina at Chapel Hill.
Data sources
North Carolina live birth and fetal death records
29
verified by physicians within 5-10 days of birth or death. Available birth certificates exclude special registrations (i.e. adoptions, witness protection) and available fetal death certificates exclude induced abortions and fetal deaths occurring before 20 weeks. Medical examiners certify the cause of most deaths (e.g., deaths resulting from injury, suicide, or homicide) while physicians determine the cause of death for non-medical examiner deaths. All reports are sent to the county registrar to be checked for accuracy and completeness and further information is requested if necessary. Certificates are then sent to the Department of Health and Human Services for report processing, corrections, and data entry.
A data request for identifiable live birth and fetal death records between 2001 and 2008 was approved on March 16, 2009 by Thomas Reeher, Interim State Registrar and Director of Vital Records at the NCSCHS. All approved data records (n=993,274) were provided on a compact disc by Matt Avery, Vital Statistics Supervisor, at the NCSCHS.
North Carolina police-reported motor vehicle crash reports
30
the crash.88 Within ten days of the crash investigation, all reports are provided to the DMV and staff members enter the reports into an electronic database.
A data use agreement for identifiable police-reported crash records between 2001 and 2008 was approved on May 19, 2009 by David Harkey, Director of the University of North Carolina Highway Safety Research Center (HSRC). Crash reports were linked to driver’s license records to obtain the driver’s first, middle, and last name and residential address (98.7% linked). All approved data records (n=2,058,918) were provided on a compact disc by Eric Rodgman, Senior Database Analyst, at the HSRC.
Probabilistic record linkage
Overview
31
For this study, we used probabilistic record linkage to determine whether a motor vehicle crash occurred during pregnancy in NC by linking individual vital records for
singleton deliveries among mothers aged 16-46 years (n=952,602) to state crash records for licensed female drivers aged 16-46 years (n=991,589). This linkage was performed using LinkSolv generalized linkage software (Strategic Matching Inc., Morrisonville, NY, 2009).
Probabilistic record linkage theory
The probabilistic record linkage methodology used in this study is based on the Fellegi-Sunter model89 which extends an earlier model developed by Newcombe and Kennedy.90,91 This method uses an optimal decision approach to classify record pairs as matches or non-matches by computing a cutoff threshold weight from match and non-match probabilities.89 More specifically, probabilities of agreement (i.e., m and 1-m probabilities) and disagreement (i.e., u and 1-u probabilities) are estimated for fields that are common to a pair of records. The m probability is the probability that a field agrees given that the pair of records is a true match (i.e., one minus the error rate of the field); the u probability is the probability that a field agrees given that the pair of records is not a true match (i.e., probability that the agreement occurred by chance).92-94
32
computed as: log2 (m/u) if the field agrees for a record pair; and log2 (1-m/1-u) if the field
disagrees for a record pair. Separate weights are calculated for each data value of a field. This approach assumes independence between the m probabilities and between the u probabilities. Data values from one field should not depend on the data values from another field and data errors (e.g., miscoded fields or misspelled words) should be uncorrelated.92 Weights can be adjusted to account for these dependencies.
Following the derivation of individual weights, composite match weights are computed for each record pair by summing the individual weights for all field
comparisons.94,95 A cutoff weight is computed based on the size of the data files, the expected number of matches, and the desired minimum probability of a true match.94 Linked record pairs are ranked in order of their match weights from highest to lowest and those with a match weight that is greater than the cutoff weight are classified as matches; all other record pairs are classified as non-matches. Alternatively, two cutoff values can be estimated to classify record pairs into three categories: matches, possible matches, and non-matches. This latter approach requires manual review of possible matches to determine if the record pairs are matches or non-matches.
Application of record linkage to our cohort study
Data processing
In this study, there were several steps for conducting the probabilistic record
33
data values within each dataset to ensure that common fields had similar definitions and formats. For example, we reformatted date fields (e.g., MMDDYY8.), converted numeric values to characters, compressed hyphenated fields (e.g., last names), and truncated
numeric strings (e.g., zip codes). We also examined missing and implausible values. Missing values were converted to null values.
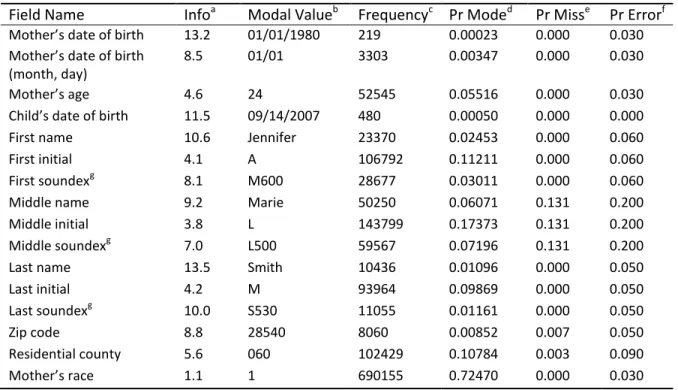
Although there were two datasets included in this study, we had to select error probabilities from one dataset in order to estimate the agreement and disagreement weights. We selected error probabilities from vital records data since they provided a better representation of our cohort of pregnant women. Error probabilities were manually updated for all fields to reflect those that were observed in a preliminary linkage of the 2001 NC vital records and crash data. Table 3.1 summarizes the fields that were obtained from the vital records data.
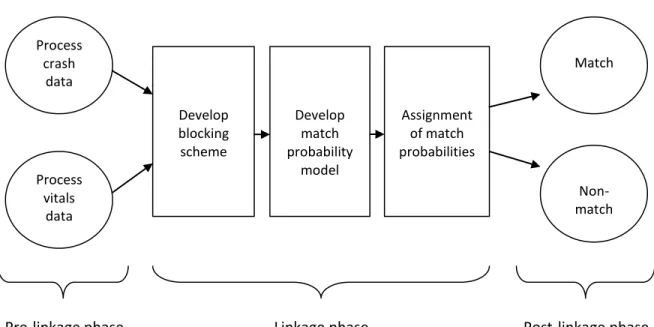
Figure 3.1. Probabilistic record linkage process
Process vitals
data Process
crash data
Linkage phase
Pre-linkage phase Post-linkage phase
Match
Non-match Develop
match probability
model Develop
blocking scheme
34
Table 3.1. Summary of vital records data fields considered for the record linkage
Field Name Infoa Modal Valueb Frequencyc Pr Moded Pr Misse Pr Errorf
Mother’s date of birth 13.2 01/01/1980 219 0.00023 0.000 0.030
Mother’s date of birth (month, day)
8.5 01/01 3303 0.00347 0.000 0.030
Mother’s age 4.6 24 52545 0.05516 0.000 0.030
Child’s date of birth 11.5 09/14/2007 480 0.00050 0.000 0.000
First name 10.6 Jennifer 23370 0.02453 0.000 0.060
First initial 4.1 A 106792 0.11211 0.000 0.060
First soundexg 8.1 M600 28677 0.03011 0.000 0.060
Middle name 9.2 Marie 50250 0.06071 0.131 0.200
Middle initial 3.8 L 143799 0.17373 0.131 0.200
Middle soundexg 7.0 L500 59567 0.07196 0.131 0.200
Last name 13.5 Smith 10436 0.01096 0.000 0.050
Last initial 4.2 M 93964 0.09869 0.000 0.050
Last soundexg 10.0 S530 11055 0.01161 0.000 0.050
Zip code 8.8 28540 8060 0.00852 0.007 0.050
Residential county 5.6 060 102429 0.10784 0.003 0.090
Mother’s race 1.1 1 690155 0.72470 0.000 0.030
Abbreviations: Pr, probability
a Measure of the field’s ability to identify a true match b,c
Most common data value (i.e., modal value) and its relative frequency
d
Probability of observing the modal value
e Probability of missing data values within the field
f Probability of erroneous data values within the field (i.e., probability of disagreement given two records
match)
g Soundex is a phonetic algorithm for indexing names by sound (i.e., first letter of the name followed by 3
numeric digits)3
Blocking field selection
35
blocking field. In this study, we chose three pairs of blocking fields, including: 1) mother’s date of birth (i.e., full date) and county of residence; 2) mother’s date of birth (i.e., month, day) and mother’s last name (i.e., soundex); and 3) mother’s first name and county of residence. We selected these pairs of blocking fields because they had low error
probabilities (i.e., high weights) and could provide a substantial amount of information for identifying a true match. Since a record pair that disagreed on a particular block would automatically be considered a non-match, we chose more than one pair of blocking fields. Three record blocking passes were selected to allow a record pair to rematch on a
subsequent block if it did not agree on the blocking requirements for other passes. Multiple passes minimized the occurrence of false non-matches.
Matching field selection
36
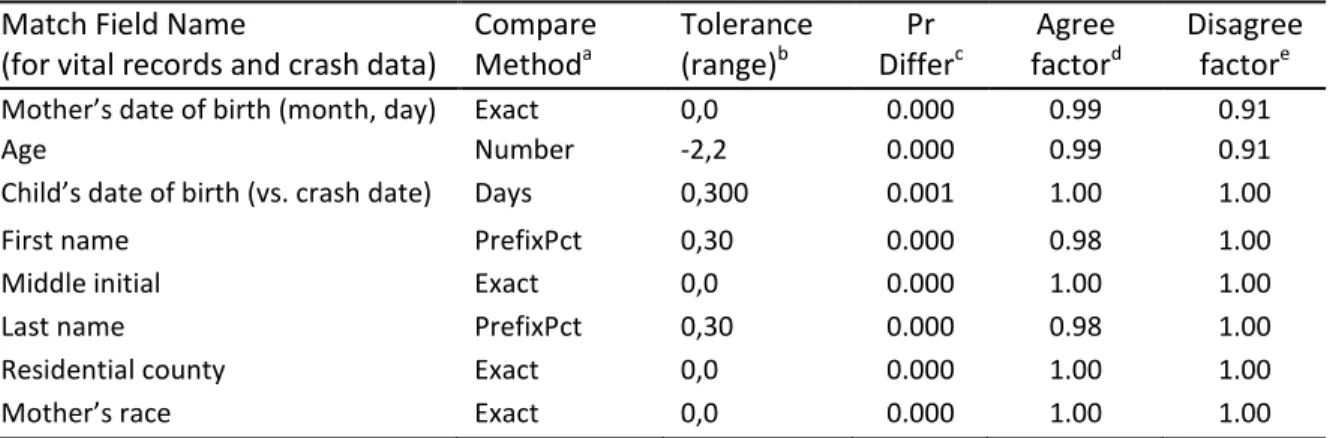
In this linkage, we controlled for dependencies between the match fields by multiplying match weights by an agreement or disagreement factor (Table 3.2). For example, the agreement and disagreement for mother’s age and for the month and day of birth depend on the mother’s date of birth being coded correctly. If this date was recorded incorrectly, then mother’s age, month and day of birth would also be incorrect. Therefore, we adjusted the disagreement weight for mother’s date of birth by a factor of 0.91 to account for possible recording errors in this field. We also adjusted the agreement weights for child’s date of birth (i.e., month, day), mother’s age, first name, and last name. All agreement and disagreement factors were obtained from the outcome tests conducted on a preliminary linkage of the 2001 NC vital records and crash data.
Table 3.2. Summary of match field specifications for comparing vital records and crash data
Match Field Name
(for vital records and crash data)
Compare Methoda Tolerance (range)b Pr Differc Agree factord Disagree factore
Mother’s date of birth (month, day) Exact 0,0 0.000 0.99 0.91
Age Number -2,2 0.000 0.99 0.91
Child’s date of birth (vs. crash date) Days 0,300 0.001 1.00 1.00
First name PrefixPct 0,30 0.000 0.98 1.00
Middle initial Exact 0,0 0.000 1.00 1.00
Last name PrefixPct 0,30 0.000 0.98 1.00
Residential county Exact 0,0 0.000 1.00 1.00
Mother’s race Exact 0,0 0.000 1.00 1.00
Abbreviations: Pr, probability
a
Method of comparison for match fields
b Range of error tolerated within the data values of a match field c
Probability that data values will differ given that they are coded correctly
d
Agreement adjustment for match weights to account for dependencies
37 Assignment of match probabilities
In the final steps of the linkage, we estimated match probabilities and weights in order to classify record pairs as matches or non-matches. We estimated m probabilities for each field by subtracting the estimated error rates from 1. These error rates were based on a preliminary linkage of the 2001 NC vital records and crash data. Fields with data values that were allowed to differ (e.g., mother’s age, child’s date of birth, mother’s first and last name) were more likely to agree than those that had to match exactly (e.g., mother’s date of birth, middle initial, county, and race). The u probabilities were computed by the software which multiplied the relative frequency of each field’s data values across both datasets. Frequent values resulted in higher u probabilities while less frequent values resulted in lower u probabilities. For each field, individual weights were estimated as log likelihood ratios of
the agreement and disagreement probabilities while adjusting for dependencies. These weights were summed to compute composite match weights for each record pair.
38 Post-linkage assessment
After the linkage was completed, we determined if the crash occurred during pregnancy by comparing the date of the last menstrual period (LMP) to the date of the crash to ensure that no more than the total number of weeks of gestational age at delivery elapsed between the date of LMP and the crash event. If the date of LMP was missing or provided an implausible gestational age based on weeks of gestation and birth weight, the clinical estimate of gestational age was used (n=51,593 or 5.2%). If the date of LMP and the clinical estimate of gestational age were both missing, the physician’s estimate of
gestational age (i.e., gestational age estimated from pregnancy history, early ultrasound, or examination of the stillborn infant), if known, was used, but only for fetal deaths (n=531, <0.1%). If all values were missing, then gestational age was considered missing and crash involvement could not be determined (n=481, <0.1%). There were 26,913 linked vital records and crash reports for drivers who were pregnant at the time of the crash.
Measures
Motor vehicle crashes and crash severity
39
impact, and damage location.96 Severity ratings ranged from 0 (no damage) to 7 (severe damage). Serious or severe crashes were defined as those with a vehicle damage rating of at least 3 (i.e., crashes that resulted in more than minor dents or gouges, such as crumpling of vehicle body sheet metal and/or deformation of the structure or frame).
Maternal Injury
Maternal injury was defined as an injury to a pregnant driver due to a crash, as reported by the investigating police officer at the scene. Using a five-point scale (i.e., KABCO),97 this outcome was classified as no injury, possible injury (i.e. no visible injury, but person complains of pain, or has been momentarily unconscious), non-disabling injury (i.e. obvious injury, such as bruises, swelling, and soreness, that is not serious enough to prevent the person from engaging in normal activities), disabling injury (i.e. obvious injury, such as massive blood loss, fractures, unconsciousness, that prevents the person from engaging in normal activities for at least one day post-collision), or fatality. Crash-related deaths included those that occurred at the time of the crash and up to one year after the crash.
Gestational age
There are two measures of gestational age in the live birth records and three measures in the fetal death records, including the self-reported date of LMP, the clinical estimate (i.e., gestational age estimated from ultrasound or other techniques), and the physician’s estimate (i.e., gestational age estimated from pregnancy history, early
40
records. For this study, we estimated gestational age using the same method that is used by the National Center for Health Statistics for estimating gestational age in U.S. vital statistics.98,99 This methodology relies primarily on LMP-based estimates with replacement of unreasonable values (i.e., estimates that are implausible when considering birth weight) or missing values by clinical or physician’s estimates. Detailed information about the estimation of gestational age is described on page 38.
Fetal outcomes
Preterm birth was defined as a live birth that occurred between 20 and 37 weeks of gestation. Live births occurring before the 20th week of gestation (n=455) were excluded from this study. Stillbirth was defined as an intrauterine death that occurred after the 20th week of gestation. Stillbirths occurring prior to the 20th week of gestation are not reported in NC vital records.
Obstetric conditions
Obstetric complications, as recorded on the live birth and fetal death certificates, were placental abruption (i.e., separation of the placenta from the uterus during pregnancy) and premature rupture of the membranes (PROM) (i.e., spontaneous rupture of the
41 Additional covariates
Based on a directed acyclic graph (DAG) representing our review of the
literature,3,5,100 several covariates were selected for examination (Table A.1). Covariates obtained from the live birth and fetal death certificates consisted of gestational age, maternal age, maternal race, Hispanic ethnicity, maternal education, marital status, prenatal tobacco use, prenatal alcohol use, prenatal care initiation, and parity (defined as the total number of live births including the index birth). Maternal race and Hispanic ethnicity were combined into one measure with four categories, including non-Hispanic (NH) white, NH black, other NH race (i.e., American Indian, Asian, Pacific Islander), and Hispanic. Variable specifications for vital records data are provided in Table 3.3.
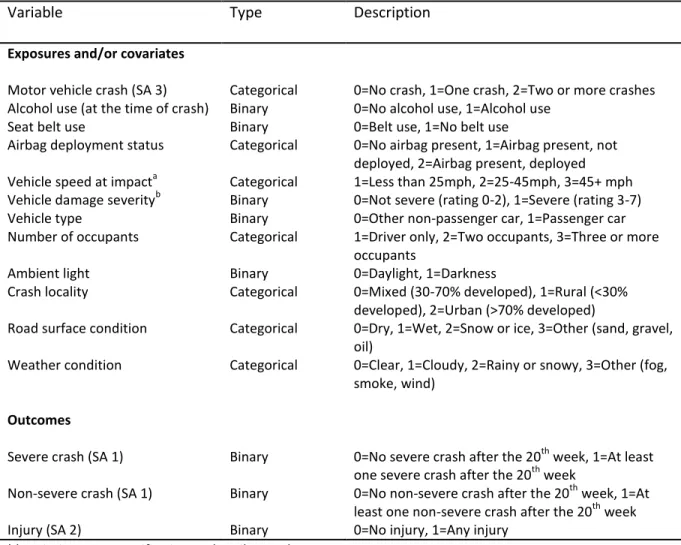
The potential risk factors obtained from the motor vehicle crash reports consisted of crash-specific driver characteristics (i.e., suspected alcohol use at the time of the crash, seat belt use), vehicle characteristics (i.e., airbag deployment, estimated vehicle speed at impact, vehicle damage severity, vehicle type, number of occupants), and environmental
42
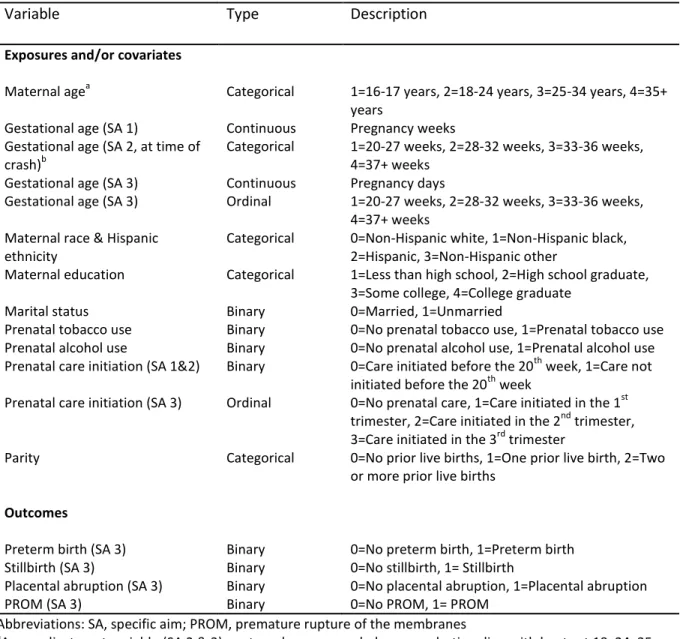
Table 3.3. Variable specifications for vital records data
Variable Type Description
Exposures and/or covariates
Maternal agea Categorical 1=16-17 years, 2=18-24 years, 3=25-34 years, 4=35+
years
Gestational age (SA 1) Continuous Pregnancy weeks
Gestational age (SA 2, at time of crash)b
Categorical 1=20-27 weeks, 2=28-32 weeks, 3=33-36 weeks,
4=37+ weeks
Gestational age (SA 3) Continuous Pregnancy days
Gestational age (SA 3) Ordinal 1=20-27 weeks, 2=28-32 weeks, 3=33-36 weeks,
4=37+ weeks Maternal race & Hispanic
ethnicity
Categorical 0=Non-Hispanic white, 1=Non-Hispanic black,
2=Hispanic, 3=Non-Hispanic other
Maternal education Categorical 1=Less than high school, 2=High school graduate,
3=Some college, 4=College graduate
Marital status Binary 0=Married, 1=Unmarried
Prenatal tobacco use Binary 0=No prenatal tobacco use, 1=Prenatal tobacco use
Prenatal alcohol use Binary 0=No prenatal alcohol use, 1=Prenatal alcohol use
Prenatal care initiation (SA 1&2) Binary 0=Care initiated before the 20th week, 1=Care not initiated before the 20th week
Prenatal care initiation (SA 3) Ordinal 0=No prenatal care, 1=Care initiated in the 1st trimester, 2=Care initiated in the 2nd trimester, 3=Care initiated in the 3rd trimester
Parity Categorical 0=No prior live births, 1=One prior live birth, 2=Two
or more prior live births
Outcomes
Preterm birth (SA 3) Binary 0=No preterm birth, 1=Preterm birth
Stillbirth (SA 3) Binary 0=No stillbirth, 1= Stillbirth
Placental abruption (SA 3) Binary 0=No placental abruption, 1=Placental abruption
PROM (SA 3) Binary 0=No PROM, 1= PROM
Abbreviations: SA, specific aim; PROM, premature rupture of the membranes
a
As an adjustment variable (SA 2 & 3), maternal age was coded as a quadratic spline with knots at 18, 24, 35
b
43
Table 3.4. Variable specifications for crash records data
Variable Type Description
Exposures and/or covariates
Motor vehicle crash (SA 3) Categorical 0=No crash, 1=One crash, 2=Two or more crashes
Alcohol use (at the time of crash) Binary 0=No alcohol use, 1=Alcohol use
Seat belt use Binary 0=Belt use, 1=No belt use
Airbag deployment status Categorical 0=No airbag present, 1=Airbag present, not
deployed, 2=Airbag present, deployed
Vehicle speed at impacta Categorical 1=Less than 25mph, 2=25-45mph, 3=45+ mph
Vehicle damage severityb Binary 0=Not severe (rating 0-2), 1=Severe (rating 3-7)
Vehicle type Binary 0=Other non-passenger car, 1=Passenger car
Number of occupants Categorical 1=Driver only, 2=Two occupants, 3=Three or more
occupants
Ambient light Binary 0=Daylight, 1=Darkness
Crash locality Categorical 0=Mixed (30-70% developed), 1=Rural (<30%
developed), 2=Urban (>70% developed)
Road surface condition Categorical 0=Dry, 1=Wet, 2=Snow or ice, 3=Other (sand, gravel,
oil)
Weather condition Categorical 0=Clear, 1=Cloudy, 2=Rainy or snowy, 3=Other (fog,
smoke, wind)
Outcomes
Severe crash (SA 1) Binary 0=No severe crash after the 20th week, 1=At least
one severe crash after the 20th week
Non-severe crash (SA 1) Binary 0=No non-severe crash after the 20th week, 1=At
least one non-severe crash after the 20th week
Injury (SA 2) Binary 0=No injury, 1=Any injury
Abbreviations: SA, specific aim; mph, miles per hour
a
As an adjustment variable (SA 2), speed was coded as a quadratic spline with knots at 25, 45, 65
b
44 Statistical analysis for specific aims
Specific Aim 1
Study population
The study population was comprised of 878,546 pregnant NC residents, aged 16-46 years, who reached the 20th week of pregnancy and completed their pregnancy between January 1, 2001 and December 31, 2008 (Figure 3.2). They were identified from live birth and fetal death records that were obtained from the NCSCHS (n=993,274). These records excluded live births resulting in special registration (i.e., adoption, witness protection) and fetal deaths from induced abortions (<1% of all records) and those occurring before 20 weeks. We removed women aged less than 16 years at the time of delivery (n=7,075) because driver crashes in this pre-licensure age group are rare. In addition, we excluded women older than 46 years at delivery (n=237) and those with multiple gestation
pregnancies (n=33,360) since advanced maternal age and multifetal gestation status are associated with a greater risk of adverse pregnancy outcomes.
We also excluded records if there were missing data for one or more of the following: gestational age at delivery (n=481), plurality (n=91), or mother’s age (n=73).
45
Figure 3.2. Flow chart to estimate the number of pregnant drivers who were in severe or non-severe motor vehicle crashes after the 20th week of pregnancy in North Carolina, 2001-2008
952,602
Pregnant women, ages 16-46 (singleton gestations)
993,274
Pregnant women (all ages, singleton and multiple gestations)
Cohort exclusions: • Delivered before the 20th week (n=455)
• Completed ≥ 20 weeks on 1/1/01 (n=40,014) • <16 yrs after the 20th week
(n=3,093) •Conception <45 weeks before 1/1/09 (n=14,032) •Not a NC resident (n=17,151)
Crash exclusions:
• Duplicate records (n=103) • Motorcycle events (n=9) • Unknown vehicle types (n=34)
2,058,918
Motor vehicle crashes among licensed drivers (both sexes), ages 16-46
991,589
Motor vehicle crashes among licensed female drivers, ages 16-46
26,913 Linked pregnant
driver crashes 878,546
Pregnant NC residents, ages 16-46
25,168
Pregnant women involved as drivers in at least one crash
14,448 Pregnant drivers in ≥1 crash before the 20th week
7,936
Pregnant drivers in ≥1 non-severe crash
3,217
Pregnant drivers in ≥1 serious or severe crash 853,378
Pregnant women not involved as drivers in a crash
11,087 Pregnant drivers in ≥1 crash after the 20th week