MATHEMATICAL MODELING OF
CLOSTRIDIUM DIFFICILE
TRANSMISSION IN HEALTHCARE SETTINGS
Eric T. Lofgren, MSPH
A dissertation submitted to the faculty of the University of North Carolina at Chapel Hill in partial fulfillment of the requirements for the degree of Doctor of Philosophy
in the UNC Gillings School of Global Public Health (Epidemiology).
Chapel Hill 2013
Approved by:
David J. Weber, MD, MPH Stephen R. Cole, MPH, PhD Nina H. Fefferman, PhD William A. Rutala, PhD Annelies Van Rie, MD, PhD
© 2013
Eric T. Lofgren, MSPH ALL RIGHTS RESERVED
Abstract
ERIC T. LOFGREN: Mathematical Modeling of Clostridium difficile Transmission in Healthcare Settings
(Under the direction of Dr. David J. Weber)
Clostridium difficile is a frequent source of healthcare-‐associated infection, especially among patients on antibiotics or proton pump inhibitors (PPIs). The rate of C. difficile infection (CDI) has been steadily rising since 2000 and now represents a major burden on the healthcare system in terms of both morbidity and mortality. However, despite its public health importance, there are few mathematical models of C. difficile which might be used to evaluate our current evidence base or new control measures.
Three different data sources were analyzed to provide parameters for a mathematical model: a cohort of incident CDI cases in the Duke Infection Control Outreach Network (DICON), a hospital-‐level surveillance time series, also from DICON, and inpatient records from UNC Healthcare, all from 7/1/2009 to
were created to evaluate the potential effect of the use of fecal transplantation as a treatment to prevent CDI.
The analysis of the cohort of incident cases suggested that ICU patients experience a greater burden of mortality while infected with C. difficile and have longer lengths of stay and times until death, suggesting this population as one of special interest. Two interventions were simulated using the stochastic model: the use of fecal transplantation to treat CDI and prevent recurrent cases and the use of fecal transplantation after treatment with antibiotics or PPIs to prevent the
development of CDI. Simulation results showed that treating patients with CDI was effective in preventing recurrence but not in reducing the overall number of
incident cases of CDI. Transplantation after treatment with antibiotics or PPIs had no effect on preventing recurrence and a statistically significant reduction in incident cases that did not reach clinical significance.
These results suggest that routine fecal transplantation for patients with CDI may be an effective treatment to prevent recurrence. Mathematical models such as the one described in this dissertation are powerful tools to evaluate potential interventions, suggest new directions for study, and understand the dynamics of infection on a population level.
Acknowledgements
I would like to gratefully acknowledge the guidance, support and encouragement of my doctoral advisor, David Weber, and the members of my committee during my time at UNC, as well as Nina Fefferman for her continued mentorship and collaboration, and for logging many miles between North Carolina, Washington, D.C. and New Jersey while on my committee.
My gratitude extends to Deverick Anderson and Rebekah Moehring at DICON for their enthusiasm and willingness to provide both data and clinical expertise, to Jane Smith for references and advice about intensive care nursing and to my friends at UNC for many hours of mutual support, complaining and insightful discussions in the student room.
This dissertation would not have been possible without funding from the Merck Investigator Initiated Studies Program, the North Carolina Translational and Clinical Sciences Institute (UL1RR025747), the PiCloud Academic Research Program, and NIH Training Grant 2T32A1070114 through the Department of Epidemiology.
Finally, I would like to thank the makers of Dr. Pepper and those members of the StackOverflow and CrossValidated communities for their invaluable assistance in many a late-‐night coding session.
To my parents, for teaching me to ask questions, and to Jessica for seeing this through with patience, love and understanding.
Table of Contents
LIST OF TABLES ... X
LIST OF FIGURES ... XI
LIST OF ABBREVIATIONS ... XIII
CHAPTER 1: BACKGROUND AND SPECIFIC AIMS ... 1
AIM 1 ... 3
AIM 2 ... 4
AIM 3 ... 5
CHAPTER 2: THE USE OF MATHEMATICAL MODELS TO STUDY
HEALTHCARE-‐ASSOCIATED INFECTION ... 7
MODEL STRUCTURE AND COMPOSITION ... 8
Deterministic Compartmental Models ... 8
Stochastic Compartmental Models ... 11
Network and Agent-‐based Models ... 13
Meta-‐Population Models ... 16
MODELING C. DIFFICILE TRANSMISSION ... 16
FURTHER DIRECTIONS ... 20
CHAPTER 3: DATA SOURCES ... 23
INDIVIDUAL LEVEL C. DIFFICILE COHORT ... 23
HOSPITAL LEVEL C. DIFFICILE SURVEILLANCE ... 24
NON-‐CDI PATIENT DATA ... 24
CHAPTER 4: ESTIMATING ALL-‐CAUSE MORTALITY AND LENGTH OF STAY IN INCIDENT, HEALTHCARE FACILITY-‐ASSOCIATED CLOSTRIDIUM DIFFICILE
CASES USING PARAMETRIC MIXTURE MODELS ... 26
INTRODUCTION ... 26
MATERIALS AND METHODS ... 28
Study Population ... 28
Survival Times and Outcomes ... 28
Exposure Definition and Covariate Selection ... 29
Parametric Mixture Model ... 30
RESULTS ... 32
Parametric Survival Models ... 33
DISCUSSION ... 34
CHAPTER 5: A MATHEMATICAL MODEL TO EVALUATE THE ROUTINE USE OF FECAL TRANSPLANTATION TO PREVENT INCIDENT AND RECURRENT CLOSTRIDIUM
DIFFICILE INFECTION ... 44
INTRODUCTION ... 44
METHODS ... 45
Data Sources ... 46
Transmission Model ... 46
Parameterization and Model Calibration ... 49
Simulations ... 51
RESULTS ... 52
DISCUSSION ... 54
CHAPTER 6: CONCLUSIONS AND FUTURE DIRECTIONS ... 65
KEY FINDINGS ... 66
Mathematical Models of Routine Fecal Transplantation ... 67
STRENGTHS AND LIMITATIONS ... 68
FUTURE RESEARCH ... 69
APPENDIX: MODEL PARAMETERIZATION ... 72
DISCHARGE RATES ... 72
CONTACT RATE ... 74
HANDWASHING RATE ... 74
PROBABILITY OF CONTAMINATION OF STAFF HANDS BY COLONIZED
PATIENT OF TYPE I ... 76
PROBABILITY OF CONTAMINATION OF STAFF HANDS BY COLONIZED
PATIENT OF TYPE I ... 77
DURATION OF HIGH RISK TREATMENT ... 77
PROPORTION OF ADMITTED PATIENTS WHO ARE OF
PATIENT TYPE I ... 78
RELATIVE RISK OF CDI FOR PATIENTS ON FLUOROQUINOLONE
AND PPIS ... 79
HAZARD OF DEVELOPING CDI IN LOW-‐RISK PATIENTS ... 79
PROBABILITY OF A DISCHARGED PATIENT DEVELOPING RECURRENCE ... 80
PROBABILITY OF FECAL TRANSPLANT IN MOVING PATIENT TO
LOW-‐RISK CATEGORY ... 81
REFERENCES . ... 87
List of Tables
TABLE 2-‐1. KEY MATHEMATICAL MODELING PAPERS FOCUSING ON
HEALTHCARE-‐ASSOCIATED CLOSTRIDIUM DIFFICILE TRANSMISSION. ... 22
TABLE 3-‐1. DRUG PRESCRIPTIONS FOR UNC HEALTHCARE SYSTEM INPATIENTS
FLAGGED AS HIGH-‐RISK FOR DEVELOPMENT OF CLOSTRIDIUM DIFFICILE INFECTION ... 25
TABLE 4-‐1. BASELINE CHARACTERISTICS OF 609 INCIDENT CLOSTRIDIUM DIFFICILE
INFECTION CASES WITHIN THE DICON HOSPITAL NETWORK,
SOUTHEASTERN USA, 2009-‐2010. ... 38
TABLE 4-‐2. ASSOCIATION BETWEEN PATIENT-‐LEVEL COVARIATES AND TIME
UNTIL DEATH OR DISCHARGE IN A COHORT OF 609 INCIDENT CLOSTRIDIUM DIFFICILE
INFECTION CASES WITHIN THE DICON HOSPITAL NETWORK,
SOUTHEASTERN USA, 2009-‐2010. ... 40
TABLE 4-‐3. DIFFERENCE IN ESTIMATES FROM MULTIPLE-‐IMPUTATION VERSUS COMPLETE
CASES ANALYSIS FOR TIME UNTIL DEATH, DISCHARGE, AND MIXING ODDS RATIO
COMPARING ICU PATIENTS TO NON-‐ICU PATIENTS FROM A COHORT OF 609 INCIDENT
CLOSTRIDUM DIFFICILE INFECTION CASES WITHIN THE DICON HOSPITAL NETWORK,
SOUTHEASTERN USA, 2009-‐2010. ... 42
TABLE 4-‐4. ESTIMATES OBTAINED FOR TIME UNTIL DEATH, DISCHARGE, AND MIXING ODDS
RATIO COMPARING ICU PATIENTS TO NON-‐ICU PATIENTS FROM A COHORT OF 609 INCIDENT CLOSTRIDUM DIFFICILE INFECTION CASES WITHIN THE DICON
HOSPITAL NETWORK, SOUTHEASTERN USA, 2009-‐2010. ... 43
TABLE 5-‐1. PARAMETERS FOR A MATHEMATICAL MODEL OF THE USE OF FECAL
TRANSPLANTATION TO PREVENT CLOSTRIDIUM DIFFICILE INFECTION AND RECURRENCE ... 59
TABLE 5-‐2. PATIENT OUTCOMES FROM A MATHEMATICAL MODEL OF THE USE
OF FECAL TRANSPLANTATION TO PREVENT CLOSTRIDIUM DIFFICILE INFECTION AND
RECURRENCE ... 60
List of Figures
FIGURE 1-‐1. DISCHARGE RATE FOR C. DIFFICILE-‐ASSOCIATED DISEASE PER 1,000
HOSPITAL DISCHARGES, 1997-‐2009. ... 6
FIGURE 2-‐1. FLOW DIAGRAM FOR ROSS-‐MACDONALD-‐STYLE HEALTHCARE-‐ASSOCIATED
INFECTION MODEL. ... 21
FIGURE 3-‐1. CDC/NHSN TIMELINE-‐BASED C. DIFFICILE SURVEILLANCE DEFINITIONS. ... 25
FIGURE 4-‐1. DIAGRAM OF SURVIVAL TIMES AND OUTCOMES FOR A 20% RANDOM SAMPLE OF A COHORT OF 609 INCIDENT CLOSTRIDIUM DIFFICILE INFECTION CASES WITHIN
THE DICON HOSPITAL NETWORK, SOUTHEASTERN USA, 2009-‐2010.. ... 39
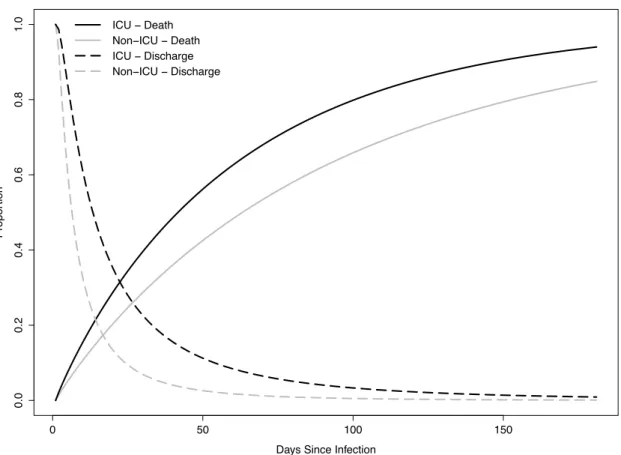
FIGURE 4-‐2. CAUSE-‐SPECIFIC PARAMETRIC SURVIVAL CURVES FOR TIME UNTIL DEATH (A) AND TIME UNTIL DISCHARGE (B) BY ICU-‐EXPOSURE STATUS IN A COHORT OF 609 INCIDENT CLOSTRIDIUM DIFFICILE INFECTION CASES WITHIN THE
DICON HOSPITAL NETWORK, SOUTHEASTERN USA, 2009-‐2010. ... 41
FIGURE 4-‐3. TIMES TO DEATH AND DISCHARGE ESTIMATED USING PARAMETRIC MIXTURE MODELS IN A COHORT OF 609 INCIDENT CLOSTRIDIUM DIFFICILE INFECTION
CASES WITHIN THE DICON HOSPITAL NETWORK, SOUTHEASTERN USA, 2009-‐2010. ... 42
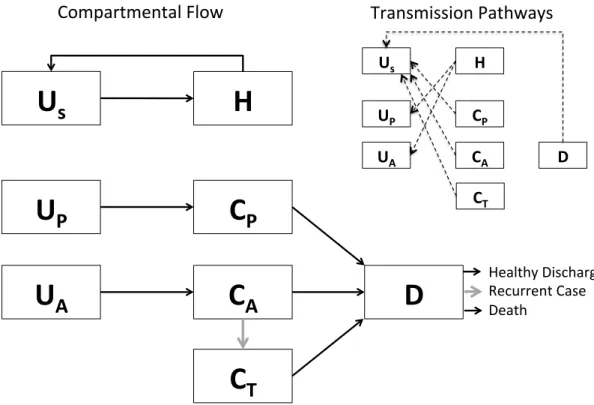
FIGURE 5-‐1. SCHEMATIC REPRESENTATION OF THE COMPARTMENTAL FLOW OF A
MATHEMATICAL MODEL OF THE USE OF FECAL TRANSPLANTATION TO PREVENT
INCIDENT AND RECURRENT C. DIFFICILE. ... 55
FIGURE 5-‐2. A SINGLE STOCHASTIC REALIZATION OF A MODEL A MATHEMATICAL MODEL OF THE USE OF FECAL TRANSPLANTATION TO PREVENT INCIDENT AND
RECURRENT C. DIFFICILE.. ... 61
FIGURE 5-‐3. SIMULATED RECURRENT AND INCIDENT CASES OF C. DIFFICILE UNDER SIX LEVELS OF POST-‐INFECTION FECAL TRANSPLANTATION TO PREVENT THE DEVELOPMENT
OF RECURRENCE. ... 62
FIGURE 5-‐4. SIMULATED RECURRENT AND INCIDENT CASES OF C. DIFFICILE UNDER SIX LEVELS
OF POST-‐TREATMENT FECAL TRANSPLANTATION TO PREVENT THE DEVELOPMENT OF INFECTION AND RECURRENCE AMONG PATIENTS ON ANTIBIOTICS OR PROTON
PUMP INHIBITORS. ... 63
FIGURE 5-‐5. SIMULATED RECURRENT AND INCIDENT CASES OF C. DIFFICILE UNDER SIX LEVELS OF COMBINED POST-‐TREATMENT FECAL TRANSPLANTATION TO PREVENT THE DEVELOPMENT OF INFECTION AND RECURRENCE AMONG PATIENTS ON ANTIBIOTICS OR PROTON PUMP INHIBITORS AND POST-‐INFECTION FECAL TRANSPLANTATION TO
PREVENT THE DEVELOPMENT OF RECURRENCE.. ... 64
FIGURE A-‐1. COMPARISON OF DENSITY FUNCTIONS AND SURVIVAL CURVES FOR AN EMPIRICALLY ESTIMATED LOG-‐NORMAL LENGTH OF STAY FOR HIGH-‐RISK
PATIENTS WITHOUT CDI AND A CORRESPONDING APPROXIMATE GAMMA DISTRIBUTION. ... 82
FIGURE A-‐2. COMPARISON OF DENSITY FUNCTIONS AND SURVIVAL CURVES FOR AN
EMPIRICALLY ESTIMATED LOG-‐NORMAL LENGTH OF STAY FOR LOW-‐RISK PATIENTS
FIGURE A-‐3. COMPARISON OF DENSITY FUNCTIONS AND SURVIVAL CURVES FOR AN EMPIRICALLY ESTIMATED LOG-‐NORMAL TIME UNTIL DISCHARGE FOR PATIENTS
WITH CDI AND A CORRESPONDING APPROXIMATE GAMMA DISTRIBUTION. ... 84
FIGURE A-‐4. COMPARISON OF DENSITY FUNCTIONS AND SURVIVAL CURVES FOR AN EMPIRICALLY ESTIMATED WEIBULL TIME UNTIL DEATH FOR PATIENTS
WITH CDI AND A CORRESPONDING EXPONENTIAL FIT. ... 85
FIGURE A-‐5. COMPARISON OF WEEKLY WEIGHTED CUMULATIVE CDI INCIDENCE TIME SERIES FROM 31 HOSPITALS IN THE DUKE INFECTION CONTROL OUTREACH
NETWORK, AND THE PREDICTED CUMULATIVE INCIDENCE OBTAINED BY FITTING
A DETERMINISTIC MODEL OF C. DIFFICILE TRANSMISSION TO THIS DATA ... 86
List of Abbreviations
CDI Clostridium difficile infection CDC Centers for Disease Control
DICON Duke Infection Control Outreach Network FMT Fecal Microbiota Transplantation
HAI Healthcare associated infection HCP Healthcare personnel
HR Hazard ratio ICU Intensive care unit
MCMC Markov Chain Monte Carlo
MRSA Methicillin-‐resistant Staphylococcus aureus OR Odds ratio
PCR Polymerase chain reaction PPI Proton pump inhibitor RT Relative time
UNC University of North Carolina VRE Vancomycin-‐resistant enterococci 95% CI 95% Confidence Interval
Chapter 1: Background and Specific Aims
Clostridium difficile is a frequent source of healthcare-‐associated infection (HAI), especially among patients on prolonged antibiotic treatment regimens or other conditions involving the disruption of normal gut flora. C. difficile is the most commonly recognized etiological agent for healthcare-‐associated diarrhea, and consequences of infection range from uncomplicated diarrhea to colitis and death. C. difficile infection (CDI) is also a problem of growing importance. The appearance and spread of a relatively rare strain identified as group BI by restriction
endonuclease analysis, ribotype 027 by polymerase chain reaction, and North
American pulse-‐field gel electrophoresis type 1 – often abbreviated as BI/NAP1/027 in Canada and soon after the U.S. and Europe, beginning in 2000 has been associated with a marked increase in CDI cases in these areas. The BI/NAP1/027 strain is characterized by a high mortality rate, which may be the result of increased virulence, increased antibiotic resistance, or both1-‐3.
Rates of CDI-‐related hospitalizations and fatalities have been steadily rising (Figure 1-‐1). In a recent report4, CDI eclipsed methicillin-‐resistant Staphylococcus
group of hospitals (Moehring et al, unpublished) found no evidence of a continued increase in the 2009 to 2010 period, infection rates remain elevated.
Beyond the burden of morbidity and mortality, CDI represents a significant drain on the healthcare resources of the United States and abroad. In 2009, there were an estimated 336,565 cases in the United States based on discharge data from the Nationwide Inpatient Sample (NIS) from the Healthcare Cost and Utilization Project (HCUP), Agency for Healthcare Research and Quality. Recent estimates place the cost of a single C. difficile infection at $2,000 per case for mild and
uncomplicated cases to upwards of $90,000 in the most severe cases5,6, with an
estimated total burden on the U.S. healthcare system of over $500,000,000.
Many problems in hospital infection control are difficult to study empirically, for both practical and methodological reasons. As the purpose of a hospital is to treat, rather than study, patients, interventions to halt the spread of an infection are not done in a stepwise fashion, trying each potential intervention in turn. Instead, they are often deployed as a “bundle” of interventions, and once the spread of infection has been eliminated or lessened, we are left only with knowing that some component or components of that bundle were successful.
independent of the disease status of another – indeed an infected patient acts as the source of exposure for a currently uninfected patient (dependent happenings).
These problems may be addressed with the use of mathematical models, which model the theoretical process by which infection is translated from one patient to another. These serve as virtual, quantitative environments within which controlled, repeatable experiments can be conducted. However, these models are not without their own assumptions. This dissertation seeks to compose a rigorous mathematical model of C. difficile transmission within a healthcare setting and provide a systematic evaluation of some of those assumptions within the context of hospital infection control.
Aim 1: The elucidation of the parameter estimates governing models of C.
difficile transmission.
Aim 1a: Estimation of incidence, time until death and time until discharge from cohort and surveillance time-‐series data obtained from the Duke Infection Control Outreach Network (DICON).
Rationale: In order to comprehensively compare different model types, a set of validly estimated parameters that will be used throughout the analysis must first be obtained. This aim provides as many parameter estimates as possible using modern epidemiological methods.
Aim 2: Comparison of parameter estimation methods and sources of between-‐
and within-‐model sources of uncertainty.
Aim 2a. Comparison of the estimates obtained from fitting a deterministic compartmental model to an incidence time series to an approach directly linking an incidence estimate from a regression model to the corresponding parameter within the mathematical model.
Aim 2b. Comparing the results of a deterministic compartmental model with the parameters obtained in Aims 1 and 2a to an identically parameterized stochastic compartmental model.
This aim also seeks to explore issues around parameter uncertainty. In order for a deterministic model fit to a time series to be an appropriate representation of a stochastic process, the deterministic results themselves must be a good
approximation of the most common outcomes of the stochastic process. By fitting an identically parameterized stochastic model, we may evaluate how well this
assumption holds.
Aim 3: Application of dynamic transmission models to hospital infection
control practice, assessing the impact of colonized/active CDI cases admitted
from the community, hand washing compliance and other variables of interest
to infection control on the modeled transmission of C. difficile.
Figure 1-‐1. Discharge rate for C. difficile-‐associated disease per 1,000 hospital discharges, 1997-‐2009. Data from weighted national estimates from HCUP Nationwide Inpatient Sample (NIS).
1998 2000 2002 2004 2006 2008
Chapter 2: The Use of Mathematical Models to Study
Healthcare-‐associated Infection
Hospitals are inherently difficult settings in which to conduct observational research, which complicates the study of healthcare-‐associated infections. Because patients are treated by the same set of doctors, nurses and other healthcare
personnel (HCP) and share the same environment, the assumption of independence between patients that underlies many traditional statistical methods is
questionable. Healthcare-‐associated infections are also a clear case of the problem of “dependent happenings” – when the exposure status of one individual is
dependent on the disease status of those around them. Patients with HAIs shed infectious material into the environment, contaminate HCP hands, and transmit infections directly as they come into contact with other patients. Finally, as research is of secondary concern when compared to patient care, much of the observational research that is done is based on examining a “bundle” 7 or collection of
Mathematical models are ideal for addressing these challenges. Designed to capture the dynamics of a system – like a hospital – as a whole, they are unburdened by assumptions of independence between patients by explicitly modeling how patients interact with one another. In doing so, they extend the empirical evidence we do have from observations based on individuals to ask research questions about the system as a whole. Mathematical models also provide a means to examine a system under the effects of multiple interventions, such as a hospital using a prevention bundle, and evaluate the effect of each intervention in turn8, or in
combination, in a repeatable, quantitative environment.
Model Structure and Composition
Mathematical models, at their core, are an attempt to quantitatively describe the way in which a system under study – such as the transmission of disease within a hospital – works. For any one research question, there are potentially infinite ways to describe a system with varying levels of complexity, different sets of assumptions, and exploring different facets of the underlying processes that drive what we
observe in the real world. A few commonly used types of models are discussed below.
Deterministic Compartmental Models
between these compartments known as parameters, which are often denoted by a Greek letter. For example, the simplest model used in mathematical epidemiology is the so-‐called “SI” model, where patients are grouped into one of two compartments – either susceptible (S) or infectious (I). Movement between these two
compartments is governed by the parameter β (“beta”), the product of the rate of contact between individuals and the probability that that contact will result in successful transmission from a infected individual to a susceptible one. The
collection of compartments and the parameters associated them are expressed as a system of ordinary differential equations, one for each compartment as they change over time. For example, for the SI model described above:
dS
dt =−βSI dI
dt =βSI
(Eq. 1)
These types of models have been extensively used in the epidemiological literature since the work of Kermack and McKendrick9, though they were more recently
popularized by Anderson and May10,11.
The use of these models in the study of HAIs is somewhat more recent, reflecting the emergence of pathogens such as MRSA and C. difficile as major threats to public health (e.g. 12-‐14). Most are single-‐ward adaptations of the Ross-‐Macdonald
model, a model originally developed for malaria control research15. These models
“vectors” carrying infection from an infected patient to a susceptible patient (Figure 2-‐1).
In their most basic form, these models represent both the HCP and patient populations as two compartments – one for members of each group who are not yet colonized or contaminated (depending on which pathogen is being modeled) and one for those who are. Transmission occurs when a contaminated/colonized member of one group comes into contact with an uncontaminated/colonized member of the other group. The reasons for using this particular form are myriad. The analogy between HCPs and vectors is intuitive and easy to understand, the model – and extensions of it – have proven remarkable flexible in describing a variety of disease systems, and the equations that make up the Ross-‐Macdonald model are extensively studied and analytically tractable, allowing for results based purely on the mathematical properties of the system, rather than on any particular combination of parameter values.
These models do, however, have several major assumptions and limitations inherent to them that may threaten their validity. First, they assume uniform, random contact between compartments that interact with one another – for
interaction between two compartments. Extending the example used previously, even if medical students only see a particular group of patients, the contact between them is uniform and random. Second, these models assume strictly patient-‐to-‐HCP-‐ to-‐patient transmission, without a role for indirect transmission through the environment, which may play a substantial role in the transmission of many healthcare-‐associated infections16. Third, these models are memory-‐less – they do
not follow the course of individual patients moving through the model, but rather model the behavior of the population within each compartment as a group. This means that while you can track outcomes such as how many infections occur, how many HCPs have transient hand contamination, etc. you cannot say which
individuals have these outcomes. Beyond this, these types of models allow for non-‐ integer numbers of individuals in each compartment; it is perfectly possible to have 0.20 infected patients, regardless of the biological plausibility of such a scenario. Finally, these models are purely deterministic – there is no mechanism to account for probability and randomness within the system. While in large populations these deterministic results might be considered the “average” outcome of the underlying stochastic reality of the real world, for small populations this assumption is
problematic, making deterministic models frequently inappropriate for use in settings like the modeling of infection transmission within a single ward or hospital.
Stochastic Compartmental Models
compartmental model. There are a number of ways to accomplish this. Perhaps the most accessable is the use of an “event-‐driven approach”. Instead of modeling the movement of the population between compartments at very small time increments, as the deterministic model does, this approach instead uses the same baseline rates as the deterministic model to probabilistically generate a list of events and when they occur, adjusting the numbers in each compartment accordingly. For example, this approach might determine that at time t = 5, a susceptible patient is infected. Thus, when the simulation reaches t = 5, the population of the susceptible
compartment is reduced by one, and the infected compartment increased by one. This approach has the two-‐fold advantage of incorporating randomness in the system and forcing compartment populations to be integer-‐valued, better reflecting the nature of reality17. One well-‐known algorithm for implementing such a
stochastic model is Gillespie’s Direct Method18. This method works by calculating
the time until the next event based on the cumulative rates of all possible events in the model, converting each of these rates into probabilities, and then randomly selecting one of these possibilities using a random number generator. This process is then repeated through time until the simulation comes to an end.
stochastic extinction, and it plays a major role in the dynamics of infection within small populations. However, purely mathematical analysis of the system becomes somewhat more difficult. As a single simulation of the system represents only one potential probabilistic outcome out of many, it is necessary to run many simulations of the same model. This increases the amount of computation time necessary to obtain results and necessitates statistical analysis to analyze results rather than being able to rely purely on mathematical results. Additionally, while stochastic compartmental models address some of the assumptions behind their deterministic cousins, they share the assumption of random mixing between compartments, and transmission from person-‐to-‐person (or patient-‐to-‐HCP-‐to-‐patient in the case of healthcare-‐associated infections).
Network and Agent-‐based Models
Addressing the assumptions shared by both forms of compartmental model requires the adoption of considerably more computationally sophisticated models. As these models are not the focus of this dissertation, they will be discussed only briefly.
Network models explicitly model individuals and the interactions between them, lifting the assumption of random mixing. Individuals within the model have specific health states very similar to those in compartment-‐based models –
susceptible, infected, etc. Disease transmission takes place not through the random encounters between infected and susceptible individuals, but across the links
for examining research questions about how contact between individuals effects disease transmission. For example, the effect of individuals preferentially forming links based one who that person knows19 or the impact of dividing HCP into teams
that see only specific patients or other cohorting strategies20. Unlike compartmental
models, they are not “memory-‐less” – they can, and indeed must, model individual patients as unique entities. This allows for the potential to include patient covariates such as age, race or gender to modify their disease risk, and modeling individuals allows for the analysis of the population in a way that is directly analogous to a real-‐ world population, allowing them to be analyzed and interpreted as virtual cohorts
21. This individual-‐level modeling also allows for the introduction of sophisticated
forms of stochasticity, such as alterations in mixing patterns, and parameters arising from complex probability distributions that elude compartmental models.
These strengths do however have drawbacks. The mathematics behind the dynamics of infection across a network are complex, usually necessitating
simulation-‐based implementations that, compared to compartmental models, are more difficult to program and more computationally intensive. Beyond the complexity of their implementation, these models also have somewhat more burdensome data requirements. In addition to parameters detailing the natural history of the disease, researchers must also specify the contact patterns between individuals. Empirically obtained network data is relatively rare and difficult to collect22, and while artificially generated networks that follow certain empirically-‐
the random mixing assumption of compartmental models with a more refined assumption about how individuals interact, rather than avoiding the assumption completely. Finally, these models generally are meant to model person-‐to-‐person transmission, though it is possible to model environmental transmission by the links between individuals representing shared contact with the same environment, rather than direct contact. However, this type of abstraction does not model the
environment itself, only the shared use of it.
Perhaps the most flexible type of model is an agent-‐based model, where individuals are modeled within an environment, with their behaviors and
interactions governed by a set of rules. These rules can be extremely complex, based on the agent’s environment, current health status, the status of those around them, etc. (e.g. 24), or quite simple. For example, rules allowing random mixing which
allows agent-‐based models to act as an individual-‐based implementation of a compartmental model system. Agent-‐based models share many of the same strengths with network-‐models, arising from the representation of individuals within the model as discrete entities, while also allowing for the direct modeling of individuals within their environment, more complex behavioral patterns, etc. This flexibility comes at the cost of even higher computational complexity than network models and greater requirements for data from which to derive parameter values to describe an ever more complex system.
Meta-‐Population Models
Meta-‐population models are extensions of the any of the models described above. A meta-‐population model breaks up a larger population, such as an entire healthcare system (e.g.25,26) into individual hospitals and long term care facilities, or
a single hospital into its constituent wards, modeling the movement of individuals both within the smaller sub-‐models and between them. These types of models are best thought of as a collection of smaller models, with the corresponding
assumptions, strengths and weaknesses that accompany them.
Modeling C. difficile Transmission
The current literature on the modeling of C. difficile is relatively sparse, even when compared to other HAIs such as MRSA, which has thus far dominated the mathematical modeling literature as concerns hospital infections (e.g. 13,25-‐30 among
others. A selection of the models that do exist is discussed below and summarized in Table 2-‐1.
Starr and colleagues argue in two separate papers31,32 that a mathematical
modeling approach is needed to understand the dynamics of C. difficile, citing the lack of independence between a given patient’s level of exposure and the number of infected patients present in a hospital. The earlier of the two papers31 outlines a
to colonization – for example patients with healthy gut flora, “Resistant, colonized” for patients who, despite having resistant traits have become colonized with C. difficile, “Susceptible, uncolonized” for patients who, while not yet colonized are at elevated risk for such an event, “Susceptible, colonized” for those higher risk patients who have become colonized, and “Toxin-‐positive diarrhea” for those who have developed clinically evident disease. This early paper does not however actually attempt to model the disease process itself – rather, it suggests using a mathematical modeling and population-‐level approach more as a conceptual basis from which to consider infection control measures for C. difficile and recognizes that the effect of any intervention will depend on the context in which it is attempted.
The later paper32 implements this model using a Markov Chain Monte Carlo-‐
based implementation in an attempt to capture both the stochasticity inherent to small-‐population outbreaks and to draw inferences about so-‐called “hidden states” within the model, notably patient health states that are not normally observed, such as pre-‐clinical colonization status. The paper is notably lacking in mathematical detail, though the authors present an important result: environmental
environment, this assumption seems problematic. Additionally, there is no account for incoming prevalent infected or colonized cases from the community, which may play an important role in seeding wards that would otherwise be free of infection33.
A more recent model by Starr et al.34 uses a similar approach with
considerable more methodological detail examines a number of potential infection control strategies. Building off a 390 patient, two-‐ward hospital data set, the authors find that interventions that influence patient susceptibility to C. difficile (i.e.
antibiotic stewardship) are considerably more effective at reducing infection compared to environmental decontamination strategy or strategies that interrupt transmission. Again however, several caveats to this finding are needed. The environment is, again, modeled as a constant background colonization pressure, rather than a dynamic source of transmission that varies with the number of sick patients within the ward. Finally, despite having different patient compartments for patients not on antibiotics and on antibiotics, the MCMC algorithm estimated an essentially identical posterior transition rate from immune to susceptible to C. difficile (0.012 (95% Credible Interval: 0.00081, 0.01670) for patients not on antibiotics and 0.013 (95% CI: 0.0078, 0.020) for patients on antibiotics), and from there models these patients as identical. These findings are contrary to the generally accepted clinical evidence that antibiotic exposure puts one at increased risk for developing C. difficile35.
Grima et al.36 examine the use of non-‐antibiotic treatments for C. difficile,
for therapy with vancomycin or other antibiotics. However, the focus of their model is not C. difficile, but rather on the impact a reduction in the number of antibiotics used to treat the disease would have on the prevalence of other antibiotic resistant organisms, such as vancomycin-‐resistant enterococci (VRE). The authors find that a decrease in antibiotics for the treatment of C. difficile results in a lower rate of subsequent colonization with VRE. The model however has some serious
shortcomings. The model is deterministic, which makes it difficult to distinguish if the differences between model scenarios would manifest in a noticeably different clinical experience. Beyond this, the model assumes that neither VRE nor C. difficile can be acquired in patients not on antibiotics, thus positing that the use of non-‐ antibiotic treatments for C. difficile completely interrupt transmission in all circumstances – an extremely strong assumption. Finally, because the model is focused on VRE, clinically relevant outcomes for CDI patients, such as recurrence, are ignored.
Finally, a model of C. difficile transmission in a hospital by Lanzas et al37
implement. Building from parameter estimates in the literature and a hospital-‐level data set, and using both deterministic and stochastic implementations of the model, the authors explore which parameters are influential in determining the basic reproductive number (R0) for the model – a measure of how many secondary
infections will arise from a single primary infection and other measures of influence parameter values have on model outcomes. They found, in contrast to Starr et al.34,
that parameters governing transmission had a much greater impact on overall rates of colonization and disease compared to those governing susceptibility. The authors suggest this may have been because the widespread use of antibiotics in the model eliminated the progression from resistant to susceptible as a meaningful rate-‐ limiting step in the transmission process.
Further Directions
The mathematical modeling landscape for C. difficile is relatively
undeveloped, despite the disease’s considerable burden on the healthcare system. There have been few if any attempts to actively model clinical interventions. Rather, current models have predominantly sought to describe the infection process
mathematically and quantify which parameters most influence the model – a useful process to identify targets for intervention, but one step removed from actual
clinical impact. Despite growing evidence for the role surface contamination plays in the transmission of C. difficile16,38,39, little modeling has been done focusing on the
understandable given the difficult compartmental models have in directly modeling environmental contamination. This abstraction does however ignore the fact that that, just as in person-‐to-‐person transmission, environmentally mediated
transmission is a dynamic process. A patient’s exposure to environmental sources of transmission is a function of the number of other infected patients proximate to the patient in both space and time, rather than a constant background exposure. These types of models will be necessary in the future to both fully model the role of the environment in the transmission of C. difficile and to model interventions on the environment itself, such as disinfection and cleaning.
Figure 2-‐1. Flow diagram for Ross-‐Macdonald-‐style healthcare-‐associated infection model. Healthcare personnel are denoted as either uncolonized/contaminated (Us) or colonized/contaminated (H). Similarly, patients are shown as either
uncolonized/contaminated (Up) or colonized/contaminated (Cp). Solid arrows indicate available paths to move between compartments, while dashed arrows indicate pathways of disease transmission.
H
"U
s
"
Table 2-‐1. Key Mathematical Modeling Papers Focusing on Healthcare-‐Associated Clostridium difficile Transmission.
Author
(Year) Journal Model Type Key Findings
Starr et al. (1997)
Lancet Compartmental None (Conceptual framework).
Starr et al. (2001)
Clinical Microbiology and Infection
Compartmental (Stochastic -‐MCMC)
Different outbreak signatures are obtained for different types of transmission (environmental, person-‐to-‐person, etc.). Starr et al.
(2008)
Journal of Hospital Infection
Compartmental (Stochastic -‐MCMC)
Patient susceptibility is more important for infection than transmission rates.
Lanzas et al. (2011)
Infection Control and Hospital
Epidemiology
Compartmental (Deterministic and Stochastic – Gillespie)
Transmission rates dominate infection process; patient susceptibility parameters play a relatively minor role.
Grima et
al. (2012) Computational and Mathematical Methods in Medicine
Compartmental
Chapter 3: Data Sources
The data for this study comes from three sources, each covering a different aspect of C. difficile transmission. The data from these sources, as well as estimates from the literature, inform the parameter estimates used in the mathematical model described in later chapters.
Individual level C. difficile cohort
A cohort of 609 patients over 18 years of age was drawn from patients in 28 hospitals within the DICON network with incident, hospital-‐onset, healthcare facility-‐associated CDI, as defined by the CDC surveillance criteria40 between
7/1/2009 and 12/31/2010 (Figure 3-‐1).
This data set included patient admission, discharge, laboratory-‐based
Hospital level C. difficile surveillance
The patient-‐level CDI cohort is supplemented by a weekly surveillance time-‐ series of 31 hospitals within the DICON network, consisting of the overall number of hospital-‐onset, healthcare facility-‐associated cases over the same time period of 7/1/2009 to 12/31/2010. In addition to the overall burden in terms of number of cases, this data set includes patient-‐day denominators for the hospital overall and within the ICU specifically, as well as whether or not the hospital was using
polymerase chain reaction (PCR) or non-‐molecular diagnostic tests to diagnose cases. In total, this surveillance time series consisted of 1805 CDI cases over 4,038,447 patient days, 344,471 of which were within the ICU. This data set’s primary utility is in describing the overall incidence of CDI within a hospital. As some parameters in the model are unknown, and the model largely based on disparate information sources, it is useful to verify that the burden of disease as seen in the model corresponds, at least roughly, to the burden of disease
experienced by actual hospitals.
Non-‐CDI Patient data
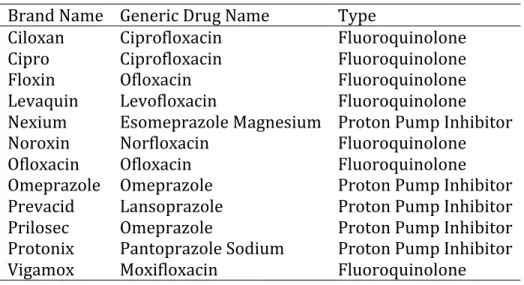
between 7/1/2009 and 12/31/2010. This data set contained the records of 42,093 patients, 452 of which were in the ICU, and included demographic information, admission and discharge times, complaints present on admission, and flags for prescriptions that might place a patient at risk for the development of CDI (Table 3-‐ 1).
Figure 3-‐1. CDC/NHSN timeline-‐based C. difficile surveillance definitions. C. difficile infections are divided into one of four categories: Healthcare Facility Onset-‐
Healthcare Facility Associated (HO-‐HCFA), Community Onset-‐Healthcare Facility Associated (CO-‐HCFA), Indeterminate or Community Associated (CA-‐CDAD) cases based on the time of onset of disease. Patients developing CDI within 48 hours of admission are considered CO-‐HCFA if they had a previous discharge from a healthcare facility within 4 weeks, CA-‐CDAD otherwise.
Table 3-‐1. Drug Prescriptions for UNC Healthcare System Inpatients Identified as High-‐Risk for Development of Clostridium difficile Infection
48#hrs# 4#Weeks# 8#Weeks#
*# HO-HCFA# CO-HCFA# Indeterminate# CA-CDAD#
Admission# Discharge#
Time%
Surveillance% Defini0on%
Brand Name Generic Drug Name Type
Ciloxan Ciprofloxacin Fluoroquinolone
Cipro Ciprofloxacin Fluoroquinolone
Floxin Ofloxacin Fluoroquinolone
Levaquin Levofloxacin Fluoroquinolone
Nexium Esomeprazole Magnesium Proton Pump Inhibitor
Noroxin Norfloxacin Fluoroquinolone
Ofloxacin Ofloxacin Fluoroquinolone
Omeprazole Omeprazole Proton Pump Inhibitor
Prevacid Lansoprazole Proton Pump Inhibitor
Prilosec Omeprazole Proton Pump Inhibitor
Protonix Pantoprazole Sodium Proton Pump Inhibitor
Chapter 4: Estimating All-‐Cause Mortality and Length of
Stay in Incident, Healthcare Facility-‐associated
Clostridium
difficile
Cases Using Parametric Mixture Models
Introduction
Clostridium difficile infection (CDI) is a rapidly increasing cause of healthcare-‐ associated infections (HAI). Discharge data from the Healthcare Cost and Utilization Project Nationwide Inpatient Sample demonstrated that approximately 336,000 cases of CDI occur annually in the US41. This number of cases would cost
approximately $500 million per year5,6. In contrast to other HAI, CDI incidence has
actually increased despite prevention efforts in the US, Canada and Europe4.
The design and analysis of interventions to control C. difficile is complicated by the setting in which infection takes place. Hospitalized patients are often non-‐ independent, single intervention studies are rare and difficult to conduct, and infected patients act as a source of exposure for other patients, in addition to having their own outcomes. In this kind of environment, mathematical and cost-‐
of stay, all-‐cause mortality, and other estimates that quantify the experience of a patient suffering from CDI.
Quantifying these outcomes presents a three-‐fold problem. First, infection events cannot be considered independent, necessitating analytic techniques that account for clustering within a hospital. Second, to facilitate the use of these estimates in mathematical models, cost-‐effectiveness research, and other applications, rates or hazards must be directly estimated. Finally, patients may experience several mutually exclusive outcomes (such as death or discharge from the hospital). To address this final problem competing risks approaches must be employed. Conventional competing risk analysis (i.e., a cause-‐specific survival model) estimates the time to one outcome, while treating the other outcomes as censored42. These estimates address a particular question; namely, in the case of
death versus discharge from a hospital, they estimate the time until death if no one were ever discharged or the time until discharge if no one ever died while in the hospital. While in some settings this approach might be acceptable or even desirable, in the case of CDI we wish to estimate the time until death given the observed levels of discharge, and the time until discharge given the observed levels of mortality.
population from a multi-‐hospital cohort of CDI patients. In addition to the relative survival times between those patient groups, we also estimate the proportion that die while in the hospital for ICU patients and non-‐ICU patients and the odds ratio for those proportions.
Materials and Methods
Study Population
We used a cohort of 609 adult (>18 years of age) incident cases of CDI admitted between 7/1/2009 and 12/31/2010 obtained from infection control surveillance data from 28 hospitals within the Duke Infection Control Outreach Network, a group of hospitals that shares infection control expertise and data in the southeastern United States43. The maximum number of cases from a single hospital was 74, the
minimum 1, and the median number of cases per hospital was 13. All cases were hospital onset, healthcare facility-‐associated, as defined by the CDC’s surveillance guidelines40. Specifically, cases must have arisen more than 48 hours after
admission.
Survival Times and Outcomes
with an unknown event time were considered interval censored from 12 hours after diagnosis to 180 days after diagnosis. Patients with identical diagnosis and
discharge dates were assumed to spend 12 hours in the hospital.
Exposure Definition and Covariate Selection
Patient ICU status was determined at the time of diagnosis of CDI. Patients were either in the hospital’s ICU at the time of their infection and thus exposed or were not, and are unexposed, regardless of whether or not their treatment subsequently ended or involved the ICU.
Inverse probability weights were used to control for confounding by patient characteristics measured at hospital admission44. Using such weights, rather than
regression adjustment, allows estimated curves to represent the marginal survival, rather than survival conditional on covariates45. Variables considered for inclusion