Manipulating serotonin function in depression Thesis Leiden University
ISBN 978-90-8891-0173
Cover design: Joost van der Kuil
Friesland Foods Domo financially supported publication of this thesis.
The research reported in this thesis was facilitated by research grant no. 904-57-132 from the Netherlands Organisation for Scientific Research- Medical Sciences (NWO-MW) to professor dr. A.J.W. van der Does and by the foundation ‘Stichting tot Steun VCVGZ’.
Proefschrift
ter verkrijging van
de graad van Doctor aan de Universiteit Leiden,
op gezag van Rector Magnificus prof.mr. P.F. van der Heijden,
volgens besluit van het College voor Promoties
te verdedigen op donderdag 6 december 2007
klokke 16:15 uur
door
Wendelien Merens
geboren te Delft
Promotores: Prof. dr. A. J. W. van der Does
Prof. dr. Ph. Spinhoven
Referent: Prof. dr. W.J. Riedel
Overige leden: Prof. dr. F.G. Zitman
Chapter 1: Introduction 9
Chapter 2: Residual cognitive impairments in remitted depressed 23
patients
Chapter 3: Diet rich in alpha-lactalbumin improves memory 49 in unmedicated recovered depressed patients and
matched controls
Chapter 4: The effects of a diet enriched with alpha-lactalbumin 75 on mood and cortisol response in unmedicated
recovered depressed subjects and controls
Chapter 5: The effects of experimentally lowered serotonin 101 function on emotional information processing and
memory in remitted depressed patients
Chapter 6: Low-dose tryptophan depletion and inter- 131 individual variations in tryptophan levels following
ATD
emotional information processing and mood
Chapter 9: Discussion 203
References 229
Samenvatting 253
Dankwoord 263
Curriculum vitae 269
1
Major depressive disorder
Depressive disorder is one of the most disabling diseases in the world (Üstün et al., 2004). Lifetime prevalence rates of major depressive disorder are about 17% in the USA; one in six persons will have a diagnosable depression at some point in their lives (Blazer et al., 1994). However numbers may differ between countries (Hammen, 1997). More women than men are affected by depressive disorders worldwide (with a ratio of 2:1). The rates of onset and current depression are highest in late adolescence and early twenties (Hammen, 1997). The core symptoms of depression are low mood and anhedonia (the inability to gain pleasure from normally pleasurable experiences). Other symptoms may include a decreased appetite, difficulties sleeping, fatigue, feelings of worthlessness, diminished ability to concentrate and thoughts of death or suicide. Table 1 represents the diagnostic criteria for a Major Depressive Episode, as stated by the Diagnostic and Statistical Manual of Mental Disorders-IV (American Psychiatric Association, 1994).
The most effective treatments for depression are antidepressant medication, structured forms of psychotherapy (eg. cognitive behavioural therapy), or a combination of both. Selective serotonin reuptake inhibitors (SSRIs) form the most widely used pharmacological treatment for depression (Petersen et al., 2002).
role that the neurotransmitter serotonin (5- hydroxy-triptamine; 5-HT) plays in depression, especially in mood and cognitive processing. The link between serotonin and two biological vulnerability factors (the cortisol response to stress and heart rate variability) associated with depression will also be investigated.
The role of serotonin in depressive disorder
The notion that a dysfunctional serotonergic system is involved in the pathophysiology of depression is supported by a wide range of experimental studies (Delgado et al., 1990; Maes & Meltzer, 1995). Abnormalities in the 5-HT system can occur at different levels: availability of the serotonin precursor tryptophan (Cowen et al., 1989), serotonin synthesis, release, reuptake or metabolism, or at the pre- or postsynaptic receptors (Cleare et al., 1998; Maes & Meltzer, 1995). This ‘serotonergic vulnerability’ may be caused by a variety of factors such as innate factors (genetic factors, family history, personality, gender, sex hormones); environmental factors (stress, immune system and cytokines, drug use), and bio-psychological interactions (Jans et al., 2007).
Table 1. The diagnostic criteria for Major Depressive Episode according to the DSM-IV
___________________________________________________________________
A. Five (or more) of the following symptoms have been present during the same 2-week period and represent a change from previous functioning; at least one of the symptoms is either (1) depressed mood or (2) loss of interest or pleasure.
(1) depressed mood most of the day, nearly every day, as indicated by either subjective report (e.g., feels sad or empty) or observation made by others (e.g., appears tearful).
(2) markedly diminished interest or pleasure in all, or almost all, activities most of the day, nearly every day (as indicated by either subjective account or observation made by others).
(3) significant weight loss when not dieting or weight gain (e.g., a change of more than 5% of body weight in a month), or decrease or increase in appetite nearly every day.
(4) insomnia or hypersomnia nearly every day
(5) psychomotor agitation or retardation nearly every day (observable by others, not merely subjective feelings of restlessness or being slowed down)
(6) fatigue or loss of energy nearly every day
(7) feelings of worthlessness or excessive or inappropriate guilt (which may be delusional) nearly every day (not merely self-reproach or guilt about being sick)
(8) diminished ability to think or concentrate, or indecisiveness, nearly every day (either by subjective account or as observed by others)
(9) recurrent thoughts of death (not just fear of dying), recurrent suicidal ideation without a specific plan, or a suicide attempt or a specific plan for committing suicide
B. The symptoms cause clinically significant distress or impairment in social, occupational, or other important areas of functioning.
The neurobiological basis of depression has been linked to the mechanism of action of antidepressant medication: serotonergic antidepressants increase brain serotonin function by inhibiting the re-uptake of the neurotransmitter serotonin (Blier & de Montigny, 1994; Delgado, 2000).
Since a direct measurement of serotonin in humans is problematic, research into serotonin function is based on indirect methods. Experimentally manipulating serotonin levels in humans makes it possible to study the role of serotonin function in depression and antidepressant action. In this thesis, two different interventions are used to manipulate serotonin activity in humans: acute tryptophan depletion and a diet enriched with the milk-whey alpha-lactalbumin.
Manipulations of serotonin
Tryptophan depletion
Serotonin synthesis depends on dietary intake of its precursor, the essential amino acid tryptophan. At the blood-brain barrier, tryptophan has to compete for entry with the other large neutral amino acids (LNAAs; tyrosine, phenylalanine, leucine, isoleucine and valine). Once tryptophan has entered the brain, it is synthesized in a rate limiting step by tryptophan-hydroxylase into 5-hydroxytryptophan (5-HTP) and then into serotonin. See Figure 1.
tryptophan (Bell et al., 2001), mostly mixed with water and artificial flavour. After five to six hours, ATD results in peak reductions of plasma tryptophan levels (+/- 70%) and ratio tryptophan/LNAA, which is an index of central 5-HT turnover, (+/- 90%). Therefore, ATD is a useful tool to investigate the effects of lowered serotonin function in humans. ATD results in significant behavioural effects, including a lowering of mood (Young et al., 1985), changes in cognitive performance (Park et al., 1994; Schmitt et al., 2000), increased impulsive behaviour (Young, 1986) and changes in sleep architecture (Bhatti et al., 1998). It is important to note that differential effects of ATD are found in healthy vs. depression vulnerable subjects. Mood effects of ATD are only found in remitted depressed patients taking SSRIs (Booij et al., 2002; Delgado et al., 1990) and in healthy subjects with a family history of depressive disorders (Benkelfat et al., 1994; Klaassen et al., 1999). Some of the other effects (on cognition, sleep) are not restricted to these groups, but may also occur in healthy volunteers.
found not to affect mood (e.g. Booij et al., 2005a), it allows for an investigation of the dose-response effects of lowered serotonin function and thus seems to be a better control condition for some research questions. Recently, different studies (Hayward et al., 2005; Munafò et al., 2006) have reported effects of a different low-dose tryptophan depletion method, using a mixture containing eight amino acids instead of the regular fifteen amino acids. The low-dose tryptophan depletion method is further discussed in Chapter 5.
Dietary interventions
Carbohydrate-rich diets have been found to increase the tryptophan/LNAA ratio and thus increase central serotonin function. This is due to a carbohydrate induced insulin response that stimulates the uptake of LNAA in skeletal muscles with the exception of tryptophan (Fernstrom & Wurtman, 1971). However, these increases are only found under rather extreme dieting conditions (Yokogoshi & Wurtman, 1986). Carbohydrate-rich, protein-poor diets have been found to increase the tryptophan/LNAA ratio by 42% compared to a control diet (Markus et al., 1998) and to prevent stress induced deterioration of mood and cortisol response but only in stress-vulnerable subjects (Markus et al., 1998). Also, carbohydrate intake improves cognitive performance of stress-vulnerable subjects under controllable laboratory stress (Markus et al., 1999). Overall, the effects of carbohydrate-rich diet seem to depend on factors such as the time of day, the type of task and the vulnerability of the population (Dye et al., 2000).
activity. Diet enriched with alpha-lactalbumin has been found to prevent stress-induced cortisol and mood response (Markus et al., 2000) and to improve cognitive performance (Markus et al., 2002), but again only in stress-vulnerable individuals.
Cognitive and biological vulnerability to depression
Cognitive function
Problems concentrating and making decisions are part of the diagnostic criteria of Major Depressive Disorder (American Psychiatric Association, 1994). Experimental research has shown that memory, learning, attention, motor function and problem solving may also be affected in depressed patients (Austin et al., 2001; Elliott, 1998; Weiland-Fiedler et al., 2004). In terms of impairments in emotional (as opposed to neutral) information processing, the recognition of facial expressions of emotions has been found to be affected in depressed patients (Bouhuys et al., 1999; Gur et al., 1992). Also an increased attentional bias for negative information (Williams et al., 1996) and an increased level of dysfunctional attitudes (Ingram et al., 1998) are found compared to healthy controls.
Figure 1. Manipulating serotonin synthesis
_____________________________________________________________
_____________________________________________________________ Tryptophan
5-HTP 5-HT
(3) (2)
Competition with large neutral amino acids
Dietary tryptophan (1)
Protein
Serotonin synthesis can be influenced at three levels: by restricting the dietary intake of tryptophan (1); by increasing the competition with the other large neutral amino acids (2); and by inhibition of tryptophan-hydroxylase which synthesizes tryptophan into 5-HTP (3). The ATD method described in this thesis is based on (1) and (2).
Blood Brain
Some of these impairments are also related to risk of relapse (Bouhuys et al., 1999; Williams et al., 1996), suggesting that some aspects of emotional information processing may be vulnerability markers for depression.
Evidence from animal and human studies has linked serotonin to cognitive function, especially learning and memory (McEntee & Crook, 1991; Sirviö et al., 1995). ATD studies have supported these findings. In healthy volunteers, ATD selectively impairs learning (Park et al., 1994), memory retrieval and consolidation (Klaassen et al., 2002; Park et al., 1994; Riedel et al., 1999) and ATD improves attention in healthy samples (Schmitt et al., 2000) and patients (Booij et al., 2005a). Recently, interest has been paid to the effects of ATD on emotional information processing; ATD impaired the recognition of facial expressions of fear in female healthy volunteers (Harmer et al., 2003c) and increases emotional interference in both healthy and recovered depressed patients (Hayward et al., 2005; Munafò et al., 2006).
Research on the effects of antidepressant medication also supports the link between serotonin and cognition (Amado-Boccara et al., 1995; Harmer et al., 2003b; Thompson, 1991). Very brief (one day or one week) treatment with a serotonergic antidepressant causes selective changes in emotional information processing, in particular in the recognition of facial expressions of emotions, in both healthy volunteers and recovered depressed women (Bhagwagar et al., 2004; Harmer et al., 2003a; Harmer et al., 2004; Harmer et al., 2006a).
Stress and cortisol
state (Cowen, 2002). High cortisol levels may initially cause higher central nervous system turnover; however during continuous or frequent stress the availability of brain tryptophan and serotonin may diminish and vulnerability to depression may increase (Markus, 2003).
This makes cortisol an important biological mediator through which stress lowers serotonin function and thereby causes depression in vulnerable individuals. Cortisol is controlled by the hypothalamo-pituitary-adrenal (HPA) axis with which the central serotonergic system interacts. The finding of HPA-axis hyperactivity in depression appears to be consistent, although it is not found in all patients (Jans et al., 2007).
To study neuroendocrine dysfunction in depression, neuroendocrine challenge tests are used, such as d-fenfluramine (Cleare et al., 1998) or the dexamethasone/ corticotrophin releasing hormone (CRH) test (Baghai et al., 2002). Evidence from challenge studies indicates that depressed and remitted depressed patients show blunted neuroendocrine responses to drugs that stimulate serotonin turnover, suggesting decreased serotonin responsiveness (Bhagwagar et al., 2002a; Bhagwagar et al., 2002b; Flory et al., 1998; Riedel et al., 2002). These results indicate that blunted cortisol responses to a neuroendocrine challenge may be a vulnerability marker for depression.
Heart rate variability
underlie the increased risk of cardiovascular disease in depression (Gorman & Sloan, 2000; Grippo & Johnson, 2002; Musselman et al., 1998). HRV is a measure of autonomic regulation of the heart (Krantz & McCeney, 2002). HRV reflects the capacity of the autonomic nervous system to vary the intervals between consecutive heartbeats (Grippo & Johnson, 2002). Reductions in HRV are not exclusively related to depression (Agelink et al., 2002; Rechlin et al., 1994) but are also associated with generalized anxiety disorder (Thayer & Lane, 2000), impulse control disorders such as ADHD (Beauchaine et al., 2001), and alcoholism (Ingjaldsson et al., 2003). Negative results have also been found (Gehi et al., 2005). Serotonin dysfunction is suggested to play an etiological role in both depression and cardiac dysfunction (Grippo & Johnson, 2002), and may thus underlie the association between HRV and depression.
Research aims
This thesis will investigate the effects of three different serotonin manipulations (an alpha-lactalbumin enriched diet, low-dose ATD, high-dose ATD) on mood and cognitive processing in euthymic patients with a history of depressive disorder and healthy controls. The literature regarding a possible link between serotonin induced changes in mood and emotional information processing will also be discussed.
The first project that was carried out as part of the current thesis investigated the effects of an alpha-lactalbumin enriched diet, which increases serotonin activity, on mood and different aspects of neutral information processing in recovered depressed patients and healthy controls. The second project focussed on the effects of acute tryptophan depletion, which lowers serotonin function, on mood and neutral as well as emotional information processing in medicated remitted depressed patients. In addition to these two empirical studies, an overview of the literature is given on the effects of serotonin manipulations on mood and emotional information processing, to evaluate a possible link between serotonin induced changes in mood and emotional information processing. Apart from the effects of serotonin manipulations on cognitive processing, the link between serotonin activity and two different biological vulnerability factors for depression was also investigated. The first study additionally investigated the effects of alpha-lactalbumin on stress-induced cortisol response and the second study also looked at the effect of acute tryptophan depletion on heart rate variability.
Outline of this thesis
2
Residual cognitive impairments in remitted
depressed patients
W. Merens, L. Booij, A.J. W. Van der Does.
Abstract
Introduction
Problems concentrating and making decisions are part of the diagnostic criteria of major depressive disorder (American Psychiatric Association, 1994). Experimental research has shown that memory, learning, attention, motor function and problem solving may also be affected in depressed patients (Austin et al., 2001; Elliott, 1998; Weiland-Fiedler et al., 2004). The cognitive functions that are most impaired in depression are those which require effortful executive functioning, which is highly dependent on the prefrontal cortex (Elliott, 1998). Some studies have focused on impairments in emotional (as opposed to neutral) information processing in depressed patients. For example, the recognition of facial expressions of emotions has been found to be affected in depressed patients (Bouhuys et al., 1999; Gur et al., 1992). Also an increased attentional bias for negative information (Williams et al., 1996) and an increased level of dysfunctional attitudes (Ingram et al., 1998) are found compared to healthy controls.
age (mean ages 54 and 52 years) and education level. In another study, differences between depressed and non-depressed subjects on different memory tests (verbal memory, immediate and delayed recall, learning, retrieval) disappeared following imipramine treatment, but only in treatment responders. Improvement in depressive symptoms led to significant improvement in memory performance (Peselow et al., 1991). Again both groups were equal in age (mean 48-50 years), gender distribution (both men and women were tested) and level of intelligence. Paradiso et al. (1997) compared cognitive performance of patients with a –relatively chronic- history of unipolar and bipolar depressive disorder to that of age- (mean age 50-57 years) and education matched controls. Only male subjects were included and almost all patients were taking some form of psychotropic medication (benzodiazepines, tricyclics, trazodone). They found that euthymic unipolar patients performed worse on tasks measuring executive function (Trail Making B, Stroop CWT), visual-motor sequencing (Trail Making A), immediate memory (word-list memory test) and attention (digit symbols) compared to healthy controls. In another study, unmedicated male and female remitted depressed patients were impaired on tasks of rapid visual information processing (sustained attention), psychomotor speed and spatial working memory compared to healthy controls (Weiland-Fiedler et al., 2004). However, after correcting for residual depressive symptoms, only the difference in sustained attention remained significant. In this study mean ages were 36 and 38 years and all patients had been taking antidepressant medication in the past. These results were supported by another study that found medicated and unmedicated euthymic patients to be impaired in attentional and executive function (Paelecke-Habermann et al., 2005).
al., 2006), the recognition of facial emotions (Bouhuys et al., 1999) and attentional bias (Williams et al., 1996). Some of these impairments are also related to risk of relapse (Bouhuys et al., 1999; Williams et al., 1996).
Overall, depressed patients show cognitive impairments across a wide range of domains. Some of these impairments improve with clinical recovery, while others may persist into the euthymic phase. Some cognitive impairments may even be related to depressive relapse. However, following the results of Weiland-Fiedler et al. (2004), it remains questionable whether remitted depressed patients show any cognitive impairments in comparison to an adequately matched control group and, most importantly, when residual depressive symptoms are taken into account. The current study investigated cognitive performance in medicated, remitted depressed patients, who are expected to show relatively high levels of residual depressive symptoms, and two matched control groups. To cover a wide range of tests, two separate studies were undertaken. The two studies differed in the type of information processing that was assessed. Study 1 included mainly tests of emotional information processing; study 2 included tests that assessed neutral information processing. To check for possible differences between the study samples, both studies included a fluency test and a measure of attentional bias. No precise hypotheses were formed since the literature does not provide unequivocal results.
Materials and Methods
Study 1:
Patients: As part of a larger study, two samples of remitted depressed patients were recruited from a Mood Disorders Program. Participants were male and female outpatients (of the Mood Disorders Program of Parnassia Psycho-medical Center, The Hague). Patients were at different stages in treatment, but were referred to the study only when their therapist thought they would meet criteria for remitted or recovered depression. Age limits were 18 to 65 years. Participants had to fulfill the following inclusion criteria: primary intake diagnosis of DSM-IV major depressive disorder; no longer fulfilling DSM-IV criteria for depression and Hamilton-17 scores lower than or equal to 15 (Frank et al., 1991); ongoing treatment with a selective serotonin reuptake inhibitor (SSRI) or selective serotonin and noradrenalin reuptake inhibitor (SSNRI) for at least four weeks; no history or current psychotic disorder; no substance abuse in the past 3 months, based on DSM-IV criteria; BMI equal or higher than 18; free of neuro-endocrine or neurological disease; no pregnancy or lactation (females). 1
Controls: Healthy control participants were recruited through
advertisements in local newspapers. Participants were matched to the patient group on age and gender. Inclusion criteria were: no mood disorders (lifetime); no first degree relatives with a mood disorder (lifetime); no history or current psychotic disorder; no substance abuse in the past 3 months, based on DSM-IV criteria; no use of psychotropic medication, free of neuro-endocrine or neurological disease.
Materials
Self-report: The Beck Depression Inventory (Beck et al., 1996) is a self-rating scale that assesses the presence and severity of depressive symptoms. The Dutch version was used (BDI-II-NL, Van der Does, 2002b). The Dysfunctional Attitudes Scale (DAS, Weissman, 1979) assesses the level of dysfunctional attitudes. A 22 item version was used, based on the original form A. The Leiden Index of Depression Sensitivity (LEIDS) (Van der Does, 2002a) consists of 34 items and assesses the effects of dysphoric mood on cognitions (‘cognitive reactivity’).
Depression severity: The Hamilton Depression Rating Scale (HAM-D-17)
was administered to patients to assess the severity of depressive symptoms (Hamilton, 1967).
Cognition: The cognitive test-battery took about 50 minutes to complete.
Word Learning Test (Saan & Deelman, 1986): A list of 15 unrelated, neutral words was presented on a tape. Immediate recall was tested after each of five consecutive presentations. After the fifth trial, subjects continued with a non-verbal task. Fifteen minutes later delayed recall was tested. Immediate recall performance was defined as the total of correct words remembered over the five trials. Delayed recall performance was defined as the number of correct words produced at delayed recall.
Implicit Association Test: The IAT is a sorting task that assesses implicit associations on the basis of reaction times (Egloff & Schmukle, 2002; Greenwald et al., 1998). This test is extensively used in social psychological research to assess stereotypes (Greenwald & Banaji, 1995). Participants are asked to sort stimuli representing four categories by pressing the appropriate key (each response key was assigned to two categories). If two categories are strongly related, the sorting task will be easier (i.e. faster RTs) when the categories share the same response key than when they share different response keys. We used an emotional and a neutral version of this task. Only median latencies for correct responses were included in the analyses. Reaction times to congruent (e.g. self and positive stimuli, insect and negative stimuli) and incongruent stimuli (e.g. self and negative stimuli, flowers and negative stimuli) were calculated.
Dot-probe test: This task measures attentional bias to emotional stimuli (MacLeod et al., 1986). Word pairs (threat words with neutral words and depression related words with positive words) were presented on a computer screen for 500 ms, one in the upper part of the screen and one below. Following the termination of that display, a dot appeared on the location of either word. Participants had to indicate the location of the dot by pressing a key. All word pairs were preceded by a white fixation cross for 500 ms. To control for possible outliers, only median latencies for correct responses were included in the analyses. Attentional bias was calculated by subtracting the RT for positive (neutral) words from the RT for depressive (threatening) words.
emotional standard (100%) in 10% steps, providing a range of emotional intensities. Each emotion-intensity was presented by two examples (one male and one female face) in random order. Each face was presented on a computer screen for 500 ms. and immediately replaced by a blank screen. Participants made their response by pressing a labeled key, after which the next face appeared on the screen. They were instructed to respond as quickly and accurately as possible. Accuracy of recognition was calculated over the different intensity levels in five (20%) blocks. Reaction times for correct responses were calculated.
Procedure
Patients: After showing interest in taking part, all volunteers were given oral and written information about the study. Informed consent was obtained and participants who seemed to meet criteria were invited for the first session. During this session, the SCID-IV interview was administered to ensure patients no longer fulfilled criteria for MDD (First et al., 1995). Participants filled out all questionnaires and afterwards the cognitive tests were done. The session lasted two to three hours. Clinical background information was checked in medical records. The study was approved by an independent medical ethics committee (METIGG, Utrecht).
Study 2:
In- and exclusion criteria, methods and procedures were identical to study 1. However, the DAS was not filled out and the LEIDS was only completed by patients and therefore not reported here.
Cognition: The cognitive tests took approximately 60 min.
Verbal Fluency: This test was identical to the fluency test in study 1.
Stroop Colour Word test: This test measures focused attention and response inhibition. Names of colours (red, yellow, blue and green) printed in black were presented one by one for a maximum of 1500 ms on a computer screen. Participants were instructed to read these words as fast as possible (Condition I). Next, coloured patches were presented (Condition II). Finally, the names of colours printed in an incongruent colour were presented and participants were instructed to name the colour of the ink (Condition III). Median reaction times (RTs) were recorded. Interference was defined as the extra time needed for condition III relative to the average of conditions I and II.
Emotional Stroop test: This test was used to assess attentional bias for emotional material. The stimuli were positive, neutral or depression-related words. Words printed in colour were presented consecutively on a computer screen. Participants were asked to name the colours as quickly as possible. The order of the word categories was randomized over the patients. The order of the words within each category was randomized.
but to ignore its location, as fast as possible. Correct responses and RTs were registered.
Tower of London (TOL): The TOL (Owen et al., 1995a) is a planning task
consisting of three coloured balls (red, yellow and blue) placed on three sticks in various arrangements. Two arrangements were presented on the upper and lower half of the screen. The patient was instructed to indicate the minimal number of moves necessary to change the first arrangement into the second (two to five moves). Correct responses and RTs were registered.
Abstract Patterns Recognition task (APRT): The APRT (Rubinsztein et al., 2001) measures (speed of) recognition of non-verbal abstract information from short- and long-term memory. Sixteen abstract patterns were presented consecutively for 3000 ms, with 500 ms intervals. Participants were instructed to memorize the patterns. After three presentations of the complete series, two patterns were presented simultaneously; one that had been learned and a new pattern. Participants had to indicate as fast as possible which one had been previously presented. The recognition procedure was repeated after 35 min, during which verbal tasks were administered. Sensitivity measures (A’ ) were calculated for the proportion of correctly recognized patterns, corrected for response tendency by the formula: A’ = 1 – ¼ [fr/ cr + (1-cr) / (1– fr)], in which fr = the proportion of falsely recognized patterns and cr = proportion of correctly recognized patterns, following signal detection theory (Pollack & Norman, 1964).
Statistical analysis
score as a covariate. Since matching for Level of education was unsuccessful in study 1, this variable was also entered as a covariate in the analyses of the cognitive measures from study 1. Data from the Facial Emotion Recognition task were analyzed with GLM repeated measures analysis with Emotion (happiness, sadness, fear, anger, and disgust) as a within-subjects factor and Group (controls vs. remitted depressed patients) as a between-subjects factor and BDI-II and Level of education as covariates. The TOL was also analyzed using GLM repeated measures with Steps (2, 3, 4, 5) as a within-subjects factor and Group as a between-subjects factor and BDI-II as a covariate. Data are reported as means ± standard deviations. All tests were corrected for multiple testing using Bonferroni corrections.
Results
Study 1:
Data screening
Participants:
Twenty healthy controls and nineteen remitted depressed subjects were included in the study. Participants were well matched on age and gender, however the control group had a higher level of education compared to the patient group (χ2= 10.6, p = .005). Current comorbid diagnoses in the remitted
depressed group were Social phobia (n = 1), Specific phobia (n = 2), chronic PTSD (n = 1) and Dysthymia (n = 4). Table 1 and 2 show clinical and demographical characteristics of both patients and controls of Study 1 and Study 2.
Self report measures
Recovered depressed patients scored higher on the BDI-II (t(19.6) = -5.5, p< .001) compared to controls. Patients also scored higher on the DAS (t(37) = -3.7, p = .001) and on some subscales of the LEIDS compared to the control group: Harm Avoidance (t(37) = -6.6, p< .001), Rumination (t(37) = -9.6, p < .001), Hopelessness (t(37) = -2.2, p = .037) and on the Total score (t(37) = -4.2,
Table 1. Characteristics of Study 1 and Study 2 (mean (SD)) Study 1
Controls
(n = 20) Patients(n = 19)
t df p
Age (SD) 47.7 (14.1) 44.2 (13.0) 0.8 37 .426
BDI-II 1.4 (1.7) 11.7 (8.0) -5.5 19.6 .000**
LEIDS totalscore 24.7 (12.6) 40.0 (9.7) -4.2 37 .000**
DAS 58.8 (15.9) 80.2 (19.8) -3.7 37 .001**
χ2 df p
M/F 1/19 2/17 0.4 1 .517
Education level 10.6 2 .005**
- low n = 2 n = 7
- medium n = 8 n = 11
- high n = 10 n = 1
Study 2 Controls
(n = 21) Patients(n = 20)
t df p
Age 44.1 (10.2) 48.7 (7.9) -1.6 39 .114
BDI-II 5.2 (5.3) 12.9 (10.1) -3.0 28.4 .006**
χ2 df p
M/F 9/12 11/9 0.6 1 .437
Education level 0.8 2 .665
- low n = 5 n = 3
- medium n = 6 n = 8
- high n = 10 n = 9
BDI-II = Beck Depression Inventory, 2nd edition; LEIDS = Leiden Index for
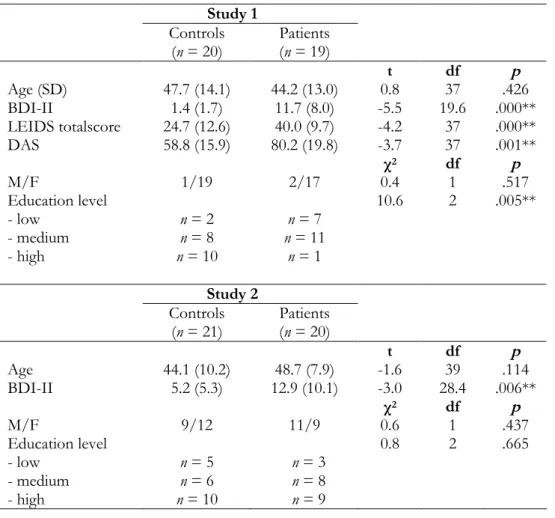
Table 2. Clinical characteristics of both patient groups (mean ± SD)
Study 1 (n = 19) Study 2 (n = 20) HAM-D17 7.7 ± 3.6 [range 1-13] 5.6 ± 3.8 [range 0-13]
Type of medication
- SSRI n = 13 n = 13 †
- SSNRI n = 6 (150-375 mg) n = 7 (75–225 mg)
Type of remission1:
- partial remission n = 8 n = 13
- full remission n = 11 n = 7
Duration of remission
(months) ± SD [range 1-102]13.1 ± 22.3† †
5.9 ± 5.6 [range 1-24] Number of episodes ± SD 4.9 ± 4.1 [range 1-15] 4.8 ± 4.4 [range 1-16]
Single / recurrent episode(s) 2 / 17 4 / 16
Diagnosis, subtype2:
- MDD, melancholic - MDD, atypical - MDD, seasonal
pattern
- Not melancholic,
atypical or catatonic
n = 16
n = 1
-n = 2
n = 11
n = 6
n = 2
n = 1
HAM-D = Hamilton Rating Scale for Depression; SSRI = Selective Serotonin Reuptake Inhibitor; SSNRI = Selective Serotonin and Noradrenalin Reuptake Inhibitor; † two SSRI treatment free for 1 month; 1: according to the criteria of Frank
et al. 1991; †† this wide range is caused by one patient who had been recovered for
over 8 years; without that patient the range is [1, 21]; 2: subtype of most recent
Cognition
See Table 3a for the cognitive tests of study 1.
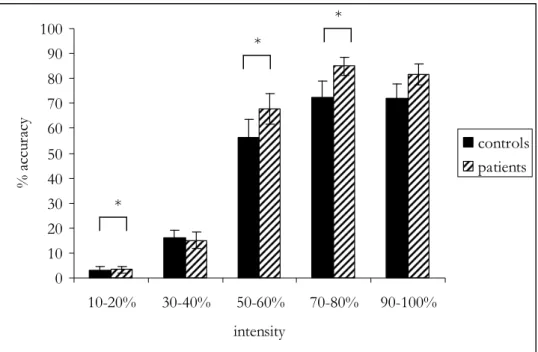
Facial Expression Recognition test: Only a significant effect of Emotion (F(3.9,137.6) = 10.3 , p < .001) was found on the overall accuracy data, indicating that participants were better at recognizing certain emotions compared to others (see Figure 1). The main effect of Group was not significant (F(1,35) = 1.5, p = .233). Separate analyses per Emotion revealed a significant effect of Group (F(1,35) = 5.5, p = .024) for the recognition of fear, indicating that remitted depressed patients were better at recognizing facial expressions of fear compared to controls. Univariate analyses on fear accuracy per intensity level (in five 20% blocks) showed that the effect of Group was significant or borderline significant for all levels, except for the 30-40% intensity level: 10-20% F(1,35) = 4.2, p = .049; 30-40% F(1,35) = 0.1, p= .788; 50-60% F(1,35) = 4.1, p = .049; 70-80% F(1,35) = 7.2, p = .011; 90-100%
F(1,35) = 4.1, p = .051 (see Figure 2). No significant main and interaction effects were found for the other emotions.
Regarding the reaction time data, a significant effect of Emotion was found (F(2.7,88.0) = 4.1, p = .011). The main effect of Group was not significant (F(1,33) = 0.0, p = .834). When analyzed per emotion, no significant effects of Group or Group x Emotion were found.
Table 3a. Cognitive tests of Study 1, presented as means (SD)
Controls
(n = 20) Patients(n = 19) F df p Verbal memory (WLT)
immediate recall
# correct 52.0 (9.0) 49.6 (11.0) 0.3 1,34 .581
delayed recall
# correct 11.1 (2.2) 10.8 (2.7) 1.3 1,35 .260
Verbal Fluency
# correct 12.4 (3.6) 9.9 (3.5) 0.03 1,35 .868
IAT Neutral2
RT congruent (ms) 685.7 (107.8) 663.3 (126.4) 2.4 1,35 .134 RT incongruent (ms) 1139.8 (271.2) 1049.0 (273.6) 1.1 1.35 .294 IAT Emotional
RT congruent (ms) 828.6 (209.2) 897.3 (304.2) 0.1 1,35 .717 RT incongruent (ms) 742.4 (111.8) 847.4 (245.3) 0.1 1,35 .816 Dot-probe
AB depressive
-positive (ms) -2.3 (20.5) -1.3 (22.9) 0.0 1,35 .904
AB anxious - neutral
(ms) -1.4 (18.1) -6.0 (16.5) 0.4 1,35 .524
FERT
- Accuracy 1.5 1,35 .233
Anger 1.6 (0.8) 1.7 (0.6) 0.5 1,35 .505
Fear 1.8 (0.6) 2.0 (0.5) 5.5 1,35 .024*
Sadness 1.3 (0.8) 1.4 (0.7) 1.3 1,35 .268
Happiness 2.7 (0.4) 2.8 (0.3) 0.2 1,35 .669
Disgust 2.5 (0.5) 2.5 (0.6) 0.0 1,35 .836
- Speed (ms) 0.0 1,33 .834
Anger 1061.1 (344.2) 1205.2 (305.4) 0.1 1,34 .783
Fear 1123.9 (525.6) 1212.1 (464.9) 0.3 1,35 .578
Sadness 1459.6 (495.5) 1514.2 (981.0) 0.3 1,34 .568
Happiness 805.1 (190.5) 870.9 (233.6) 0.0 1,35 .999
Disgust 907.8 (263.1) 1114.9 (691.3) 0.4 1,35 .542
AB = attentional bias, FERT = Facial Expression Recognition Test, IAT = Implicit Attitudes Test, RT = reaction time, WLT = Word Learning Test, * p < .05, F values present the main effect of Group; 2: analyses without one outlier are presented. All
Figure 1. Facial emotion recognition for controls and remitted depressed patients (Mean ± SEM)
0 10 20 30 40 50 60 70 80
fear anger disgust happiness sadness emotion
%
a
cc
ur
ac
y
controls patients
Figure 2. Fear accuracy over the different intensity levels (Mean ± SEM)
0 10 20 30 40 50 60 70 80 90 100
10-20% 30-40% 50-60% 70-80% 90-100%
intensity
%
a
cc
ur
ac
y
controls patients
* p < .05
*
*
Study 2:
Data screening:
One patient missed all 4- and 5-step problems of the TOL. One control participant missed all 5-step problems of the TOL. Data for another control participant are missing for all positive words on the Emotional Stroop task. Cases with missing data were omitted separately by analysis. Outliers were found on the APRT, Stroop CWT, and Emotional Stroop test. Analyses were conducted with and without statistical outliers, however results were similar. The Verbal Fluency data were successfully log 10 transformed because of a non-normal distribution.
Participants:
Twenty-one controls and twenty remitted depressed patients were included in this study. The control group did not differ from the patient group in terms of gender, age and education level. Past comorbid diagnoses in the remitted depressed patient group were Panic disorder (n = 3, of whom one in partial remission), Social phobia (n = 1) and Anorexia nervosa (n =1).
Self-report
The remitted group had higher BDI-II scores compared to the control group (F(1,39) = 9.19, p = .004).
Cognition
See Table 3b for the cognitive tests of study 2.
perform worse than controls at recognition of abstract visual information from long term memory.
Discussion
The current results indicate that medicated remitted depressed patients show an increased recognition of facial expressions of fear compared to healthy controls, even after statistical correction for differences in depressive symptoms. Also, patients scored higher on a self-report measure of cognitive reactivity and performed worse than controls at a task measuring recognition of abstract information from long term memory. No other residual cognitive impairments were found on a wide range of tests, despite the fact that the patients still suffered from residual depressive symptoms and were relatively chronic. The BDI-II scores of patients were higher than those of healthy controls, although both groups’ scores were within the normal range (Van der Does, 2002b). These findings support the view that most cognitive deficits associated with depression are associated with clinical status, rather than a persisting vulnerability factor (Weiland-Fiedler et al., 2004). Some deficits may be more persistent however, and the higher cognitive reactivity scores suggest that the deficits may have become ‘latent’.
Table 3b. Cognitive tests of Study 2, presented as means (SD) Controls
(n = 21) Patients(n = 20) F df p Verbal Fluency
# correct 10.4 (3.9) 12.1 (5.1) 0.1 1,38 .720
Stroop CWT
Condition I (ms) 567.0 (76.9) 552.5 (72.8) 0.2 1,38 .664 Condition II (ms) 487.5 (62.5) 490.2 (56.0) 0.1 1,38 .784 Condition III (ms) 775.7 (156.4) 792.0 (109.8) 0.0 1,38 .906
Interference (%) 47.3 (23.8) 52.3 (16.7) 0.1 1,38 .774
Emotional Stroop Task
Negative words (ms) 712.3 (88.2) 749.6 (115.0) 0.0 1,38 .895 Neutral words (ms) 693.7 (91.4) 722.5 (74.3) 0.1 1,38 .741 Positive words (ms) 702.1 (124.1) 705.3 (83.4) 0.1 1,37 .729 Interference negative
(%) 3.1 (9.2) 3.7 (9.9) 0.1 1,38 .780
Interference positive
(%) 1.7 (10.7) -2.3 (6.7) 1.1 1,37 .295
Left/right task
Congruent (ms) 634.9 (94.2) 678.4 (58.9) 0.9 1,38 .353
Incongruent (ms) 652.0 (97.7) 700.4 (54.6) 2.0 1,38 .168 Tower of London
- % correct 0.3 1,36 .584
2 steps 88.1 (17.5) 84.5 (16.7)
3 steps 85.2 (19.4) 78.5 (11.8)
4 steps 72.9 (15.5) 75.8 (21.2)
5 steps 65.0 (24.0) 54.7 (29.9)
- RT (ms) 0.1 1,36 .812
2 steps 5337.3 (1190.4) 6733.6 (2001.4) 3 steps 7359.3 (2424.0) 8101.8 (3388.0)
4 steps 10869.1
(3101.7) (4482.1)11902.9
5 steps 19407.5
(7191.4) (8352.7)17908.7 APRT
A’ STM (%) 83.0 (9.7) 78.3 (11.7) 1.5 1,38 .226
A’ LTM (%) 80.5 (9.9) 74.9 (14.2) 5.0 1,38 .030*
RT STM (ms) 2164.2 (805.6) 2308.0 (802.9) 0.8 1,38 .380
RT LTM (ms) 1976.4 (715.5) 2107.9 (597.3) 0.1 1,38 .808
The finding of the current study that the difference between remitted depressed patients and controls in DAS scores became non-significant after controlling for residual symptoms is in line with Miranda et al. (1990) who have already shown that dysfunctional attitudes are mood-state dependent for subjects with a history of depression. The group differences on the LEIDS, which aim to measure reactivity of cognitions, remained significant after correction. The current findings therefore suggest that some of the other cognitive deficits might also be more easily triggered in remitted depressed patients than in never-depressed individuals. In line with our findings, Gemar et al. (2001) did not find any baseline differences when they studied implicit attitudes in formerly depressed and never depressed subjects. Only after a sad mood induction, a shift was found toward a negative evaluative bias in the formerly depressed group, again supporting the suggestion that cognitive impairments may become latently present following clinical recovery.
family history of depression. Biases in the processing of emotional information may thus be a stable trait characteristic, even occurring before the onset of a first depressive episode (Leppänen, 2006; review).
Finally, the finding that the remitted depressed patients performed worse on a test measuring recognition from long-term visual memory is in line with previous studies which have shown persisting impairments in memory processes in euthymic patients (Marcos et al., 1994.)
In the current studies, remitted depressed patients were not impaired on tests measuring attentional bias. Studies in recovered depressed subjects mainly used the Stroop Colour Word task to measure attentional bias. Both Paradiso et al. (1997) and Trichard et al. (1995) found persisting impairments in Stroop performance in recovered depressed patients. Attentional bias is thought to be not only a symptom of depression, but also to be important in the development and maintenance of depressive disorders (Williams et al., 1996). Our results do not support this position, since no impairments were found on neutral and emotional Stroop interference as well as on attentional bias measured with the Dot-probe test. However, the literature on attentional bias in depression is contradictory, which may be explained by the differences in stimulus presentation- times (Mathews et al., 1996; Mogg et al., 1995). Studies using the Dot-probe test have found attentional biases in depression using relatively long stimulus presentations (1 sec or more) (Mogg et al., 1995). When stimuli are presented for shorter durations, results are mixed (Bradley et al., 1997; Mathews et al., 1996). Our stimulus presentation time of 500 ms. was probably not optimal to detect group differences.
Serotonergic antidepressants may have some sedative side effects, but these tend to wear off in the first two weeks of treatment (Amado-Boccara et al., 1995) and the effects on memory and psychomotor performance are of low intensity (Gorenstein et al., 2006; Thompson, 1991). In contrast, SSRIs have been found to positively affect neutral and emotional information processing acutely and after 7 to14 days (Bhagwagar et al., 2004; Harmer et al., 2002; Harmer et al., 2003a; Harmer et al., 2004; Harmer et al., 2006a). However, unmedicated recovered depressed patients also did not show any differences in neutral information processing compared to healthy controls (Booij et al., 2006a), although these groups did differ on cognitive reactivity (Merens et al., 2005). The latter studies used a considerable younger and less chronic sample however. How chronic SSRI use affects emotional processing is still unclear, so it may be possible that some cognitive impairments were remediated by SSRI treatment.
It also has to be considered that the lack of differences between groups in the current study may have been caused by insufficient statistical power. Sample sizes in both studies are relatively small and replication in larger samples is warranted. The fact that both patient groups were not completely asymptomatic only strengthens our conclusion that remitted depressed patients do not suffer from many cognitive impairments. Also, remission status (partial vs. full) did not affect the facial expression recognition data.
3
The effects of a diet enriched with
alpha-lactalbumin on mood and cortisol response
in unmedicated recovered depressed
subjects and controls
Abstract
Introduction
There is abundant evidence that serotonin (5-hydroxytryptamine; 5-HT) plays an important role in stress-related disorders such as major depression (Maes & Meltzer, 1995; Meltzer & Lowy, 1987). For instance, medications that augment 5-HT activity, such as selective serotonin reuptake inhibitors and monoamine oxidase inhibitors, are effective antidepressants (Blier & de Montigny, 1998; Nutt et al., 1999). Furthermore, experimental depletion of the 5-HT precursor L-tryptophan induces symptoms in depression-vulnerable subjects (patients in remission or family members of patients) but not in healthy subjects (Bell et al., 2001; Van der Does, 2001a). Conversely, tryptophan administration increases 5-HT synthesis in the brain in both human subjects and rats, and these effects are large enough to influence mood and behaviour (Young, 1996). For example, tryptophan decreased aggression and quarrelsome behaviour, and increased dominant behaviour, in healthy volunteers (Marsh et al., 2002; Moskowitz et al., 2001; Young & Leyton, 2002). In healthy females, tryptophan improved emotion recognition (Attenburrow et al., 2003). Tryptophan also has some therapeutic effect in mild to moderate depression, but it is not effective in more severe depression (Young, 1986; Young, 1996). It is clear, however, that boosting or depleting the 5-HT system has opposite effects on mood, although some of these effects are only observable in depression-vulnerable subjects.
effective and feasible, dietary interventions may comprise a viable addition or alternative to antidepressant medications. A carbohydrate-rich/protein-poor diet has been shown to increase the ratio of tryptophan/large neutral amino acids (LNAA). The diet prevented stress-induced mood deterioration and cortisol response in individuals vulnerable to stress (defined by high neuroticism scores; Markus et al., 1998). Carbohydrate-rich/protein-poor diets are, however, not healthy on a day-to-day basis (Christensen, 1997), and even a small amount of protein blocks the rise of tryptophan/LNAA.
Recently, an even larger effect on stress response was obtained with a diet containing tryptophan-rich alpha-lactalbumin protein. Alpha-lactalbumin has the highest tryptophan concentration of all protein fractions (Heine et al., 1996). This diet increased plasma tryptophan/LNAA by 43–48%, which is twice the augmentation found with a carbohydrate- rich/protein-poor diet (Markus et al., 2000; Markus et al., 2002), or after 7 d of daily tryptophan treatment (Chouinard et al., 1985). Alpha-lactalbumin had no side-effects, and improved mood and attenuated cortisol responses to stress in stress-vulnerable subjects (students with high neuroticism scores) but not in controls (low neuroticism; Markus et al., 2000). Orosco et al. (2004) found that alpha-lactalbumin had an anxiolytic effect in rats and increased 5-HT turnover in hippocampal areas. Since depression-vulnerable individuals are most likely to be affected by 5-HT manipulations, it seems worthwhile exploring the effects of alpha-lactalbumin in this group.
Furthermore, we expected these effects to occur only in the depression-vulnerable group.
Materials and methods
Subjects
Eligible subjects were between 18 and 65 years of age and had either a history of a major depressive episode (patient group) or no history of mental disorder and no first-degree relative with a major depressive disorder (control group). Subjects were euthymic and were selected not on the basis of neuroticism scores (Markus et al., 2000; Markus et al., 2002) but on a history of depression. Approximately 60% of people with high neuroticism scores actually develop a depression (Gallagher, 1990; Kendler et al., 2004; Ormel et al., 2001). Since long-term studies have shown that up to 85% of recovered depressed patients experience a recurrence (Mueller et al., 1999), a past history of depression is a better marker of vulnerability.
In both groups, exclusion criteria were: current mental disorder; past psychotic disorder; substance abuse in the past 3 months or excessive dieting or binge eating, as defined by the Diagnostic and Statistical Manual of Mental Disorders-IV (DSM-IV; American Psychiatric Association, 1994). Furthermore, subjects in both groups had low levels of depressive symptoms (Montgomery Asberg Depression Rating Scale (MADRS score < 8), were not colour-blind or dyslexic, had been free of antidepressant medication for at least three months, had a normal body weight (BMI 18–27 kg/m2), kept to a regular
pre-menopausal women taking a contraceptive pill participated during the period in which they actually took the pill. The groups were matched on gender, age and education level.
Design
The study was conducted according to a double-blind crossover design. Subjects were given balanced isoenergetic meals containing alpha-lactalbumin-enriched whey protein or casein protein (placebo). Treatment order was balanced over two sessions, separated by four weeks.
Instruments
Standardised, validated instruments were used to assess diagnosis, depressive symptoms, mood states and personality. The Structured Clinical Interview for DSM-IV (First et al., 1995) was used to verify diagnostic inclusion and exclusion criteria. Depressive symptoms were measured with the MADRS (Montgomery & Asberg, 1979), a ten-item interviewer-rating scale, and the self-rating Beck Depression Inventory (BDI-II; Beck et al., 1996; Van der Does, 2002b).
also have a self-devaluative denotation (e.g. useless, a failure). Cognitive reactivity is the ratio of the endorsed self-devaluative and objective items (Teasdale & Cox, 2001). The Leiden Index of Depression Sensitivity is a self-rating scale of cognitive reactivity, with subscales ‘hopelessness’, ‘rumination’, ‘harm avoidance’, ‘aggression’, ‘control/ perfectionism’ and ‘acceptance/coping’ (Van der Does, 2002a).
Procedure
Depressed patients who had participated in a psychotherapy trial 1–2 years earlier were sent information and invited to participate. Subjects were also recruited through advertisements in a local newspaper, and through advertisements and leaflets at the local mental health centre and at several university buildings. Individuals who expressed interest were interviewed by telephone. If the inclusion and exclusion criteria appeared to be met, more information was sent, and people were invited for a screening session at the hospital, during which the Structured Clinical Interview for DSM-IV and MADRS was administered by trained clinical psychologists. Information about previous antidepressant treatments and the course and duration of depressive episodes was also obtained, and questionnaires were completed. Subjects gave informed consent to participate prior to filling out the questionnaires. The first session was scheduled for approximately 1 week after the screening session, or somewhat later depending on the menstrual cycle phase.
2006a). During the day, two blood samples and four cortisol samples were taken. The session finished at around 3.30 pm, and subjects were instructed to resume their regular meals. The outline of sessions is shown in Table 1. Subjects were paid € 80 for participation. Subjects were tested individually at a clinical research unit of Leiden University Medical Centre.
Table 1. Scheme of the sessions
Time (hrs) Assessment
09.00 am t -1 Arrival, BDI-II, DSC, POMS, blood sample
10.00 t 0 Breakfast
12.00 t 2 Lunch
1.30 pm t 3.5 Cortisol (1), blood sample, POMS, DSC
2.35 t 4.5 Cortisol (2), POMS,
2.40 Stress Induction
3.00 t 5 Cortisol (3), POMS, DSC
3.10 t 5.2 Cortisol (4), Debriefing
BDI-II = Beck Depression Inventory-II; DSC = Depressed States Checklist; POMS = Profile of Mood States
Intervention
appearance and in macronutrient content with the exception of the composition of the chocolate-flavoured drink, for which the protein sources differed. Apart from breakfast and lunch, subjects were only allowed to drink water and one cup of tea or coffee.
The nutrient composition and amino acid profile of both chocolate drinks are displayed in Table 2. The amounts of tryptophan in the alpha-lactalbumin and casein diets were 12.3 g/kg (tryptophan/LNAA 8.7) and 9.5 g/kg (tryptophan/LNAA 4.7), respectively. The chocolate drink was prepared within 20 min before breakfast (first drink) and 20 min before lunch (second drink). To compensate for any taste differences, sugar was added to all the drinks (10 g; see Table 2). All meals were supervised to make sure that all foods were consumed.
Table 2. Composition of the chocolate drinks used in the alpha-lactalbumin and casein diets
α-lactalbumin diet casein diet Composition (g)
α-lactalbumin-enriched whey protein 20 0
Sodium caseinate 0 20
Cocoa 3.5 3.5
Granulated Sugar 10 10
Water 200 200
Amino Acid Profile (g/kg)
Isoleucine 27.61 31.80
Leucine 47.56 59.31
Phenylalanine 20.80 32.24
Tyrosine 16.82 33.13
Valine 29.52 44.09
Tryptophan 12.32 9.51
Tryptophan/LNAA (weight %) 8.70 4.70
Stress task
An impossible mental arithmetic task, performed under noise stimulation, was used as an experimental stressor. Subjects were given eighteen successive 1 min trials, during which they had to do mental arithmetic under time constraints, while different levels of industrial noise (65, 70 or 80 dB) were presented through a headphone. Multiple choice questions were presented on a computer screen one at a time. A specified number of calculations (called the criterion) had to be solved correctly. Subjects were led to believe that they could control the intensity of noise by their performance. If they failed the criterion, the computer would set the noise level higher during the next trial; if, however, they met the criterion, they could choose the noise level themselves. Before the actual test, subjects were given two practice trials during which they had to solve a few calculations without noise and then with each of the three noise levels successively. The credibility of the task as well as motivation were enhanced by providing the subjects with constant on-screen feedback about the criterion in a particular trial, the number of calculations correctly solved and the time left for that trial.
Salivary cortisol
Cortisol samples were obtained with the Salivette sampling device (Sarstedt, Nümbrecht, Germany). With this procedure, saliva was collected in small cotton swabs and stored in special Salivette tubes at -30 °C until centrifugation. Saliva samples were centrifuged at 3000 rpm for 3 min at 20 °C. Cortisol concentrations were determined without extraction using a competitive chemiluminescence immunoassay.
A 20 μl sample of saliva was pipetted into microtitre plate wells coated with rabbit anti-cortisol antibodies. After the addition of 100 μl cortisol conjugated with horseradish peroxidase (enzyme conjugate), the mixture was incubated for 3 h at room temperature, and the cells were washed to stop the competition reaction. After addition of the chemiluminescence substrate solution containing peroxide and luminol, luminescence measurements were performed using a Berthold microtitre plate luminometer (Medical Laboratories, Mönchengladbach, Germany).
Blood assessments
means of ion-exchange chromatography and ninhydrin derivatisation on a Biochrom 20 automated amino acid analyzer (Pharmacia, Uppsala, Sweden) using standard conditions for physiological amino acid separation.
Statistical analyses
Group differences in demographic characteristics were examined with independent-sample t-tests. The effects of the interventions on cortisol response were analysed by means of repeated-measures ANOVA using general linear models. Within-subjects factors were Intervention (alpha-lactalbumin v. casein) and Time of assessment (before and after stress); the between-subjects factor was Group (recovered depressed v. controls). All mood scores were analysed using non-parametric tests (Wilcoxon and Mann–Whitney U). A test was considered to be significant when the p value was .05 or less. SPSS 11.5 (SPSS Inc., Chicago IL, USA) was used.
Ethical considerations
Results
Data screening
A very small number of missing values on items of the symptom questionnaires were replaced by the grand mean. No statistical outliers were detected. Twenty-two blood samples (13% of the total) were not available owing to difficulties with venepuncture. The amino acid levels and ratios were all normally distributed. Cortisol values and the scores on the mood subscales were not; these data were log10 transformed. Subscales of the POMS and DSC
were analysed using non-parametric tests as the data were highly skewed and transformations were unsuccessful.
Sample characteristics
Table 3. Demographic and clinical characteristics (Mean ± SD) Recovered
depressive (n = 23)
Healthy controls
(n = 20) Recovered vs. controls
t / Z df p
Age 30.0 ± 9.7 27.0 ± 10.1 .99 41 .32
Female % 91.3 85 (χ²) .41 1 .52
Education level¹ 4.9 ± .8 5.1 ± .6 -1.07 41 .29
BMI (kg/m2) 22.8 ± 2.5 21.7 ± 2.1 1.60 41 .12
MADRS 1.3 ± 1.6 0.8 ± 1.6 1.03 41 .31
BDI-II 4.4 ± 4.5 1.5 ± 2.2 2.83 41 .008
EPQ-R
- Psychoticism 3.2 ± 1.7 2.6 ± 1.3 1.29 41 .20
- Extraversion 7.6 ± 3.4 9.7 ± 2.3 -2.31 41 .03
- Neuroticism 5.6 ± 2.3 2.6 ± 2.0 4.43 41 < .001
- Social desirableness 5.7 ± 2.1 5.8 ± 2.1 -.10 41 .92 LEIDS
- Hopelessness 4.6 ± 3.0 1.4 ± 1.0 4.76 41 < .001
- Aggression 5.8 ± 3.9 3.1 ± 3.1 2.45 41 .02
- Perfectionism 8.0 ± 4.7 4.1 ± 3.3 3.18 41 .003
- Harm avoidance 9.5 ± 4.8 3.5 ± 2.6 5.23 41 < .001
- Rumination 10.7 ± 4.9 5.6 ± 2.5 4.39 41 < .001
- Acceptance/coping 2.2 ± 3.9 1.0 ± 1.7 1.38 41 .18
- Total score 40.8 ± 18.9 18.5 ± 9.8 4.94 41 < .001
DSC
- Affective 26.5 ± 9.8 21.1 ± 5.0 1.79 .07
- Self-devaluative 22.0 ± 6.6 17.0 ± 2.6 2.42 .02
MADRS = Montgomery-Asberg Depression Rating Scale; BDI-II = Beck Depression Inventory-II; EPQ-R = Eysenck Personality Questionnaire-Revised; LEIDS = Leiden Index of Depression Sensitivity; DSC = Depressed States Checklist.
Significant baseline differences between the groups were found on the POMS depression (Z = -2.21, p = .03), POMS Fatigue (Z = -2.06, p = .04), POMS total (Z = -2.31, p = .02) and DSC self-devaluative (Z = -2.42, p = .02) subscales. Trends were found for POMS tension (Z = -1.77, p = .08) and DSC affective (Z = -1.79, p = .07). The recovered depressed subjects had higher scores on all these subscales. On the Eysenck Personality Questionnaire, groups differed on extraversion (F(1,41) = 5. 32, p = .03) and neuroticism (F(1,41) = 19.6, p < .001). The neuroticism scores of the recovered depressed group were above average to high, according to published norms for Dutch populations (Sanderman et al., 1995). The two groups also differed on most subscales of the Leiden Index of Depression Sensitivity. After controlling for depressive symptoms (BDI-II), only the following subscales remained significant: neuroticism (F(1,40) = 12.9, p = .001), and the Leiden Index of Depression Sensitivity subscales of hopelessness (F(1,40) = 13.6, p = .001), control/perfectionism (F(1,40) = 5.6, p = .02), harm avoidance (F(1,40) = 16.5, p < .001), rumination (F(1,40) = 10.5, p = .002) and total (F(1,40) = 13.9,
p = .001).
Table 4. Clinical characteristics of the recovered depressed subjects
Mean SD Age of onset (years) 19.9 7.7 Number of episodes 2.0 0.9
Antidepressant medication (past) 34.8 %
Antidepressant treatment (ever) 78.3 %
Family history (1st degree) of major
depressive disorder 47.8 %
Effect of dietary manipulations on amino acids
As shown in Table 5, plasma tryptophan concentrations and tryptophan/LNAA did not differ at baseline between groups. Repeated measures analyses with Intervention and Time as within-subjects factors and Group as between-subjects factors on tryptophan/LNAA revealed a significant effect of Intervention (F(1,29) = 84.3, p < .001). Tryptophan/ LNAA increased significantly by 20.9% compared to baseline after the alpha-lactalbumin-diet and decreased by 30.0% after the casein diet. The relative rise of tryptophan/LNAA was 73.8% higher after alpha-lactalbumin than after casein. We also found significant effects of Time (F(1,29) = 7.1, p = .013) and of the Intervention x Time interaction (F(1,29) = 193.3, p < .001). There was no main effect of Group, nor any interaction effects involving Group.
Table 5. Plasma tryptophan (μmol/l) and tryptophan/LNAA ratio (Mean ± SD)
casein alpha-lactalbumin
morning 50.5 ± 11.2 50.8 ± 10.1
Tryptophan
afternoon 57.3 ± 8.9 87.9 ± 14.5
morning .11 ± .02 .11 ± .02
Tryptophan/LNAA
afternoon .08 ± .01 .13 ± .02
Effects of stress on cortisol
Two cortisol samples were collected after the stress task, t5 (directly after
stress) and t5.2 (10 minutes later). The highest cortisol level of these two was used in the analyses (tmax). Repeated measures analyses with Intervention and
between-subjects factor, on cortisol levels did not reveal the expected interaction of Intervention x Group x Time (F(1,41) = 0.1, p = .71). We did, however, find a significant main effect of Time (F(1,41) = 9.7, p = .003), reflecting an increase in cortisol levels after stress. No other main or interaction effects were found. Cortisol levels are shown in Table 6.
To check for any order of intervention effects, Order, instead of group, was included in the analysis as a between-subjects factor. No interaction effect of Order x Intervention was found (F(1,41) = .01, p = .93). A trend for an interaction effect of Intervention x Time x Order was found (F(1,41) = 3.4, p
= .07), caused by the fact that cortisol did not rise after stress for subjects who had the alpha-lactalbumin diet on the second day. Alpha-lactalbumin did not have this protective effect for subjects who had that diet on the first day.

![Table 2. Clinical characteristics of both patient groups (mean ± SD) Study 1 (n = 19) Study 2 (n = 20) HAM-D 17 7.7 ± 3.6 [range 1-13] 5.6 ± 3.8 [range 0-13]](https://thumb-us.123doks.com/thumbv2/123dok_us/8263071.2189090/37.722.87.627.127.510/table-clinical-characteristics-patient-groups-study-study-range.webp)