Efficiency and Reform Group
Commentary to Back Office
Benchmarking the Back Office: Introduction
Executive Summary
This report provides the detailed data and the analysis arising from the second
annual Back Office Benchmarking survey, commissioned in April 2010 and
considering the Financial Year from April 2009 to March 2010.
The data provided has been gathered as management information, to be used
internally in support of improvement planning and activities. This data is not a
National Statistic or an Official Statistic and therefore does not necessarily comply
with the Code of Practice for Official Statistics.
Readers should be aware that, although individual department data may provide a
fair representation of an individual department in isolation, there are significant
problems in coming to an aggregate picture of government’s performance, or in
comparing between departments. There are three principle reasons for this:
1. First, in most cases the process for data collection has been manual and
required high degrees of human intervention, with comparatively low levels of
quality assurance - rather than for example relying on automated extracts of
audited data from department accounts.
2. Secondly, the data gathering process has uncovered significant variation in
the application of accounting and data standards across government that
make it difficult to compare across departments meaningfully.
3. Thirdly in several cases, the metrics used are new, or defined differently from
those used last year – so it is not meaningful to compare across years.
These differences result in some significant unexplainable variations in apparent
departmental performance:
- One metric varies between 1.5% and 105%
- The apparent variance of the cost of the Finance function per capita is
5,000%
- The apparent variance of the cost of the HR function per capita is over
3,000%
- The apparent variance of the cost of procurement is over 2,000%
- In several cases, year on year cost for the same function apparently
varies by over 1,000%.
Some of this difference is derived from genuine, fundamental differences between
operating models. The cost structure of a large service delivery organisation focused
on administering benefits will be completely different to that of a small organisation
focused on procuring large capital projects, for example transport projects.
In other cases, the variance is driven by lack of comparability between data sets
because of systemic differences, including:
- Differences in the way that departments allocate overhead costs. For
example, Department A may include the cost of IT within their calculations
of functional cost. Executive Agency B may separate IT costs in their
accounts.
- Differences in the application of central standards and definitions across
departments. The wide variance in cost between apparently like
departments underlines the differences between how departments have
applied central standards.
All Central Government organisations with over 250 staff were asked to provide data
against standard metrics on their key back office functions: HR, Finance,
Procurement, ICT, Property, and for the first time, Communications, Legal and
Knowledge & Information Management. 129 organisations responded, representing
87% of those with more than 250 staff or about 28% of all central government
organisations with budgets.
Back office functions across central government manage financial, estates, IT and
intellectual property assets and human resources valued in their hundreds of billions.
The estimated cost of running these back office functions themselves is around £2bn.
In this analysis, most functions focus principally on the cost and quality of the back
office function itself; however in other cases there is a focus on the assets managed,
for example in the case of property, the government estate is analysed.
Each back office function was led last year in government by a Head of Profession, a
senior civil servant with responsibility for directing policy and strategy within each
specific profession. In this report, Heads of Profession have analysed the data and
set out their findings in each section below. Alongside this we are publishing the
underlying data from all responding organisations on www.data.gov.uk.
The Cabinet Office is taking urgent action to address these issues, working with HM
Treasury, the Number 10 Implementation Unit and other bodies to establish a set of
criteria that support meaningful comparison across departments in a manner that
minimises duplication and intervention from departments.
The indicators used draw on the Public Audit Forum indicators and HMG will
continue to work with the National Audit Office to ensure alignment with the Public
Audit Forum Indicators. This work will fall under the remit of the Efficiency and
Reform Board, co-chaired by the Chief Secretary to the Treasury and the Minister for
the Cabinet Office.
Benchmarking the Back Office: Finance Profession
The current drive for fiscal consolidation places the finance profession in a unique
position in its role as a facilitator and enabler of informed decision making.
Benchmark reporting generates the information requirement but it is also our
responsibility to assist in the appropriate use of the information and drive
improvement. The finance benchmarks detailed below have been selected to
measure the cost, quality and capability of the finance function and support our core
principles of transparency and accountability (detailed definitions are available in
Annex 1).
1. Percentage Cost of Finance Function:
Cost of Finance Function divided by Organisation Running Cost
This indicator shows the cost of running the finance function in relation to the
resources that are used by the organisation as a whole to deliver its
responsibilities. Private sector benchmarks indicate a target of c.1%;
however, it is important that departments’ results are not taken out of context
with the nature of their activities in applying this benchmark.
2. Finance Function Cost per FTE:
Cost of Finance Function per total organisational (full time) employee
Indicators are often expressed as revenue or cost “per employee”; this is a
commonly used private sector indicator.
3. Report Cycle Time:
Number of Days Taken to Provide Meaningful Financial Information
This indicator is intended to provide a measure of the quality of the finance
function, for which provision of useful information in a timely manner should
be a high priority.
4. Percentage of Finance Qualified:
Number of Professionally Qualified Finance Staff divided by Total
Finance Staff
This indicator identifies the main areas of finance in which qualified
professionals are working. It is used to assess the capability of the finance
function and the degree to which qualified professionals are in positions
where they can provide best value to the organisation.
Quality of Data
The benchmarking process remains challenging in terms of information gathering
and consistent application of definitions. This year’s dataset is more reliable than
2009 due to greater familiarity with the exercise and awareness of how to apply the
definitions but there are inconsistencies in the year on year position due to, for
example, changes in the interpretation of definitions. These issues will continue to
be addressed as the process is further developed but the following points should be
noted:
Organisational running cost
is a denominator for benchmarks across all
professions; in 2009 and 2010 there has been considerable debate regarding its
definition. To aid comparability the definition requires that grant, programme and
capital expenditure be excluded however, for some organisations this spend is the
primary driver of their finance costs and exclusion therefore impacts the reported
indicators. Appropriate interpretation is required.
Benchmarking has highlighted that the term “grant” is used inconsistently across
central government; moving forward the finance profession will look to align
terminology regarding grant activities. This problem has been particularly relevant to
the Department for Education’s results where organisational running cost has
increased this year. This was due to greater clarity of the definition provided after
they involved the Head of Government Profession for Finance.
Report cycle time
is a subjective indicator which requires further definition to
provide more meaningful comparability across organisations.
Finance cost
includes the charge for any finance related “shared service” facilities
but
headcount
numbers exclude any shared service element so care should be
taken in the interpretation of the results.
Key Trends and Observations
The following data trends are subject to the limitations previously stated in terms of
benchmarking as a process and data quality issues. The year-on-year comparatives
are made on those reporting units submitting a full data set for 2009 and 2010.
On a year-to-year basis, sixty four organisations made savings (totaling
c.£42M) in
Finance costs
in 2010 by driving down consultancy costs and
improving the management of the finance function as a whole.
Overall, based on last year’s published figures, finance costs have increased
in total by c.£30M, DWP and NOMs are the key contributors to this variance.
Both organisations have since re-calculated their 2009 finance cost on a more
accurate basis.
The above is reflected in the
cost of finance per head
metric which has
increased from 2009 to 2010 overall but only by c.£2 per FTE on the
exclusion of DWP and NOMS.
The
percentage cost of finance
metric has decreased or stayed stable; the
exceptions to this are where there have been adjustments to the
interpretation of the organisation running costs within organisations such as
BIS.
Category Size based on Org.
Running Cost
Number within
category
Average Cost of
Finance
Average Finance
cost per FTE
Small
< £50m
24
£612,760
£1,958
Mid/Small
£50m - £100m
35
£1,313,616
£1,766
Mid/Large
£100m - £500m
37
£2,538,017
£1,063
Large £500m
+ 24
£25,621,813
£1,000
Reporting Cycle time
has improved since last year. Some of the
improvement is due to interpretation of definition but there has been a clear
drive across the departments to provide more timely financial information.
Only ten entities now have a reporting cycle of over 10 days versus twenty in
2009.
In the current fiscal climate, the finance profession has an increasingly
important role in driving value for the taxpayer. The number of finance
professionals in central government has increased by about c.175 and,
overall, entities have increased their
percentage qualified staff.
This
indicator is subjective but it does demonstrate a growing recognition of the
important role finance has in facilitating fiscal consolidation.
Cost of finance per FTE
has been added as an indicator this year. This
metric is susceptible to variation according to the cost structure of the
organisation, with smaller procurement-focused organisations reporting
higher cost per FTE then large service delivery organisations.
This second year of the benchmarking process has provided the opportunity to
“quality check” the dataset from 2009 and 2010 and highlight inaccuracies or
inconsistencies. Having two years’ of information also sets a clearer “baseline”
against which to measure.
The data collection process has improved this year and departments have been able
to see more clearly the benefits of benchmarking in driving accountability and
ownership of results.
Next Steps
The finance profession is committed to improving the reporting of benchmarks in a
number of areas:
Automation of data collection
Clarity of definitions
Improved
variance
analysis
Increased
granularity
Over the next year finance professionals across government will continue to drive
cost effectiveness through cross-government initiatives such as shared services and
promulgation of best practice. There is expected to be far more drive toward shared
services that provide value adding services, over and above the transactional level.
It is important that the public sector applies strong financial management to achieve
the savings the Government requires. Finance professionals face a significant
challenge to increase the robustness of their processes and the transparency of
reporting. To achieve this requires strong leadership and, as a profession, the
commitment to build the financial management skill set of every public servant to
deliver value to the taxpayer.
Benchmarking the Back Office: HR Profession
In June 2009 Civil Service HR launched Next Generation HR (NGHR), a
cross-departmental transformation programme to improve the efficiency and effectiveness
of Civil Service HR. The 2009 HR benchmarking exercise provided data from which
to baseline the cost and headcount cross all Whitehall departments, Non-Ministerial
departments and NDPBs. Civil Service HR undertook a complementary, more
detailed, benchmarking exercise covering just the Whitehall departments and their
agencies.
Using the 2009 data as a baseline, NGHR developed a business case aimed at
achieving 50% cost and headcount reductions by the 2013/14 FY. The projected
savings of approximately 5% per annum from current departmental efficiency plans
with full benefits realisation being achieved through the implementation of
cross-departmental Next Generation HR structural changes and improvements.
The current benchmarking exercise has again, been complemented by a more
detailed analysis on a subset of departments. This has enabled Civil Service HR to
assure the data and provide an accurate year to year comparison.
The table below provides a summary of the results and shows that efficiencies
gained in 2009/10 FY are ahead of NGHR projections for departmental efficiency
savings. However, the results also show that the implementation of the NGHR
programme will be required to achieve full efficiency
HMG (Departments and
NDPBs)
Large Depts (95% of Civil
Service)
Size
8 % reduction
13% reduction
Cost
5 % reduction
7% reduction
HR Ratio
49:1 (from 44)
61:1 (from 49)
Cost
£1,263 (Per FTE)
17% reduction
£1,186 (Per head)
12% reduction
The HR benchmarks detailed below have been selected to measure the cost, quality
and performance of the HR function and support our core principles of transparency
and accountability whilst fully integrating with the Next Generation HR Programme
(detailed definitions are available in Annex 1).
1. Percentage Cost of HR Function:
Cost of HR Function divided by Organisation Running Cost
2. HR Function Cost per Head:
Cost of HRFunction per total organisational (full time) employee
3. Ratio of employees (FTEs) to HR Staff:
The ratio of full time equivalent employees to HR staff
4. Average Working Days Lost to Sickness:
Average working days per full time equivalent employee lost through
sickness absence
5. Employee
Experience:
Based on an aggregated view of the Civil Service People Survey scores
Quality of Data
For 2010, Civil Service HR has used HR costs and FTE numbers as the basis for
analysis and comparison making only limited reference to organisational running cost
data. This reflects the general concerns about the quality of data described in the
opening section of this report. For HR, the data collection exercise 2009/10 has
achieved improved quality from 2008/09 data collection. This is due to the clearer
definitions used this year, more commitment from HR Directors and greater familiarity
with the process. Departments have improved their ability to collect accurate
management information and have greater confidence in the data the have provided
in this return.
Key Trends and Observations
Cost of the HR Function
The cost of the HR function as a percentage of organisation running costs has a
range of 1.2% - 2.3%. The high end of the range is typically due to smaller NDPBs
and agencies. For the 5 largest departments, the highest cost is 1.4%; this is due
largely to economies of scale and reinforces the need for the shared expert service
approach of Next Generation HR.
This is also reflected in the Cost of HR per FTE figures (see below), where the larger
departments such as DWP have a cost of £871 per head, compared to the median
cost of £1,514 per head.
Significantly, the average cost of HR per FTE shows a significant improvement from
last year’s benchmark. This is due mostly to planned efficiency improvements within
departments. Some efficiency may be derived from NGHR cost savings in learning
and development but these will be small as the changes only began to take effect in
the latter part of the financial year.
Average for 2008/2009
Large departments Average for 2009/2010
Delivery of HR Services
An aim of the NGHR programme is to deliver HR services more efficiently; a metric to
measure this is the ratio of FTE: HR FTEs. Following the results from last year,
departments were tasked with improving their headcount ratio to achieve results
closer to the industry median of 1:70. The result for all of the organisations last year
was 1:44, for 2009/2010 it is 1:49. Main Whitehall departments and agencies have
improved their headcount ratio to 1:62 and in the 5 biggest departments to 1:67.
Overall Conclusions
These results demonstrate the significant improvements made across Civil Service
HR. Many of the departments have made progress through consolidations of their
services and through greater use of shared services, for example Home Office,
NOMS and Department for Education.
There are still some departments who have not made the same amount of progress,
for example BIS and RPA. However, in both these cases their return for this year has
now accurately captured all their HR staff; this was not the case in the 2008/09
return. Additionally, both these organisations have implemented actions to improve
the efficiency of their HR function which will be reflected in their 2011/12 returns.
Progress will be tracked throughout the year. In the case of RPA a service
transformation is well underway to achieve significant efficiencies which will be
reflected in returns from 2010-11 onwards.
Importantly the results for this year are ahead of the forecasts of Next Generation
HR, reinforcing the evidence of improvement reported by the programme.
Next Steps
Average for 2008/2009 Large departments
Average for 2009/2010 Industry Benchmark
Accelerated implementation of Next Generation HR: The evidence collected
this year and in the previous year reinforces the need for greater collaboration
across government.
Good progress has been made so far by rationalising and consolidating the
delivery of HR services, particularly in the larger departments. However many
organisations, particularly those that are smaller have now achieved the limit
of individually attainable efficiency savings. For these organisations it will be
difficult for them to improve further without detriment to the HR services they
provide.
Therefore a cross government approach, delivered through the NGHR
transformation programme, is essential if all departments are to continue to
make efficiencies and provide the required level of service to their customers.
Benchmarking the Back Office: IT Profession
The IT Profession continues to focus on delivering greater value for money and
improving the delivery of IT-enabled change programmes, by driving the
development of the knowledge, skills and experience of professionals involved with
change and transformation agendas. This will help Government to ensure that
business policy is better defined; to reuse rather than reinvent; and to have a more
focussed, commercial and strategic relationship with core suppliers. The
benchmarking data plays an important role in supporting cross-Government
initiatives to improve the economy and our efficiency and effectiveness in light of
continuing financial challenges.
Overall UK public sector spend on IT is estimated at £16bn.
1This benchmarking
exercise has captured data representing 41% of this figure £6.5bn; meaning over half
of total spend on IT is in the wider public sector. This exercise covers the majority of
Central Government, defined as: (Ministerial) Departments, Agencies,
non-departmental public bodies (NDPBs) and Non-Ministerial Departments.
Quality of Data
The method established by the IT Profession during last year’s analysis
2has been
repeated to enable year-on-year, like-for-like comparisons for the IT benchmarking
indicators, user confidence and capability. As we develop and refine our processes,
the benchmarking has become more fine-tuned and as such we have seen changes
in the definitions and calculation of Operating Expense. For that reason, direct
year-on-year comparisons for Cost of IT are impractical to a degree. IT spend has
however, remained consistent and enables direct annual comparisons to be made.
Definitions and Terminology
Last year, analysis highlighted the varied and complex nature of public sector
organisations. To enable us to drive performance improvements, we compare public
bodies to the most appropriate peer group benchmark, whether public or private
sector from around the world. We also reference analysis from Gartner who collect
benchmarking data on ICT on a global scale.
It is important to note the definitions used by Gartner and the Government IT
Profession vary in the subsequent analysis and commentaries in the following ways:
1.
Terminology:
Gartner refer to ‘
IT Spend
’. We refer to ‘
IT Run and Maintain’
(RaM);
2.
Transformation Cost:
Gartner include spend categorised as ‘transformation’,
which includes some project costs. We have excluded all project cost that
have not yet become business-as-usual, which results in a slight variance
between figures; and
3.
Period comparison:
All Gartner data is for the calendar year 2009 whilst our
data is for Financial Year (FY) 2009/10.
The benchmark indicators for IT are the same as for the previous year.
21.
Cost of IT:
IT spend (RaM) as a percentage of the organisations operating
expense (OpEx). Project costs which are not yet business-as-usual have
been separated;
2.
User Confidence:
Cross-organisation employee survey on whether the IT
provided delivers the business objectives. The scale is 1 (low) to 5 (high); and
1
Source, Operational Efficiency Programme. Final Report
2
3.
Capability:
The skills of IT professionals in line with the SFIA
3framework. An
'excellent' skills match score has been set at 9.2 or above (maximum of 10).
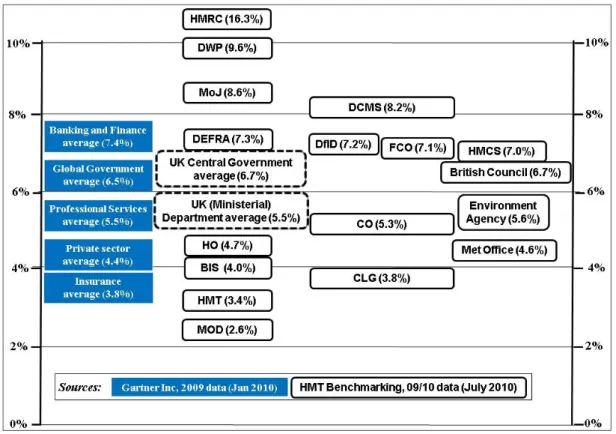
The highlights from the analysis
Figure 1:
Spend on ‘IT run and maintain’ as a percentage of operating expense
Note: all Gartner data is for 2009 (
Source:
Gartner Inc.
). The Government data is for
Financial Year as 2009/10 (
Source:
HMG Benchmarking 2010
).
Figure 1 compares some examples of (Ministerial) Departments, including examples
of Agencies and Non-Ministerial bodies with key private-sector peers. Global analysis
between 2008 and 2009 shows that the collective private sector ‘Cost of IT’ reduced
by an average of 3.3%. Government measurements from around the world showed a
reduction of 0.3% over the same period, supporting the position that governments
continued to invest as part of their economic recovery actions. In comparison, the UK
figures indicate that Central Government has reduced by an average of 0.7%. No
year-on-year comparisons for Spend on IT run and maintain as a percentage of
Operating Expense have been made, due to the change in definitions for calculating
Operating Expense.
3
Figure 2:
Cumulative plot of Central Government IT spend 2009/10,
illustrates the
distribution of the total £6.5bn captured IT spend (
Source: HMG Benchmarking
).
Key trends and observations:
UK Central Government has responded similarly to Global Government in that ‘Run
and Maintain’ IT as a proportion of organisation operating expense has reduced.
Departments are leading the way in reducing this. Gartner data forecast IT Spend as
a percentage of enterprise operating expense to remain flat or increase in 2010 in the
majority of vertical industries, and in every global region. Given the current UK
financial climate, Government spending on IT is likely to reduce due to the project
reviews, the ICT Moratorium, and the contract renegotiation.
The total and average spend on IT ‘Run and Maintain’ is decreasing across Central
Government. However, there has been an increase in total and average project costs
by over a third. We take these two trends together to indicate that IT-enabled
business change projects are already having an impact on departments’ abilities to
deliver more efficient services and savings within IT spend, as well as an increase in
investment to provide savings in the future.
The IT Profession Capability Index versus Stakeholder Confidence Levels has
changed little from last year. Analysis of IT Profession Capability Index figures
indicates an increase from 69% to 82% in the number of organisations achieving an
‘excellent’ skills match between the role profiles and incumbents in their senior
management team. Analysis of the Stakeholder Confidence Levels shows employees
are still satisfied, with an average score of 3.7. The IT Profession has continued to
develop in Government, with the Technology in Business Fast Stream going from
strength to strength and common usage of the Skills Framework for the Information
Age (SFIA) emerging. In the current climate this agenda will continue to be driven
through, and will inevitably grow in importance as public bodies seek to do more with
less, and manage their IT functions in the most efficient and effective way.
Next Steps
Deficit reduction is of primary importance to the Government. As such, the IT
Profession must strive to make further savings and efficiencies where possible. The
first step towards this was the ICT Project Moratorium, which put an immediate stop
on any new ICT spend over £1million. The second step was the ICT Project Review
which was led by the Office of the HM Government CIO and has undertaken analysis
of Government projects valued over £1m but less than £50m, weighing up the
financial cost with the beneficial outcomes. Areas of overlap were also identified,
highlighting where there may be scope for re-use between departments and
therefore where even more potential savings could be made. Work is already
underway to stop or re-shape projects, totalling over £1bn and to strengthen the
governance of IT-enabled change projects. The third aspect to this is the Contract
Renegotiation, where contracts with all major Government ICT suppliers are being
reviewed, and savings achieved.
By using benchmarking data we are helping Departments to understand their IT
spending in context. Together we are setting goals aimed at achieving even greater
savings, through business planning and using peer group comparisons to identify
further reductions in spend between 20-40% in IT Spend over the Spending Review
period. We are also seeking to ensure that such plans align with the principles of a
government-wide technology strategy that seeks to accelerate progress with greater
standardisation and simplification. Government transparency is an equally important
aim for the IT Profession. It shares the view that openness not only reinforces the
trust in government through accountability, but also enables new opportunities to be
realised, ranging from obtaining further savings, to developing innovative public
services. The IT Profession is leading the way in being open about the data it collects
through publication, such as the ICT Project Review that all are able to access.
Benchmarking the Back Office: Procurement Profession
The procurement benchmarks detailed below have been selected to measure the
cost, quality and capability of the procurement function and support the core
principles of transparency and accountability (detailed definitions are available in
Annex 1).
1. Percentage Cost of Procurement Function:
Cost of procurement function divided by organisational running costs
(expenditure)
This indicator shows the cost of running the procurement function in relation to the
resources that are used by the organisation as a whole to deliver its responsibilities.
2. Procurement Function Cost as Percentage of Total Third Party Spend:
Cost of procurement function divided by total third party spend
This indicator shows the cost of running the procurement function in relation to the
third party spend managed by the organisation as a whole to deliver its
responsibilities.
3. Percentage of Third Party Spend channelled to SMEs:
Spend with SMEs divided by total third party spend
This indicator shows the amount of spend that is channelled through Small or
Medium Enterprises (SMEs) in support of government policy to promote small
business procurement.
4. Percentage of Qualified Procurement FTEs:
Number of professionally qualified procurement staff divided by total number
of procurement staff
This indicator is used to assess the capability of the procurement function and the
extent to which third party spend is managed by qualified procurement professionals.
Quality of Data
This year validation of the returns was undertaken by identifying outliers from
comparison with:
o
The 08/09 benchmarking returns;
o
2009 Public Sector Procurement Expenditure Survey (PSPES 2009);
and
o
The average for third party spend quartile groups and the average for
type of organisation.
Organisations identified as outliers were then asked to clarify that they had returned
the correct information. There remains a lack of consistency in the application and
interpretation of the guidance and scope of data provided. Issues include:
o
Despite the definitions of third party spend for this exercise and for the
Public Sector Procurement Expenditure Survey (PSPES) being
consistent some organisations had interpreted them differently
excluding some categories of spend that would be included in their
PSPES return.
o
A considerable number of organisations are still unable to identify the
result of this is that any reporting of the amount of Government
business with SMEs is likely to be understated.
Key Trends and Observations
Analysis was conducted on the organisations in the sample that provided a return
against the procurement metrics, 112 organisations in total, compared to 99 in 2009.
It should be noted that some of these were partial returns.
In order to maintain consistency with last year’s analysis data sets were grouped by
size of third party spend and by type of organisation. Third party spend quartiles are
as follows:
o
Smallest
Up to £27.5 million
o
Mid/Small
Over £27.5 million and up to £68.5 million
o
Mid/Large
Over £68.5 million and up to £196.4 million
o
Largest
Over £196.4 million and up to £24.5 billion
As with last year the wide range in size and magnitude of third party spend is
significant, from less than £1 million to £24.5 billion.
Cost of the function as a percentage of organisational running cost
As with last year over 90% of organisations report a percentage cost of less
than 1% against this metric.
Average costs per third party spend quartile group have largely remained
consistent with no increase or decrease of more than 0.15%.
Cost of the function as a percentage of third party spend
Over 68% of orgaisations report a percentage cost of less than 1% against
this metric.
Again the data is largely consistent with last year with the smallest
organisations appearing to have the biggest scope for improvement.
Average costs per third party spend quartile group are consistent however the
largest organisations have seen their average costs drop by 0.41% this is
potentially due to one of the larger departments seeing the benefits of
centralising its procurement function.
Percentage of professionally qualified procurement employees
The average percentage of professionally qualified procurement employees
has stayed largely the same with the only significant change in mid/small
organisations whose average has risen from 38% to 65%. Looking at the data
this is largely due to an increase in smaller organisations with one or two staff
who are now both professionally qualified (i.e. 100% of procurement staff
professionally qualified).
Percentage of third party spend with SMEs
The Public Sector spends around £220 billion
4each year on procurement in
over 44,000 organisations right across the UK in every sector that
government operates.
Central Government procurement makes up about 30% of this or around £66
billion.
This exercise identified that £4.8 billion in 2009/10 was spent directly or
indirectly (through the supply chain) with small and medium sized enterprises
by organisations with a total third party spend of £22 billion.
It is clear from the data that (a) returns are only partial (many organisations
did not respond to one or other question i.e. third party spend directly or
indirectly with SMEs); and (b) definitions have not been consistently applied.
4. Next Steps
New work programmes initiated by the current administration, to centralise
procurement for common categories of spend and to speak and act with major
suppliers as a single government customer will lead to a step change in the efficiency
of the procurement function. Future reporting requirements
will need to reflect these
new programmes of work and also the work to be undertaken by Lord Browne on the
performance of departmental boards.
4
Benchmarking the Back Office: Estates Profession
The estates benchmarks detailed below have been selected to measure the cost,
capability and performance of the estates management function and support our core
principles of transparency and accountability (detailed definitions are available in
Annex 1).
1. Cost per FTE:
Cost of the Estate divided by number of full time equivalents (FTEs)
This indicator shows the cost of the estate in relation to the number of full
time equivalents (FTEs) employed by the organisation as a whole to deliver
its responsibilities.
2. Area per office based FTE:
Total Estate Net Internal Area in Square Metres divided by the Number
of Office Based FTEs
This indicator provides a measure of the usage of available space.
3. Cost per Square Metre:
Cost of the Estate divided by the Total Estate Net Internal Area in
Square Metres
This indicator shows the cost of the estate in relation to the number of square
metres available.
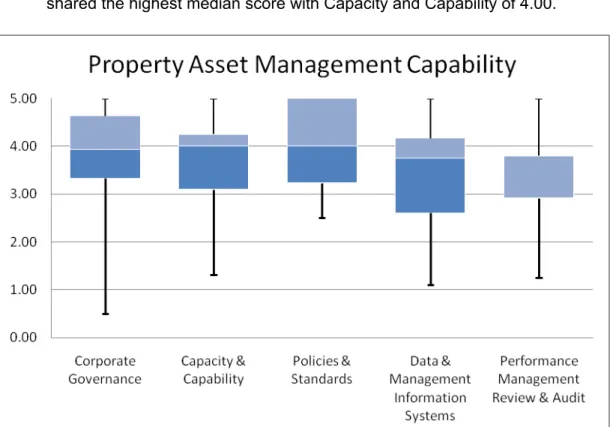
4. Property Asset Management Capability:
Property: Corporate Governance, Capability and Capacity, Policies and
Standards, Data and Management Information Systems, Management
Review and Audit
These indicators are based on an aggregated view of the Property Asset
Management Capability Assessment Model (PAMCAM), jointly developed by
the Office of Government Commerce and the National Audit Office. This is a
self-assessment tool to measure capability of estates management and
identify areas for improvement.
Quality of Data
Data to support the Estates efficiency metrics is collected by departments and their
arms length bodies (ALBs) as part of the Government’s Property Benchmarking
Service (PBS). The PBS provides data management systems for recording and
capturing data at individual building level, but critically this data is subject to external
validation, reporting (at organisation and department level) and benchmarking
against private sector equivalent buildings using industry standard definitions;
confidence in the quality of such data is therefore high. For this analysis a de minimis
has been set at those administrative office buildings where individual occupations
exceed 500 square metres.
For those organisations not engaged in the PBS, including some mixed use
sites, there are challenges in generating figures and therefore a best estimate
has been provided. Where these represent outliers they have been the
subject of further clarification and in some cases exclusion;
55
Museums have been excluded from this analysis, together with British Library and National Gallery;
also the Construction Industry Training Board (where it is likely that the figures submitted contain
significant training areas in addition to office space).
Response to follow-up queries has been timely, with the majority of
responses confirming accuracy of data submitted supported with detailed
explanation of reasons for variance in reported performance. The
Government’s focus on the significance and importance of data appears to
have resulted in improved efforts to report accurately and improve data
quality with most organisations falling within the expected range.
Key Trends and Observations
The Estate efficiency analysis is based on returns for 107 organisations categorised
by 5 different organisation types:
Departments
(Ministerial)
Departments
(Non-Ministerial)
Agency
Executive Non-Departmental Public Bodies
Other
£5,172 £5,212 £5,403 £6,480 £7,622 £0 £1,000 £2,000 £3,000 £4,000 £5,000 £6,000 £7,000 £8,000 £9,000Other Agency Executive NDPB Non Ministerial Department Department (Ministerial)
Figure 1. Property Cost per FTE
Ministerial (£7,622) and Non-Ministerial Departments (£6,480) operate at the
greatest expense, with Other organisation types (£5,172) the least expensive;
The difference between the least expensive organisation type (Other) and the
most expensive (Ministerial Department) is £2,450 per FTE (47 %);
The average cost of accommodating an FTE within a Ministerial Department
(£7,622) is 47% more expensive than in Other organisation types (£5,172).
We would expect that this reflects a London bias for the location of large
Ministerial HQ buildings;
Reviewing the components of cost per FTE (Fig 2.) illustrates how the different
organisation types perform in relation to the other two key areas of efficiency – cost
per m
2and m
2per FTE.
Agency Department (Ministerial)
Executive NDPB
Non‐Ministerial Department Other £250 £300 £350 £400 £450 £500 £550 £600 £650 10.0 11.0 12.0 13.0 14.0 15.0 16.0 17.0