JEEECCS, Volume 5, Issue 17, pages 11-18, 2019
Writing Good Narratives in a Data-Driven
Organization
Mihail Aurel Tîţu
Prof. Eng. &Ec. dr., Sc.D. & Ph.D., Dr. Habil. ―Lucian Blaga‖ University from Sibiu
Sibiu, Romania
The Academy of Romanian Scientists, 54, Splaiul Independenței, Sector 5, Bucharest, Romania
Alexandru Stanciu
Hewlett Packard Enterprise Enterprise Inside Sales Leader
Bucharest, Romania [email protected]
Georgiana Spiridon
EMEA Employees Development & Communications Leader Hewlett Packard Enterprise
Bucharest, Romania [email protected]
Abstract — Written communication in today’s
organizations has more impact than ever before. Particularly, from personal, confidential, legal documents to media and public articles read by millions daily, people are always surrounded by an ever increasing amount of data which is being generated and distributed continuously. This paper outlines the importance of purpose-driven written communication, the methods of generating meaningful data analysis, transforming findings into good narratives and visuals, exposing a few principles of publishing and presenting it to its target audience in a meaningful manner and through effective communication methods.
Keywords — purpose-driven narratives, storytelling, effective communication, visuals
I. INTRODUCTION
Abundant access of information and the usage of big amounts of data in today's organizations can easily generate more confusion if not selected, displayed and presented in an adequate manner.
In present times, when the dependency on technology is at its peak, each human is unwillingly both a producer and consumer of written information. The cumulative cost of poor communication sums up to $37 billion and averages $62.4 million per year among companies with 100.000 employees or more [1].
General quality begins with personal ethic and discipline, self-awareness and self-improvement when it comes to producing and sending out information. Despite the fact that office life is improving through robotic assistants and RPA [2], having the big picture and out-of-the-box perspective on the written and released information might become challenging.
Mindfulness could be a really hard skill to develop when each person will have at least 8 connected devices by 2025[3]. Despite the fact that devices get smarter and have special abilities like perpetual user interfaces (PUI) [4] and more independently by using artificial intelligence (AI) and machine learning (ML) models [5], humans will still face an increase in the demand of creating and receiving written data.
II. COMMUNICATION CHALLANGES OF TODAY’S ORGANIZATIONS
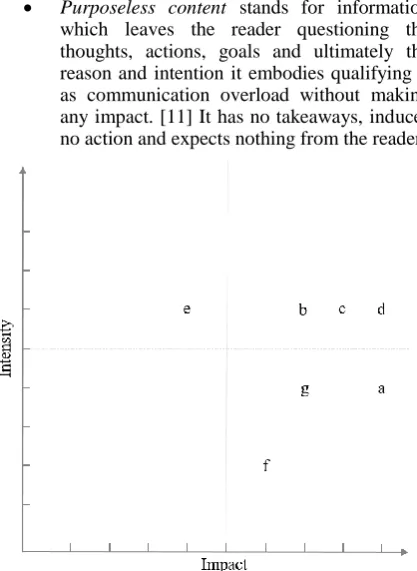
An effective and efficient communication system is a building block in today’s organization and requires managerial skills in delivering and receiving messages at individual level. [6] The process of sending out a message is first coding it into words, symbols and visuals, then sending it out. Simply sending out information won’t guarantee that it’s also understood by its intended recipients thus communication works best when there is also feedback involved. [7] In order to address the main concerns about written communication, a good starting point would be to identify some of the top weaknesses. These have been rated on a scale of intensity and one of impact from 1 to 9.
This paper has its focus on the top right corner of the graph in Fig. 1 and provides insights about improving the major weak points:
Misleading ways of presenting information
12
statistical proof that 73.6% of the time is false [9].
Unstructured, unclear messaging represents
the chaotic diversity of channels which information is shared and that does not have a narrative structure from which the reader can draw conclusions, particularly lacks knowledge of context, logical structure, essential parts, ambiguity-free terms and resonance. [10]
Purposeless content stands for information
which leaves the reader questioning the thoughts, actions, goals and ultimately the reason and intention it embodies qualifying it as communication overload without making any impact. [11] It has no takeaways, induces no action and expects nothing from the reader.
Figure 1. Written communication weaknesses
a) Data accuracy level
b) Using misleading ways of presenting information
c) Unstructured, unclear messaging d) Purposeless content
e) Excessive information f) Conflicting conclusions g) Missing outcomes or takeaways
It is inevitable that sooner or later data strategy is a decisive component of the success and value of organizations. In an ever increasing market competition, key players use the advantage of effective and efficient communication in order to avoid expensive mistakes and transform written communication diversity that is generated through digital transformation into opportunity for growth and change.
III. CASE STUDIES OF WRITTEN COMMUNICATION ERRORS
Throughout history, there have been many misunderstandings and errors which have highly
impacted their corresponding organizations and their cost still echoes in today’s era as examples to learn from:
A. NASA’S MARS ORBITER LOSS
On September 23, 1999, according to a review finding [12], NASA has lost a $125 million Mars orbiter which was destined to analyse and report the red planet’s weather patterns. Unfortunately, instead of orbiting the planet, the spacecraft entered the atmosphere where it burned and broke into pieces, ending the mission. All this, because a communication error between the engineering team from Lockheed Martin in Colorado which used metric units and the mission navigation team in California which interpreted them as English units. JPL Director Edward Stone declared that ―Our inability to recognize and correct this simple error has had major implications‖ [12]. While the 10 month journey to Mars ended fast, NASA studies have shown that simple communication errors may generate implications not only for an organization but also for future research and coordination which meets the need of data consistency and common ways of communication.
B. JP MORGAN CHASE & CO. TWITTER
MISTAKE
Early November, 2013, JP Morgan Chase has published on the day of its initial public offering, just only six minutes after the opening of the New York Stock Exchange, a message on twitter which stated ―What career advice would you ask a leading exec at a global firm? Tweet a Q using $AskJPM. On 11/14 a $JPM leader takes over @JPMorgan.‖[13] The identity of the exec was exposed the following Monday as Jimmy Lee. [13]
JPMorgan Chase& Co was the biggest bank in the United States asset wise at that time and was just fined with $920 million a few weeks ago over the ―London Whale‖ [13] trading fail and in addition received a tentative resolution of thirteen billion USD with the U.S. department of Justice for poor mortgage loans. Jimmy Lee has answered questions on behalf of the bank over Twitter. Lee’s record shows that he has favoured financing and offered consultancy for some of the largest transactions in the U.S. such as the initial public offering of General Motors and Facebook. While its target audience was intended to be students and people seeking career advice, its tweet was followed by a harsh reaction from the public, where from about 80.000 tweets [14], two-thirds were negative. Some reactions were ironic: ―Do you have any self awareness?‖, ―What’s your favourite type of whale?‖ But some of them were expressing high levels of negativity: ―Did you have a specific number of people’s lives you needed to ruin before you considered your business model a success?‖ , ―What section of the poor & disenfranchised have you yet to exploit for profit, & how are you working to address that?‖ [14]
Marchiony, the bank’s spokesman told Reuters that it was a ―Bad idea!‖[14] and refused to comment further.
It was clearly a misuse of a communication channel not being properly placed into context, the audience and company’s present situation being totally ignored.
C. CHALLENGER CREW STILL MISSED TODAY,
THREE DECADES LATER
The disaster which happened on the 28th January 1986 called for the lives of seven people [15]: Commander Francis ―Dick‖ Scobee, pilot Mike Smith, mission specialist Judith Resnik, Ron McNair and Ellison Onizuka, and payload specialists McAuliffe and Greg Jarvis. Only 73 seconds after lift-off shuttle Challenger STS-51L mission suffered a tragedy that shocked the world. Leroy Chiao who was a former astronaut which has had completed three space shuttle missions, mentioned that ―The whole country and the whole world were in shock when that happened, because that was the first time the United States had actually lost a space vehicle with crew on board.‖ [15] All this happened because people were eager to see completed missions at that time, get spaceships off on time and launch more which generated a hype between the decision makers in order to pursue with the launch even if not all aspects were cleared. Challenger failed because of an ―O-ring‖ which was unable to sustain its scope at low temperatures of 36 degrees F (2 degrees Celsius). While a team of experts from the contractor have created a written recommendation which was stating that the launch should not be initiated at temperatures lower than 53 ° F (11.7 ° Celsius) it has not reached its intended position of authority in order to influence the launching decision. According to IEEE Professional communication society [16], it was also a communication mistake since previous data indicating of a problem with the O-ring has been weakly presented and ignored.
Regardless of the technical expertise and education level of the organization, if communication is not done effectively and clearly, the cost can sometimes mean loss of life.
An organizational environment where the need of relevance and meaningfulness is met can be achieved, if structure is combined with discipline and following aspects are being considered.
IV. THE IMPORTANCE OF NUMBERS
―Number sense‖ is the notion frequently applied to illustrate the natural perception of figures by people. This involves the capability to calculate, but also any other’s capability to comprehend variations in a sum of things in an assembly.
Only to a very limited extent, the numbers are processed independently from language. It is through language that the ability to link up the small, exact number aptitudes (logically being able to calculate to three) with the large, estimate number capabilities.
Because humans are numerical beings [17], cardinality is one core aspect which encompasses this concept and creates value from data and observations.
V. CHARTS AND GRAPHS
Regardless of the chosen way to draw a graph, after reading it, it is certainly to find out that ―the old saying is right: a picture really can tell a thousand worlds. ― [18].
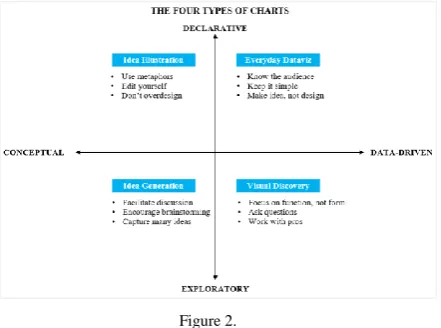
For most people, the process of creating charts and graphs seems almost intuitive. By going beyond simply presenting information to telling stories with data, then the process is a bit more involved. Resisting the urge to immediately choose a chart by instead asking these two questions [19]:
Is the information data-driven or conceptual? Is the objective to make a declarative
statement or explore something?
Once the questions are answered, the response can be plotted in one of the four quadrants below to get a better idea of what kind of visualization should be used.
Figure 2.
Source: Good Charts by Harvard Business Review [19]
If the response was plotted in the top-left quadrant, then will most likely need to simplify an idea using diagrams and other illustrations. Often, metaphors such as mountains and pyramids are used in these types of visualizations, as well as cultural conventions such as hierarchies and symbols like arrows and icons.
If the response was plotted in the bottom-left quadrant, then the goal is to explore a topic through conceptual visuals. This is most commonly used in whiteboard sessions where would want to plan a business process or diagram a system without using concrete data.
In contrast, the third category to the bottom right requires a visualization that is more complex than all the others. Here, most likely deal with multiple large data sets and work in conjunction with a data scientist to manage and present the data in the form of an interactive visualization to uncover patterns and trends.
14
a simple narrative and driving home a clear point through effective design decisions.
Essentially is to have that necessity clearly expressed: What the audience needs to identify? Then the choice of selecting a visual display that will allow to make this clear.
The response for the enquiry ―What is the right diagram for a preferred situation?‖ is always the same: whatever will be easiest for the audience to read. There is an easy way to assess this, which is to generate the graphic and request feedback. This will support to assess whether the visual is successful, or in the case where it isn’t, for sure it will help know where to focus the actual fluctuations.
In data visualization—and conveying with data in general—investing time to create designs engagingly pleasing can point out that the audience will have more perseverance with the visuals, growing the chance of achievement for getting the communication thru.
VI. NARRATIVE STRUCTURE.LEADING WITH STORIES
The narrative assembly notion has been illustrated in earliest times by Greek philosophers like Plato and Aristotle. [20] Aristotle developed a simple but insightful concept – that a story should follow a solid beginning, middle, and end. With time the concept has been developed and is usually stated to as the setup, conflict, and resolution.
Following the structure, first is presenting the plot, creating the environment for the audience. By connecting the audience, raising curiosity and responding the questions that are likely in a pursuit of discovering the answer: What’s In It For Me?
When it comes to setting up the story following enquiries are to be well-thought-out and addressed [21]:
1. The background: When and where does the story occur?
2. The leading character: Who is running the activity? (This should be outlined in terms of the audience!)
3. The discrepancy: Why is it required, what is different?
4. The steadiness: What exactly needs to happen?
The resolution: How the modifications will be emphasized?
Having the scene established, the extent of the communication further advances ―what could be‖ with the aim of persuading the spectators of the need of action. The responsiveness of the audience can be easily maintained through this part of the story by approaching how the issue can be unravelled. An extent of influencing is required for the audience to embrace the resolution offered and act in a rewarding manner. The explicit composition will take diverse forms depending on the circumstances. The
subsequent are few notions for content that might fit to encompass within the story and sway the audience to buy in:
Additional expansion of the status quo or situation by suitable environment
Integration of external setting or comparison facts
Samples that elucidate the matter Statistics that validates the issue
What will occur if no action is taken or no adjustment is performed
Possible opportunities for addressing the situation
Benefits of the suggested resolution
Shape of a distinctive position to make a verdict or drive action
When taking into account what to incorporate in a statement, the audience needs to be the key player. By finishing with a reinforcement, it will be easy to understand for the audience what the outcome is and will drop in a different perception or learning that has been conveyed to them.
In order to be efficacious, a storyline has to be vital to the message. These are words—written, spoken, or a grouping of the two—that express the narrative in a line that is straightforward and assures the audience why it’s imperative or thought-provoking and consideration to it should be rewarded.
Since individuals discerns the data both realistically and expressively, frequently the mark between these two is very narrow, most often than not, humans discovered to be unable of sorting out rational from emotive discernments. [22]
The pivotal point in data-driven communication emerges when the graphics are associated with an influential narrative building a bridge from the mind to the heart of the reader.
An assembly of figures and arguments on a given matter without construction and direction that offers them significance is impractical. The storyline course is the articulated and written route along which the spectators should be taken over by the way of demonstration or communication.
One method to order the narrative—the one that normally occurs —is sequentially [23]. By way of sample, if people consider about the overall logical procedure, it looks somewhat like this: detecting a problem, meeting data to better recognize the situation, examining the data (seeing at it one way, seeing at it another way, binding in other things to understand the actual effect), developing with a conclusion or resolution, and based on these outcomes, a suggested action.
the past. This tactic can function well if there is a need to found reliability with the audience, or if the audience cares about the procedure. But sequential is not the only alternative.
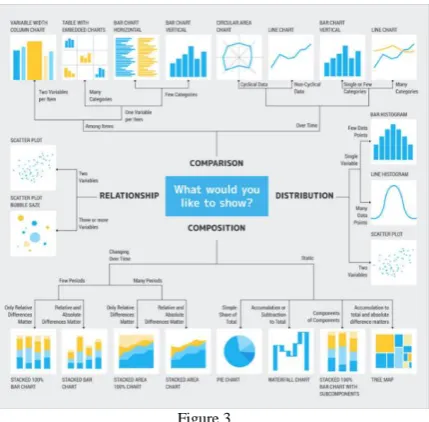
As part of creating the plot flow clear, there is a way to look at what fragments of the story will be inscribed and what will be conveyed through spoken words.
Figure 3.
Source: Two Octobers, Digital Marketing Services [24]
VII. GOALS AND MILESTONES
Highly effective people practice milestone-based thinking by choosing the right goals and objectives and engaging in the journey of pursuing them [25]. Eliminating the noise by having the results in mind is a process that favors unconscious prioritization of tasks thus aligning energy and time in the right direction and therefore increasing efficiency [26]. Using discipline for balancing vision and action will differentiate business from the competition and generate areas of fast growth [27].
The idea of SMART(specific, measurable, achievable, relevant, time bound)[28] goals is useful but not as relevant as it once was in today’s faster, more agile business environment, but today’s businesses need new ways of setting goals, and CLEAR goals do just that [29].
Collaborative — Goals encourage employee teamwork and collaboration.
Limited — Goals are limited in both duration and scope.
Emotional — Employees are emotionally connected to the goals.
Appreciable — large Goals can be broken down into smaller goals so they can be accomplished more quickly and easily for long-term gain.
Refinable — Flexibility. Having permission to refine and modify goals, even if they’re set with a headstrong objective.
Following related guidelines increase discipline, quality and impact:
A. ARTICULATION OF ACHIEVEMENTS OR
GOALS IN A MEASURABLE WAY
In order for a goal to qualify as measurable, it will have to meet following five grammatical checkpoints [30]:
The noun is the subject the goal is about The adjective is the difference the goal is to
make
Verbs and adverbs often (but not always) suggest you an action, not a goal
Commas and conjunctions suggest you have more than one goal
The recipe for a measurable goal is: noun + linking verb + adjective phrase or adverb phrase
B. CONCISE AND CLEAR MESSAGING, IN
BUSINESS MEANINGFUL TERMS
Knowing the context is the main factor for establishing a clear image throughout a goal-setting message. Because of the diversity of acronyms and that understanding the context is a must for all strategic initiatives [31], a clear message will have to be addressed properly according to its specific target audience and expressed in simple language for everybody to understand. Because simple communication errors can cost millions of dollars [12], the importance of having an acknowledgement that the message was understood can achieve savings and improve safety and even preserve life [15].
C. USAGE OF PAST TENSE FOR ACHIEVEMENTS
Since an achievement is something which was accomplished already, it is natural to use past tense and refer to it as a completed event [32].
D. USAGE OF VERBS FOR NEXT STEPS
Most often than not, an action is represented through a verb, especially when referring to a future event [33].
E. CALL TO ACTION, OWNERSHIP AND
ACCOUNTABILITY
It is important for organizations not to assume that the targeted audience knows what to expect from a message and understand the outcome. Greater results are being achieved if the prospects know what to do. [34] Taking ownership is about initiative, doing the right thing for the business and taking responsibility for results, while accountability is about following through upon commitments. [35]
F. ANALOGIES, A WAY OF CONNECTING THE
MESSAGE TO THE SUBCONSCIOUS MIND
16
encapsulate the usual, fundamental activities that most users would have done manually on their desk into the digital sphere. Since analogies are to be marked as building blocks of intuition [37], people trend to search for them in daily interaction with a particular domain of interest. A well placed analogy, can often secure laying the message within the imagination of the audience by inducing a familiar term from a new concept. This way, by making people familiar with the message, it wins their trust, brings them into the desired space of comfort and favors change.
CONCLUSIONS
As organizations become more data-driven and performance oriented, quality of narrative data is one of the main factors for successful communication and since there is no direct ownership and accountability for quality [38], the key to achieving it is participation, therefore each and every single person, team and group across today’s organizations is required to collaborate and coordinate properly [39].
Considerate adoption of narrative or data storytelling commits to uncover completely new opportunities of study in visualization. Going from examination, to enquiry, to presentation is a natural evolution, which is reflected by the examination effort concentrated on these steps over time. As the arena becomes more advanced and delivers many valuable procedures for the first two steps, the actual need is to start concentrating on presentation. This is imperative as visualization gets used for decision-making, where the concise presentation of main facts is essential.
A promising vision for the future narrative creators can be achieved by placing the reader or listener at the centre of their message and therefore increasing its accuracy, coherence along with corresponding purpose, context and structure.
REFERENCES
[1] Holmes Report, The cost of poor communications.
https://www.holmesreport.com/latest/article/the-cost-of-poor-communications, 2011.
[2] R., Brunk, The ABC of Robotic Process Automation, Part1: What is Robotics and Automation in the Office?
https://www.roboticstomorrow.com/article/2016/06/the-abc-of-rpa-what-is-robotics-and-automation-in-the-office/8278, 2016.
[3] Statista, Internet of Things(IoT) connected devices installed base worldwide from 2015 to 2025
https://www.statista.com/statistics/471264/iot-number-of-connected-devices-worldwide/ , 2018.
[4] J., Maida, Technavio Research, Global Gesture Recognition Market for Consumer Electronic Devices to Post a CAGR of Over 30% Through 2022
https://www.businesswire.com/news/home/20180521005600/ en/Global-Gesture-Recognition-Market-Consumer-Electronic-Devices , 2018.
[5] T., Safoian, AI And IoT Lead The Way For Enterprise New Tech Investment In 2018
https://www.forbes.com/sites/forbestechcouncil/2018/05/29/ai -and-iot-lead-the-way-for-enterprise-new-tech-investment-in-2018/#15ba191e5046 ,2018.
[6] P., Juneja, Importance of Communication in an Organization
https://managementstudyguide.com/importance-of-communication.htm, 2018.
[7] F., Evesham, Strength & Weakness in Workplace Communication https://careertrend.com/strength-weakness-workplace-communication-3002.html, 2017.
[8] R., McCready, 5 Ways Writers Use Misleading Graphs To Manipulate You https://venngage.com/blog/misleading-graphs/, 2018.
[9] M., Lebied, Misleading Statistics Examples – Discover The Potential For Misuse of Statistics & Data In The Digital Age
https://www.datapine.com/blog/misleading-statistics-and-data/, 2018.
[10] M., J., Eppler, N., Bischof, mcm institute of the University of St. Gallen, Complex to Clear Managing Clarity in Corporate Communication
http://www.knowledge-communication.org/pdf/complextoclearnew.pdf, 2011. [11] L., A., Boschwitz, If you don’t know the purpose of your
communication, don’t bother communicating...
https://www.linkedin.com/pulse/you-dont-know-purpose-your-communication-bother-laure-anne-boschwitz/, 2018. [12] NASA’s metric confusion caused Mars orbiter loss,
http://edition.cnn.com/TECH/space/9909/30/mars.metric/ , 1999.
[13] E., Greenhouse, JPMorgan’s Twitter Mistake,
https://www.newyorker.com/business/currency/jpmorgans-twitter-mistake , 2013.
[14] D., Johnson, JPMorgan cancels Twitter Q&A after tirade of abuse,
https://www.telegraph.co.uk/technology/twitter/10448715/JP Morgan-cancels-Twitter-QandA-after-tirade-of-abuse.html , 2013.
[15] M.,Wall, Challenger Disaster 30 Years Ago Shocked the World, Changed NASA, https://www.space.com/31760-space-shuttle-challenger-disaster-30-years.html ,2016. [16] P.,M., Dombrowski, The lessons of the Challenger
investigations, https://ieeexplore.ieee.org/document/108666 , 1991.
[17] H., Wiese, Numbers, Language, and the Human Mind,
https://www.researchgate.net/publication/281909619_Numbe rs_Language_and_the_Human_Mind , 2003.
[18] © SkillsYouNeed
https://www.skillsyouneed.com/num/graphs-charts.html
,2015.
[19] S., Berinato, Visualizations That Really Work
https://hbr.org/2016/06/visualizations-that-really-work, 2016. [20] B., Duignan, Plato and Aristotle: How Do They Differ?
https://www.britannica.com/story/plato-and-aristotle-how-do-they-differ, 2018.
[21] C., Atkinson, Beyond Bullet Points fourth edition, Microsoft press, 2017, p. 90-97
[22] R., Reuchelle, An experimental study of audience recognition of emotional and intellectual appeals in persuasion, Speech monographs, 25 1, 1958, p. 49-57
[23] Undergraduate Pace University, Narrative Chronology,
http://webpage.pace.edu/bmorris/will/narrative.htm, 2012. [24] M., Castle, J., Latorra,8 Data Storytelling Concepts (with
Examples!) https://twooctobers.com/blog/8-data-storytelling-concepts-with-examples/, 2018.
[25] V., Kotelnikov, The Purpose and Benefits of Milestone-based Thinking
http://www.1000ventures.com/business_guide/crosscuttings/t hinking_milestone-based.html, 2017.
[26] B., Eckfeldt, 18 Simple Ways to Increase Productivity and Focus at Work https://www.inc.com/bruce-eckfeldt/18-ways-to-avoid-being-distracted-at-work.html, 2018.
[27] D., Lavinsky, Are You a Visionary Business Leader?
https://www.forbes.com/sites/davelavinsky/2013/04/26/are-you-a-visionary-business-leader/#648eed4d7bbf, 2013. [28] Mindtools Core team,
https://www.mindtools.com/pages/article/smart-goals.htm
[29] P.,Economy, Why you should set CLEAR goals instead of SMART goals http://workwell.unum.com/2018/09/set-clear-goals-instead-smart-goals/ , 2018.
[30] S., Barr, A Recipe for Writing a Measurable Goal
https://www.staceybarr.com/measure-up/a-recipe-for-writing-a-measurable-goal/, 2018.
[31] L., Wood, Define the Business Context Needed to Complete Strategic IT Initiatives: 2018 Blueprint - ResearchAndMarkets.com
https://www.businesswire.com/news/home/20180201006534/ en/Define-Business-Context-Needed-Complete-Strategic-Initiatives, 2018.
[32] L., G., Mundhenk, Accomplishment Statements Making the most of your achievements
https://usm.maine.edu/sites/default/files/advising/Career%20 Tools.Accomplishment%20Statements-PDF.pdf, 2010. [33] © British Council
https://learnenglish.britishcouncil.org/es/english-grammar/talking-about-future, 2018.
[34] M., Lilyquist, What is a Call To Action and How Do I Make One? https://www.thebalancesmb.com/call-to-action-1794380, 2017.
[35] B., Rusche, How to make accountability a core part of your culture https://soapboxhq.com/blog/management-skills/create-culture-accountability-workplace, 2018. [36] D., Zax, How Steve Jobs’s Mastery Of Analogies Sent Apple
Skyrocketing https://www.fastcompany.com/3037014/how-steve-jobss-mastery-of-analogies-sent-apple-sky-rocketing, 2014.
[37] W., Leodolter, Digital Transformation Shaping the Subconscious Minds of Organizations, 2017, p. 21
[38] M., Peters, Becoming a data driven organization: The handbook, 2018, p. 12