© 2020 by the Serbian Biological Society How to cite this article: Emir A, Emir C. Chemical profiles and biological 193 properties of methanol extracts of Allium pallens L. from different localities in
Turkey. Arch Biol Sci. 2020;72(2):193-201.
Chemical profiles and biological properties of methanol extracts of Allium pallens L.
from different localities in Turkey
Ahmet Emir* and Ceren Emir
Department of Pharmacognosy, Faculty of Pharmacy, Ege University, 35100, Bornova, İzmir, Turkey
*Corresponding author: [email protected]
Received: February 26, 2020; Revised: April 20, 2020; Accepted: April 20, 2020; Published online: April 20, 2020
Abstract: Many species of the Allium genus, principally the cultivated forms, are widely used as vegetables, spices and natural therapeutics due to their beneficial health properties. This study aimed to identify the phenolic composition and
biological activities of the bulb, stem and flower parts of Allium pallens L., collected from two different localities. A total
of 28 phenolic compounds were investigated by LC-ESI-MS/MS, and gallic acid, 4-hydroxybenzoic acid, and benzoic acid were found to be the major phenolic compounds in the plants from both locations. Total phenolic- and flavonoid-content analyses of samples were carried out using spectrophotometry, and the stem extracts were found to be rich in phenolics. DPPH, ABTS, FRAP and CUPRAC assays were used to determine the antioxidant capacities of the extracts. A linear rela-tion was observed between the phenolic contents of the extracts and their antioxidant activities, and the stem extracts of plants from both locations were found to have potent antioxidant capacity. The inhibitory activities of the extracts against acetylcholinesterase, butyrylcholinesterase and tyrosinase were determined using a 96-well microplate reader. The anti-butyrylcholinesterase activity of the extracts was found to be the highest. The outcomes of these investigations were further explored, and the underlying structure of multivariate data was revealed using principal component analysis. This study
presents the distribution of chemical constituents and biological activities of the different parts of A. pallens, and also
con-tributes to further investigations of Allium species.
Keywords: Allium; phenolics; antioxidant; anticholinesterase; antityrosinase
INTRODUCTION
Secondary metabolites are chemically quite different from each other and synthesized in different pathways in plants. These metabolites are not directly necessary for the basic functions of plants and are thought to be synthesized for protection from insects, oxidizing agents and ultraviolet radiation, as well as for pol-lination [1]. The characterization of plant secondary metabolites using modern chromatographic methods is a significant subject both in plant physiology and phytochemistry. Plant phenolics are one of the largest groups of secondary metabolites. Phenolics are formed through either the shikimic acid or the malonate/ acetate pathways, and are chemically divided into sixteen subgroups according to their basic structure. A large volume of research has focused on phenolic compounds due to their wide range of pharmacological and biological effects [2].
can cause numerous side effects, including nausea, vomiting, diarrhea, dizziness, abdominal pain and headache, all of which negatively affect the quality of life of patients [7]. Therefore, studies focused on finding natural enzyme inhibitors with minimal side effects are of great interest to many researchers.
The genus Allium L. is represented by about 900 species [8] and is a taxonomically problematic and highly variable genus distributed across the northern hemisphere [9]. Although the genus Allium was for-merly included in the Liliaceae family, the Angiosperm Phylogeny Group (APG) has reevaluated the taxonomic position of this genus using molecular studies, and has finally transferred Allium to the Amaryllidaceae family, subfamily Allioideae, tribe Allieae [10]. Many species of the Allium genus, principally cultivated forms such as A. sativum (garlic), A. cepa (onion), A. porrum (leeks) and A. ascalonicum (shallots), are widely used as vegetables, spices and natural therapeutics due to their beneficial health properties. They are known to have significant beneficial effects on the cardiovascu-lar system due to their hypotensive, hypolipidemic, platelet-preventing and hypocholesterolemic effects [11,12]. Additionally, several studies have reported that many Allium species have potent inhibitory activities against cholinesterases and tyrosinase, which are both key enzymes linked to neurodegenerative diseases and skin disorders. Twenty-three different Allium species in terms of their respective inhibitory activities against acetylcholinesterase (AChE) were investigated, and all species were reported as active, with A. obliquum being the most potent [13]. The anticholinesterase and antityrosinase activities of bulb, stem and flower parts of A. scorodoprasum subsp. rotundum were examined [14], and all three parts of the plant demonstrated potent inhibitory activity against these enzymes. A previous study by our group investigated the cholinesterase and tyrosinase inhibitory potentials of different parts of A. nigrum and A. subhirsutum and observed enzyme inhibitory activity in all samples, with the bulb parts of both plants showing the highest activity [15].
Allium pallens L. is a synanthropic species dis-tributed in the Mediterranean region [16], and was collected from Ovacık, Ödemiş, and Bozdağ, Ödemiş, in Turkey for chemical and biological investigations. To the best of our knowledge, this is the first report of the phenolic profile A. pallens, along with its inhibitory
activity against AChE, butyrylcholinesterase (BuChE) and tyrosinase as well the antioxidant potentials of its bulb, stem and flower.
MATERIALS AND METHODS
Chemicals
The reference standards used in the LC-MS/MS analysis, AChE (from Electrophorus electricus), BuChE (from equine serum), acetylthiocholine/butyrylthiocholine iodide, DTNB (Ellman’s reagent) [5,5΄-dithio-bis-(2-nitrobenzoic acid)], tyrosinase (from mushroom), galanthamine, L-dopa, kojic acid (used for enzyme inhibitory activities), 1,1-Diphenyl-2-picrylhydrazyl, 2,2’-azino-bis(3-ethylbenzothiazoline-6-sulphonic acid), potassium persulfate, trolox, copper(II) chloride, neocuproine, 2,4,6-tris(2-pyridyl)-s-triazine and fer-ric chloride (used for antioxidant activities) were all purchased from Sigma-Aldrich, USA.
Plant materials
Allium pallens L. was collected in July 2018 from Ovacık, Ödemiş (No: 1610), and Bozdağ, Ödemiş (No: 1614), (İzmir, Turkey). The plants were identified by Dr. Hasan Yıldırım. The morphological characteristics of the Allium specimens were examined using a binocular stereo microscope (Olympus SZ60 Trinocular Stereo-zoom Microscope) and the identification of A. pallens was performed according to the relevant taxonomic literature [17]. Voucher specimens were deposited in the Herbarium of the Department of Pharmacognosy, Faculty of Pharmacy, Ege University.
Sample preparation
Total bioactive compounds
A modified Folin-Ciocalteu method [18] was performed to determine the total phenolic content (TPC) of the samples. One mL of ten-fold-diluted reagent plus the samples was added to falcon tubes and neutralized with 4 mL sodium carbonate solution (7.5%). The mixture was incubated at room temperature for 20 min and the absorbance was measured at 765 nm. Gallic acid was used as the standard and the results were expressed as gallic acid equivalents (mg GAE/g extract) based on the standard curve created.
The total flavonoid content (TFC) of extracts was evaluated using the AlCl3 method with slight modifica-tions, as described [19]. Two mL of extract at a concen-tration of 1 mg/mL were mixed with 0.1 mL of a 10% AlCl3 solution. Then 0.1 mL of 1 M potassium acetate and 2.8 mL of distilled water were added to the mixture. After incubation at room temperature for 30 min, the absorbance was measured at 415 nm. The results are given as quercetin equivalents (mg QE/g extract) based on a standard curve created with quercetin.
Identification of phenolic compounds
Twenty-eight phenolic compounds were discovered in the different parts of the plants using a TSQ Quantum™ Access MAX Triple Quadrupole Mass Spectrometer (Thermo Scientific™, USA). Chromatographic separa-tion of phenolics was performed using a GL Sciences (Japan) ODS C18 column (150 mm × 4.6 mm × 5 µm) with a gradient mobile phase that consisted of water (A) and methanol (B), both of which were acidified with 0.1% formic acid. Gradient elution was carried out as follows: 5-20% B (0-1.5 min), 20-30% B (1.5-3 min), 30-50% B (3-4.75 min), 50-70% B (4.75-6.25 min), 70-80% B (6.25-7.5 min), 80-90% B (7.5-10 min), 90-95% B (10-12.5 min), 95-5% B (12.5-15 min). The flow rate and the injection volume were 1.0 mL/min and 5 μL, respectively. ESI parameters were as follows: capillary temperature: 400°C; vaporizer temperature: 500°C; the flow rate of the sheath gas, aux gas, and sweep gas were kept at 75 arb, 20 arb and 0 arb, respectively. The identity of the phenolic compounds in the samples was determined by comparing their retention times and MS/MS fragments with reference standards. An external standard method was performed, and the results are expressed as μg per gram of extracts.
Enzyme inhibitory activities
The anticholinesterase activity of the extracts was determined according to Ellman’s method [20], which is based on the spectrophotometric measurement of the yellow color formed as a result of released thio-cholines through the reaction with Ellman’s reagent, with previously described modifications [21], using a microplate reader (Varioskan Flash Multimode Reader, Thermo Scientific, USA).
The antityrosinase activity of the samples was de-termined using the dopachrome method with a 96-well microplate reader [22]. The procedures of this experi-ment have been defined in our previous study [15]. The IC50 values of the samples were determined using GraphPad Prism V5.0 software (GraphPad Software, San Diego, CA, USA) and the results given represent the averages from three independent experiments.
Estimation of radical scavenging activities DPPH (1,1-Diphenyl-2-picrylhydrazyl) assay
The DPPH assay was performed as detailed [23], with slight modifications. Specifically, 0.1 mM DPPH was mixed with the methanol extract of the sample and incubated for 30 min at room temperature. The absorbance was measured at 517 nm and Trolox, a hydrophilic analog of vitamin E, was used as a positive control. The results were given in milligrams of Trolox equivalents/g of extract (mg TE/g extract).
2,2΄-azino-bis(3-ethylbenzothiazoline-6-sulphonicacid (ABTS) assay
The ABTS+ radical cation was obtained by mixing an
equal proportion of 7.4 mM ABTS and 2.45 mM potas-sium persulfate solutions and allowing the mixture to stand at room temperature in the dark. This solution was then diluted with methanol until the absorbance reached 0.700±0.02 at 734 nm. Then, 0.2 mL of metha-nol extract and 2.80 mL of ABTS+ solution were mixed
Estimation of reducing power activities Cupric ion reducing (CUPRAC) assay
The CUPRAC assay was performed as described [25], with slight modifications. Ten mM CuCl2, 7.5 mM neocuproine and the sample solution were mixed at pH 7.0. After incubation in the dark for 30 min, the absorbance values were measured at 450 nm. The results are given in mg TE/g extract.
Ferric Reducing Antioxidant Power (FRAP) assay
The FRAP reagent was prepared by mixing 25 mL of 0.3 M acetate buffer (pH 3.6) and 2.5 mL of 10 mM 2,4,6-tris(2-pyridyl)-s-triazine (TPTZ) solution in 40 mM HCl and 2.5 mL of 20 mM ferric chloride. Methanol extracts (0.1 mL) from the samples were added to 2 mL of this solution and the mixture was incubated for 30 min at room temperature, after which the absorbance was recorded at 593 nm [26]. Trolox was used as the positive control and the results were given in mg TE/g extract.
Statistical analysis
The results of all analyses were subjected to principal component analysis (PCA) using SPSS.25 software. The number of variables was reduced and the most discriminating phenolics and biological activities of the different parts of plants from both localities were determined for the purpose of assigning resemblances and distinctions. Additionally, a one-way ANOVA test (Tukey’s test) was used to determine differences among means and the differences were considered as significant with P<0.05.
RESULTS
Phenolic profile
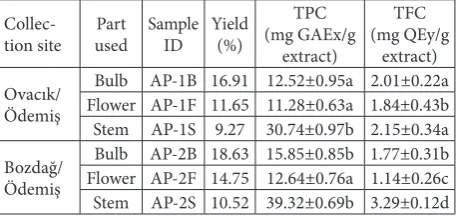
Bulb, stem and flower parts of A. pallens were collected from different localities and their compounds were extracted using a quick, efficient and straightforward method. The extraction yields, identification (ID), TPC and TFC of the samples are given in Table 1. In each case, the highest yield was obtained from the bulb parts, followed by the flower parts and then the stem.
Table 1. Sample ID and extraction yield of extracts.
Collec-tion site usedPart Sample ID Yield(%)
TPC (mg GAEx/g
extract)
TFC (mg QEy/g
extract) Ovacık/
Ödemiş
Bulb AP-1B 16.91 12.52±0.95a 2.01±0.22a Flower AP-1F 11.65 11.28±0.63a 1.84±0.43b Stem AP-1S 9.27 30.74±0.97b 2.15±0.34a Bozdağ/
Ödemiş
Bulb AP-2B 18.63 15.85±0.85b 1.77±0.31b Flower AP-2F 14.75 12.64±0.76a 1.14±0.26c Stem AP-2S 10.52 39.32±0.69b 3.29±0.12d
Values are means±SD of three parallel measurements. xGallic acid
equivalent, yQuercetin equivalent. Superscripts indicate significant
differences in the studied extracts (P<0.05).
The TPCs and TFCs of all the samples were screened spectrophotometrically. The TPC of the samples was determined using the Folin-Ciocalteu method, which is based on a redox reaction, and the results are stated in gallic acid equivalents. The results indicate that AP-2S had the highest TPC level at 39.32 mg/g. The extracts from the other samples demonstrated TPCs that varied from 11.28 mg/g for AP-1B to 30.74 mg/g for AP-1S. Additionally, the TFCs of the samples were determined using the AlCl3 assay, which is based on the generation of a complex between aluminum ions, the C-4 keto group and either the C-3 or C-5 hydroxyl groups of flavonoids. The results of this assay are stated in quercetin equivalents and they showed similarity to the TPC assay. Specifically, the sample extracts dem-onstrated TFCs varying from 1.14 mg/g for AP-2F to 3.29 mg/g for AP-2S.
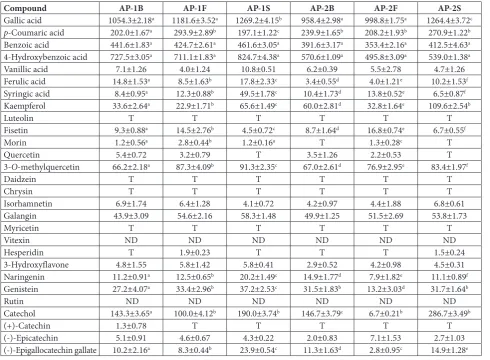
acid were the major phenolic acids in all samples. In terms of flavonoids, kaempferol (109.6±2.54 µg/g) in sample AP-2S and 3-O-methylquercetin (91.3±2.35 µg/g) and galangin (58.3±1.48 µg/g) in sample AP-1S were the most abundant compounds.
Enzyme inhibitory activities
Cholinesterase inhibitors are important drugs used in the symptomatic treatment of Alzheimer’s disease [7]. The AChE enzyme localized in neurons is thought to be responsible for 80% of the cholinesterase activity in glial cells, while the remaining 20% is provided by the BuChE enzyme [27]. Methanol extracts from the bulb, stem and flower parts of the plants were tested for their AChE and BuChE inhibitory activities (Table 3)
Table 2. Concentrations of phenolic compounds (µg g-1 of extract) of different parts of A. pallens.
Compound AP-1B AP-1F AP-1S AP-2B AP-2F AP-2S
Gallic acid 1054.3±2.18a 1181.6±3.52a 1269.2±4.15b 958.4±2.98a 998.8±1.75a 1264.4±3.72c
p-Coumaric acid 202.0±1.67a 293.9±2.89b 197.1±1.22c 239.9±1.65b 208.2±1.93b 270.9±1.22b
Benzoic acid 441.6±1.83a 424.7±2.61a 461.6±3.05a 391.6±3.17a 353.4±2.16a 412.5±4.63a
4-Hydroxybenzoic acid 727.5±3.05a 711.1±1.83a 824.7±4.38a 570.6±1.09a 495.8±3.09a 539.0±1.38a
Vanillic acid 7.1±1.26 4.0±1.24 10.8±0.51 6.2±0.39 5.5±2.78 4.7±1.26
Ferulic acid 14.8±1.53a 8.5±1.63b 17.8±2.33c 3.4±0.55d 4.0±1.21e 10.2±1.53f
Syringic acid 8.4±0.95a 12.3±0.88b 49.5±1.78c 10.4±1.73d 13.8±0.52e 6.5±0.87f
Kaempferol 33.6±2.64a 22.9±1.71b 65.6±1.49c 60.0±2.81d 32.8±1.64e 109.6±2.54b
Luteolin T T T T T T
Fisetin 9.3±0.88a 14.5±2.76b 4.5±0.72c 8.7±1.64d 16.8±0.74e 6.7±0.55f
Morin 1.2±0.56a 2.8±0.44b 1.2±0.16a T 1.3±0.28c T
Quercetin 5.4±0.72 3.2±0.79 T 3.5±1.26 2.2±0.53 T
3-O-methylquercetin 66.2±2.18a 87.3±4.09b 91.3±2.35c 67.0±2.61d 76.9±2.95e 83.4±1.97f
Daidzein T T T T T T
Chrysin T T T T T T
Isorhamnetin 6.9±1.74 6.4±1.28 4.1±0.72 4.2±0.97 4.4±1.88 6.8±0.61
Galangin 43.9±3.09 54.6±2.16 58.3±1.48 49.9±1.25 51.5±2.69 53.8±1.73
Myricetin T T T T T T
Vitexin ND ND ND ND ND ND
Hesperidin T 1.9±0.23 T T T 1.5±0.24
3-Hydroxyflavone 4.8±1.55 5.8±1.42 5.8±0.41 2.9±0.52 4.2±0.98 4.5±0.31
Naringenin 11.2±0.91a 12.5±0.65b 20.2±1.49c 14.9±1.77d 7.9±1.82e 11.1±0.89f
Genistein 27.2±4.07a 33.4±2.96b 37.2±2.53c 31.5±1.83b 13.2±3.03d 31.7±1.64b
Rutin ND ND ND ND ND ND
Catechol 143.3±3.65a 100.0±4.12b 190.0±3.74b 146.7±3.79c 6.7±0.21b 286.7±3.49b
(+)-Catechin 1.3±0.78 T T T T T
(-)-Epicatechin 5.1±0.91 4.6±0.67 4.3±0.22 2.0±0.83 7.1±1.53 2.7±1.03
(-)-Epigallocatechin gallate 10.2±2.16a 8.3±0.44b 23.9±0.54c 11.3±1.63d 2.8±0.95c 14.9±1.28e
Values are means±SD of three parallel measurements. ND – not detected, T – trace amounts. Superscripts indicate significant differences in the studied extracts (P<0.05).
Table 3. Enzyme inhibitory properties of the samples.
Sample AChE
Inhibition (IC50 µg/mL)
BuChE Inhibition (IC50 µg/mL)
Tyrs Inhibition (IC50 µg/mL)
AP-1B 63.89±0.23a 54.16±1.08b 327.78±1.22c
AP-1F 102.95±1.48a 99.84±1.73b 147.21±1.35c
AP-1S 33.76±1.82a 20.75±1.64b 104.38±0.79c
AP-2B 38.48±1.33a 34.63±1.98b 96.65±0.85c
AP-2F 124.61±2.04a 42.55±0.86b 138.43 ±1.93c
AP-2S 24.29±0.57a 10.82±0.21b 54.58±0.38c
Galanthamine 0.106±0.01a 1.04±0.01
-Kojic acid - - 7.9±0.02
Values expressed are means±SD of three parallel measurements. AChE – acetylcholinesterase;
according to Ellman’s method, with galanthamine used as a positive standard, and the IC50 values of ga-lanthamine for AChE and BuChE were calculated as 0.106 μg/mL and 1.04 μg/mL, respectively. All samples displayed inhibitory activities against AChE (IC50 24.29-124.61 µg/mL) and BuChE (IC50 10.82-99.84 µg/mL), with the most potent sample being AP-2S (IC50 24.29 and 10.82 µg/mL for AChE and BuChE, respectively).
Tyrosinase is the central enzyme in melanin synthe-sis in the human body, and it also causes the enzymatic browning of fruits and vegetables [28,29]. Moreover, tyrosinase oxidizes dopamine and levodopa to first form dopaquinone and then neuromelanin in the brain. Dopaquinone is known to be a neurotoxic metabolite that leads to the loss of dopaminergic neurons. Neu-romelanin interacts with the α-synuclein protein, which is thought to be responsible for familial Parkinson’s disease, and it also renders neurons in the substantia nigra pars compacta more susceptible to toxic effects [30,31]. The tyrosinase inhibitory potentials of the methanol extracts are shown in Table 3, with kojic acid used as the positive control (IC50 7.9 μg/mL). The IC50 values of the samples for tyrosinase were found to be higher than those for the cholinesterase enzymes. The extracts of parts from both plant samples demonstrated antityrosinase activity ranging from 54.58 to 327.78 μg/mL. Similar to the results of the anti-cholinesterase activity assay, the highest tyrosinase inhibitory activity was observed in sample AP-2S.
Antioxidant activities
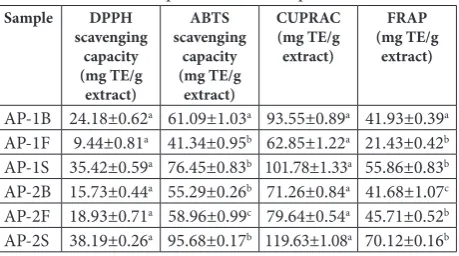
Methanol extracts of the bulb, stem and flower parts of both plant samples were investigated in terms of their radical scavenging and reducing power activities in order to deduce their respective antioxidant capacities, with the results expressed as equivalents of Trolox (Table 4). The radical scavenging activity of the samples was evaluated using the DPPH and ABTS assays. Sample AP-2S exhibited the most potent DPPH (38.19 mg/g) and ABTS (95.68 mg/g) scavenging activities. The reducing powers of the extracts were determined by the CUPRAC and FRAP assays, which measure the reduction of copper(II) and iron(III), respectively. Similar to the results of the radical scavenging activity assays, the highest activities for both reducing assays were observed in the stem extract of AP-2 (119.3 and 70.12 mg/g, respectively).
Table 4. Antioxidant capacities of the samples.
Sample DPPH
scavenging capacity (mg TE/g
extract)
ABTS scavenging
capacity (mg TE/g
extract)
CUPRAC (mg TE/g extract)
FRAP (mg TE/g
extract)
AP-1B 24.18±0.62a 61.09±1.03a 93.55±0.89a 41.93±0.39a
AP-1F 9.44±0.81a 41.34±0.95b 62.85±1.22a 21.43±0.42b
AP-1S 35.42±0.59a 76.45±0.83b 101.78±1.33a 55.86±0.83b
AP-2B 15.73±0.44a 55.29±0.26b 71.26±0.84a 41.68±1.07c
AP-2F 18.93±0.71a 58.96±0.99c 79.64±0.54a 45.71±0.52b
AP-2S 38.19±0.26a 95.68±0.17b 119.63±1.08a 70.12±0.16b
Values are means±SD of three measurements; TE – Trolox equivalents. Superscripts indicate significant differences in the studied extracts (P<0.05).
Statistical analysis
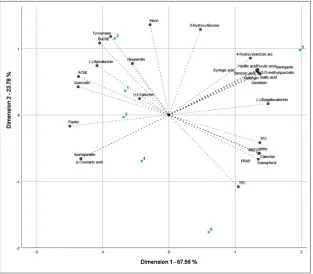
To gain insight into the relationship between the results of the various analyses, PCA was applied and a two-dimensional PCA scatter plot (based on the first two principal components (PCs)) was created (Fig. 1). The two principal components (PC1 and PC2) were found to provide for 91.34% of the total variance in the data, with PC1 and PC2 individually explaining 67.56% and 23.78% of the variability, respectively. It should be noted that the IC50 values of the samples were found to be inversely proportional to their activity potency. Therefore, the negative correlation between the samples with the data of enzyme inhibitory activity should be taken into consideration. As shown in Fig. 1, AP-2S had the most potent total bioactive components. The most distinguishing compounds were catechol and kaempferol for AP-2S and the phenolic acids, except for p-coumaric acid for AP-1S. In addition, the Tukey test was applied to the data. Significant differences were observed among all groups except vanillic acid, quercetin, isorhamnetin, galangin, 3-hydroxyflavone and epicatechin (Table 2).
DISCUSSION
the AP-2 samples were observed to contain higher levels of total phenolic contents. The stem extracts of both plants were found to have the highest TPC. Us-ing LC-MS/MS analysis to quantify various phenolic compounds, thirteen of the analyzed compounds (gallic acid, benzoic acid, 4-hydroxybenzoic acid, vanillic acid, ferulic acid, syringic acid, kaempferol, 3-O-methylquercetin, galangin, naringenin, genistein, catechol, epigallocatechin gallate) in AP-1S were found to be major compounds, while AP-1F had four major compounds (p-coumaric acid, fisetin, 3-hydroxyfla-vone, hesperidin), and AP-1B had three (quercetin, isorhamnetin, epicatechin). A similar situation was observed in the extracts of AP-2. Phenolic compounds are thought to serve various functions in plants, in-cluding attracting pollinators, providing antioxidant activity and protecting against UV light and pests [2]. Therefore, environmental factors, such as the soil structure, temperature and/or physiological factors of the plants were most likely responsible for these differences in the phenolic contents of the samples. In the literature, bulbs of A. subhirsutum [15] and A. roseum var. odoratissimum [32], leaves of A. ursinum [33], aerial parts of A. nigrum [15] and A. orientale
[34] and flowers of A. scorodopra-sum [14] have been reported to be richer in phenolics than other parts. Additionally, the phenolic compounds of some Allium species have previously been investigated quantitatively with LC. Specifically, eriodictyol in A. scorodoprasum [14], 3-hydroxybenzoic acid in A. nigrum [15], p-coumaric acid in A. subhirsutum [15], protocatechuic acid in A. hookeri [35], isorhamne-tin in A. flavum subsp. flavum [36] and malic acid in A. macrochaetum [37] are the most dominant phenolic compounds in these species.
Phenolic compounds have sig-nificant antioxidant activity, there-fore a linear relation was observed between TPCs and antioxidant ca-pacities of samples. AP-2 samples showed higher radical scaveng-ing (DPPH, ABTS) and reducscaveng-ing power (CUPRAC, FRAP) activities compared to 1 extracts. The flower extract of AP-1, which had a low TPC, had the lowest antioxidant activity. These results are similar to those found for the different parts of A. ursinum [32], A. orientale [33], A. roseum var. odoratissimum [31],A. scorodoprasum [14] and A. hookeri [35], in which the parts with the highest TPC showed the highest antioxidant activity.
Owing to the greater amounts of bioactive com-pounds, AP-2S was found to be the most potent sample in terms of both antioxidant and enzyme inhibitory activities. Flavonoids, which were determined to be present at higher concentrations in LC-MS/MS analy-sis, may well have contributed to the cholinesterase inhibitory activity of all samples. Kaempferol, galangin, naringenin, genistein, morin and (-)-epigallocatechin gallate have been reported to possess potent anticho-linesterase activities [38-40]. Additionally, phenolic substances such as 4-hydroxybenzoic acid, vanillic acid, p-coumaric acid, (-)-epigallocatechin gallate, kaempferol and catechol may account for some of the antityrosinase activity of the extracts. In the literature, regarding these phenolics, 4-hydroxybenzoic acid, van-illic acid, (-)-epigallocatechin gallate and kaempferol Fig. 1. Principal component analysis of the results of investigations. 1 – 1B; 2 –
have been identified as being strong antityrosinase compounds [41]. Also, catechol, with its dihydroxy-phenol structure, and p-coumaric acid, with a similar chemical structure to L-tyrosine, serve as substrate molecules for tyrosinase [42,43].
In conclusion, in the present study the phenolic composition and anti-cholinesterase, antityrosinase and antioxidant activities of different parts of A. pal-lens collected from different localities, were analyzed for the first time. The results of our analyses revealed that the concentrations and distributions of phenolic compounds of the various samples were quite different. The extracts had variable biological activities due to their differing contents of bioactive compounds. This study contributes to further investigations of Allium species. It shows that A. pallens collected from Bozdağ, Ödemiş, Turkey could serve as a natural source for in vivo research of diseases related to cholinesterase and tyrosinase inhibition.
Funding: This study was financially supported by TUBITAK (217S341). We also thank the Pharmaceutical Sciences Research Centre (FABAL) of Ege University Faculty of Pharmacy for equip-ment support.
Acknowledgments: The authors are thankful to Dr. Hasan Yıldırım from the Department of Biology, Botany Section, Faculty of Sci-ence, Ege University, Turkey for plant identification.
Author contributions: CE examined the biological activities of the samples. AE determined the phenolic profiles of the samples, designed the experiments, analyzed the data, supervised the study and wrote the article.
Conflict of interest disclosure: The authors declare no conflict of interest.
REFERENCES
1. Lattanzio V. Phenolic Compounds: Introduction. In: Ramawat KG, Merillon JM, editors. Handbook of natural products. Ber-lin, Heidelberg: Springer-Verlag; 2013. p. 1544-73.
2. Reis Giada ML. Food phenolic compounds: main classes, sources and their antioxidant power In: Morales-Gonzalez A, editor. Oxidative stress and chronic degenerative diseases. London: IntechOpen; 2013. p. 27-112.
3. Zhang H, Tsao R. Dietary polyphenols, oxidative stress and antioxidant and anti-inflammatory effects. Curr Opin Food Sci. 2016;8:33-42.
4. Castellano G, Tena J, Torrens F. Classification of phenolic compounds by chemical structural indicators and its relation to antioxidant properties of Posidonia Oceanica (L.) Delile. Match. 2012;67(1):231-50.
5. Gonçalves S, Romano A. Inhibitory properties of phenolic compounds against enzymes linked with human diseases. In: Soto-Hernández M, editor. Phenolic compounds - biological activity. London: IntechOpen; 2017. p. 99-118.
6. Hopkins AL, Groom CR. The druggable genome. Nat Rev Drug Discov. 2002;1(9):727-30.
7. Weinstock M. Selectivity of cholinesterase inhibition: clinical implications for the treatment of Alzheimer’s Disease. CNS Drugs. 1999;12(4):307-23.
8. Govaerts R, Kington S, Friesen N, Fritsch R, Snijman DA, Marcucci R, Silverstone-Sopkin PA, Brullo S. 2005-2019, World checklist of Amaryllidaceae [Internet]. Facilitated by the Royal Botanic Gardens, Kew. [cited 2019 Apr 25]. Avail-able from: http://apps.kew.org/wcsp/.
9. Fritsch RM, Abbasi M. New taxa and other contributions to the taxonomy of Allium L. (Alliaceae) in Iran. Rostaniha. 2008;10(2008):1-76.
10. Angiosperm Phylogeny Group. An update of the Angio-sperm Phylogeny Group classification for the orders and the families of the flowering plants: APG III. Bot J Linn Soc. 2009;161:105-21.
11. Iciek M, Kwiecien I, Włodek L. Biological properties of gar-lic and gargar-lic-derived organosulfur compounds. Environ Mol Mutagen. 2009;50:247-65.
12. Corzo-Martínez M, Corzo N, Villamiel M. Biological proper-ties of onions and garlic. Trends Food Sci Tech. 2007;18:609-25. 13. Hadacova V, Vackova K, Klozova E, Kutacek M, Pitterova K. Cholinesterase activity in some species of the Allium Genus. Biologia plantarum. 1983;25(3).
14. Mollica A, Zengin G, Locatelli M, Picot-Allain CMN. Maho-moodally MF. Multidirectional investigations on different parts of Allium scorodoprasum L. subsp. rotundum (L.) Stearn: Phenolic components, in vitro biological, and in silico pro-pensities. Food Res Int. 2018;108:641-9.
15. Emir A, Emir C, Yıldırım H. Characterization of phenolic profile by LC-ESI-MS/MS and enzyme inhibitory activities of two wild edible garlic : Allium nigrum L. and Allium sub-hirsutum L. J Food Biochem. 2020;44(4):e13165.
16. Brullo S, Guglielmo A, Pavone P, Salmeri C. Cytotaxonomi-cal remarks on Allium pallens and its relationships with A. convallarioides ( Alliaceae ). Bocconea. 2003;16(2):557-71. 17. Kollmann F. Allium L., In: Davis PH, editor. Flora of Turkey
and the East Aegean Islands 8. Edinburgh: Edinburgh Uni-versity Press; 1984. p. 98-211.
18. Singleton VL, Orthofer R, Lamuela-Raventos RM. Analysis of total phenols and other oxidation substrates and antioxi-dants by means of Folin-Ciocalteu reagent. Method Enzymol. 1999;299:152-78.
19. Chang C, Yang M, Wen H, Chern J. Estimation of total flavo-noid content in propolis by two complementary colorimetric methods. J Food Drug Anal. 2002;10:178-82.
20. Ellman L, Courtney KD, Andres Jr V, Featherstone RM. New and rapid colorimetric determination of acetylcholinesterase activity. Biochem Pharmacol. 1961;7:88-95.
21. Emir C, Emir A, Bozkurt B, Somer NU. Phytochemical con-stituents from Galanthus alpinus Sosn. var. alpinus and their anticholinesterase activities. S Afr J Bot. 2019;12:63-7. 22. Masuda T, Yamashita D, Takeda Y, Yonemori S. Screening for
identification of potent inhibitors from Garcinia subelliptica. Biosci Biotechnol Biochem. 2005;69(1):197-201.
23. Blois MS. Antioxidant determinations by the use of a stable free radical. Nature. 1958;181:1199-200.
24. Stämpfli R, Brühwiler P, Mourad S, Verdejo R, Shaffer M. Development and characterisation of carbon nano-tube-reinforced polyurethane foams. EMPA Activities. 2007;26(2007):51.
25. Apak R, Güçlü K, Özyürek M, Çelik SE. Mechanism of antioxidant capacity assays and the CUPRAC (cupric ion reducing antioxidant capacity) assay. Mikrochim Acta. 2008;160(4):413-19.
26. Benzie I, Strain J. The ferric reducing ability of plasma (FRAP) as a measure of “antioxidant power”: the FRAP assay. Anal Biochem. 1996;239(1):70-6.
27. Mesulam M, Geula C. Butyrylcholinesterase reactivity differ-entiates the amyloid plaques of aging from those of dementia. Ann Neurol. 1994;36:722-7.
28. Zolghadri S, Bahrami A, Hassan Khan MT, Munoz-Munoz J, Garcia-Molina F, Garcia-Canovas F, Saboury AA. A compre-hensive review on tyrosinase inhibitors. J Enzyme Inhib Med Chem. 2019;34(1):279-309.
29. Martinez MV, Whitaker JR. The biochemistry and control of enzymatic browning. Trends Food Sci Tech. 1995;6:195-200. 30. Asanuma M, Miyazaki I, Ogawa N. Dopamine- or L-DOPA-induced neurotoxicity: The role of dopamine quinone forma-tion and tyrosinase in a model of Parkinson’s disease. Neuro-tox Res. 2003;5(3):165-76.
31. Tessari I, Bisaglia M, Valle F, Samorì B, Bergantino E, Mammi S, Bubacco L. The reaction of α-synuclein with tyrosinase: Possible implications for Parkinson disease. J Biol Chem. 2008;283(24):16808-17.
32. Dziri S, Hassen I, Fatnassi S, Mrabet Y, Casabianca H, Hanchi B, et al. Phenolic constituents, antioxidant and antimicrobial activities of rosy garlic (Allium roseum var. odoratissimum). J Funct Foods. 2012;4(2):423-32.
33. Lachowicz S, Kolniak-Ostek J, Oszmiański J, Wiśniewski R. Comparison of phenolic content and antioxidant capacity of bear garlic (Allium ursinum L.) in different maturity stages. J Food Process Preserv. 2017;41(1).
34. Ceylan O, Alic H. Antibiofilm, antioxidant, antimutagenic activities and phenolic compounds of Allium orientale Boiss. Braz Arch Biol Technol. 2015;58(6):935-43.
35. Park SY, Je JY, Ahn CB. Phenolic composition and hepatopro-tective activities of Allium hookeri against hydrogen-perox-ide-induced oxidative stress in cultured hepatocytes. J Food Biochem. 2016;40(3):284-93.
36. Simin N, Orcic D, Cetojevic-Simin D, Mimica-Dukic N, Anackov G, Beara I, Mitic-Culafic D, Bozin B. Phenolic pro-file, antioxidant, anti-inflammatory and cytotoxic activities of small yellow onion (Allium flavum L. subsp. flavum, Allia-ceae). Lebenson Wiss Technol. 2013;54(1):139-46.
37. Demirci Kayiran S, Eroglu Ozkan E, Mataraci Kara E, Yilmaz MA, Zengin G, Boga M. Comprehensive analysis of an unin-vestigated wild edible medicinal garlic species from Turkey: Allium macrochaetum Boiss. & Hausskn. J Food Biochem. 2019;43:e12928.
38. Katalinić M, Rusak G, Domaćinović Barović J, Šinko G, Jelić D, Antolović R Kovarik Z. Structural aspects of flavonoids as inhibitors of human butyrylcholinesterase. Eur J Med Chem. 2010;45(1):186-92.
39. Remya C, Dileep KV, Tintu I, Variyar EJ Sadasivan C. Design of potent inhibitors of acetylcholinesterase using morin as the starting compound. Front Life Sci. 2012;6(3-4):107-17. 40. Balkis A, Tran K, Lee YZ, Ng K. Screening flavonoids for
inhibition of acetylcholinesterase identified baicalein as the most potent inhibitör. J Agr Sci. 2015;7:26-35.
41. Wang HM, Chou YT, Hong ZL, Chen HA, Chang YC, Yang WL, Chang HC, Mai CT, Chen CY. Bioconstituents from stems of Synsepalum dulcificum Daniell (Sapotaceae) inhibit human melanoma proliferation, reduce mushroom tyrosinase activity and have antioxidant properties. J Taiwan Inst Chem Eng. 2011;42:204-11.
42. Boo YC. p-Coumaric acid as an active ingredient in cosmet-ics: A review focusing on its antimelanogenic effects. Anti-oxidants. 2019;8(8):E275.