ISSN 2307-7743 http://scienceasia.asia
_______________
2010 Mathematics Subject Classification: 00A71.
Key words and phrases: Addis Ababa, Endemic, Rabies, Reproduction number, Sensitivity analysis.
© 2015 Science Asia 1 / 23 SENSITIVITY ANALYSIS AND NUMERICAL SIMULATIONS FOR THE MATHEMATICAL
MODEL OF RABIES IN HUMAN AND ANIMAL WITHIN AND AROUND ADDIS ABABA
TESFAYE TADESSE’ EGA, LIVINGSTONE S. LUBOOBI, DMITRY KUZNETSOVAND ABRAHAM HAILE KIDANE Abstract: Rabies is one of the neglected tropical diseases that has persisted for centuries in Ethiopia, and it is endemic within and around Addis Ababa. For the purpose of studying the dynamics of the disease we propose a deterministic mathematical model with human, dog and livestock populations and formulated as a system of ordinary differential equations. Basic reproduction number R0 and effective reproduction number Re are computed using next generation operator. Sensitivity analysis of Re shows the natural death rate of dogs 𝜇𝑑 , the annual birth rate of dogs 𝜗𝑑, dog-to-dog transmission rate 𝛽𝑑, and disease induced death rate 𝜎𝑑 are found to be the most sensitive parameters of Re . According to numerical simulations of our system rabies transmission will increase within and around Addis Ababa, and may peak in 2024 and 2026 in human and livestock populations respectively. Our simulation shows that 25% vaccination coverage in livestock populations will reduce the future infection by half. This study suggests that a combination of interventions consisting of 60% of vaccination coverage in dog populations, 15% culling of stray dogs, and reducing annual crop of newborn puppies by 25% will reduce the number of human and livestock infections by 70%, and the disease will be eradicated from the community.
1. Introduction
Rabies is a zoonotic viral disease that causes an acute inflammation of brain in human and other warm blooded animals. It is transmitted by saliva of an infected animal via bites or scratches. Once the virus enters the body through a skin opening, it travels via nerve tissues to the brain where the virus duplicates itself. During this time the host experiences a range of symptoms from fever to hallucinations, paralysis, and eventually death [2, 9]. Salivary glands are attacked after the virus duplicates in the brain, then the saliva becomes the main instrument for infecting other animals.
Rabies is transmitted among animals and to human through bites or scratches of a rabid animal. Many mammals can transmit the rabies virus, but in many parts of the world rabies is spread through infected domestic dogs. More than 3 billion people in developing countries are exposed to dog rabies [9]. Dogs are the source for almost all types of human and livestock infections [5]. The saliva of an infected dog capable of transmitting the virus through scratches or bite to another animals such as another dog, cat, mule or cattle which can become rabid as well. The infected animal will demonstrate all symptoms and eventually die. Besides its effects on humans directly, rabies also puts a significant burden on the livestock population in Africa and Asia. This can be directly reflected by its economic effect on rabies endemic areas. Africa and Asia lose US$12.3 million annually because of deaths of livestock due to rabies [8].
Rabies is highly endemic to Ethiopia. It was estimated that 10, 000 people die due to rabies annually, which makes Ethiopia to be one of the worst affected countries in the world. Low awareness and lack of accurate quantitative information on rabies both in human and animal populations prevent people from applying effective control measures. In most cases individuals who are bitten by rabid dogs go to traditional healers, which interfere post exposure prophylaxis [8].
In most cases rabies transmission is very high in urban places because of the high number of domestic dogs [9]. The major cause of spread of rabies in these regions is urbanization. It is estimated that the dog to human population ratio in Ethiopia is 1:6 in urban and 1:8 in rural areas. The number of dogs in Addis Ababa is estimated to be between 150 000 to 200 000 [14]. Despite vaccination and other control measures, rabies has persisted for centuries and it is reported from all regions of Ethiopia [15]. The first occurrence of rabies in Addis Ababa was recorded in August, 1903, and it was known by its traditional name called mad dog disease [13]. Addis Ababa and its surroundings are the endemic parts of the country. It was reported that around 2000 people are bitten by dogs annually within and around Addis Ababa [3]. A retrospective record review from 2001 to 2009 show that 386 human fatal rabies cases occurred, with an annual range of 35 to 58; From this, 42.72% were children under the age of 14 [5].
Mathematics has played a very important role in understanding and controlling the spread of infectious diseases, and it is a powerful tool for analyzing and predicting the dynamics of phenomena. It also helps medical professionals to organize their thinking [6, 11].
Some studies have been done using mathematical models to analyze the dynamics of rabies transmission among dogs and from dogs to humans, but none of them incorporate livestock populations which are the livelihood of poor communities.
ordinary differential equations. The reproductive ratio without vaccination was determined to be greater than one which shows the virus will be endemic, and less than one with vaccination, which shows that the disease dies out. The study also applied sensitivity analysis to the model by using different numbers of infectious dogs and vaccinated dogs. The study determines the reproductive number, R0of rabies transmission decrease as vaccination introduce to the model. In addition, the model shows that rabies transmission can be decreased by the strategy of keeping dogs confined within their household.
The other deterministic SEIR model was developed by Zhang et al. [19] to analyze and control the transmission of rabies among dogs and from dogs to human in China. Both dogs and humans were included and classified into susceptible, exposed, infectious, and recovered classes. They first simulated human rabies from 1996 to 2010 using the data reported by Chinese Ministry of Health, and the numerical simulation they got significantly supported the data. They also estimate the basic reproductive rate R0 2 for rabies
transmission in China. Sensitivity analysis of R0 was performed in terms of the model parameters and compare the effects of culling and immunizing of dogs. Their results show that reducing dog birth rates and increasing dog immunization coverage rates are the most effective methods in controlling human rabies infection in China. They recommend that culling of dogs can be replaced by immunization of dogs. The reason is that in the process of culling of dogs human community can be disturbed. Additionally culling can cause increased movement of infected dogs to less infected areas. Their model predicted that rabies transmission in China will decrease for the coming 7 to 8 years and it will peak again in 2030. SEIV (Susceptible-Exposed–Infectious–Vaccinated) model was formulated by Hou et al. [7] for the transmission of rabies among dogs, and from dogs to human in the context of Guangdong province of China. In their model domestic and stray dogs were taken as different groups, and the model was governed by twelve differential equations. In their study the sensitivity analysis of the reproduction rate was determined in terms of various parameters. The reproduction rate was R0 1.65which is less compared to [19]. According to their
results the recruitment rate of domestic dogs, the number of stray dogs and the valid time of immunity play a very important role for the transmission of rabies.
2. Materials and Methods
2.1Model Formulation
In this chapter we formulate SEIR (Susceptible-Exposed-Infected-Recovered) model of rabies for human, dog and livestock populations. We categorize the human, dog and livestock populations into susceptible, exposed, infected and recovered groups. Susceptible groups have no disease, but they are likely to be infected in case of contact with rabid dogs. Exposed individuals are those who contracted the virus via bites or scratches, but still they have not shown symptoms. Infected individuals are those who develop clinical symptoms and they are unlikely to recover due to the nature of rabies. The recovered classes are those who recovered through vaccination before they reach infectious stage, whereas the rest get infected and die eventually.
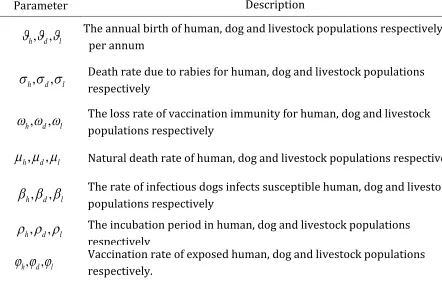
All the parameters of the model are positive and they are introduced in Table 2.1 Table 1: Description of parameters.
Parameter Description
, ,
h d l
The annual birth of human, dog and livestock populations respectivelyper annum
,
,
h d l
Death rate due to rabies for human, dog and livestock populationsrespectively
,
,
h d l
The loss rate of vaccination immunity for human, dog and livestockpopulations respectively
,
,
h d l
Natural death rate of human, dog and livestock populations respectively,
,
h d l
The rate of infectious dogs infects susceptible human, dog and livestockpopulations respectively
,
,
h d l
The incubation period in human, dog and livestock populationsrespectively
, ,
h d l
Vaccination rate of exposed human, dog and livestock populationsrespectively.
The human population is grouped into susceptible, 𝑆ℎ, exposed, 𝐸ℎ, infectious, 𝐼ℎ, and recovered, 𝑅ℎ. Individuals are recruited to susceptible class by birth at 𝜗h to susceptible
human. A susceptible man bitten by a rabid dog becomes exposed. If post-exposure treatment is not given the person become infectious and dies since there is no recovery at infectious stage.
The dog population is divided in to susceptible, 𝑆𝑑 , exposed, 𝐸𝑑, infectious, 𝐼𝑑 and
dogs vaccination is applied at a rate of d. This is because it is the dog population which
infects both human and livestock populations. An exposed dog moves to the infectious class directly since the community cannot observe which dog is infected as many dogs are very mobile around the city.
Livestock populations are also divided into susceptible, 𝑆𝑙, exposed, 𝐸𝑙, infectious, 𝐼𝑙and recovered, 𝑅𝑙. Individuals are recruited to susceptible class by birth at l. Members of the
susceptible class contract the disease from dog bites or scratches. Livestock which are bitten by a rabid dogs become exposed. If post exposure treatment is provided the individual moves to recovered class before reaching the infectious stage.
Our model is developed based on the following assumptions. Susceptible populations are recruited by birth at ; Rabies transmission among humans, among livestock and between human and livestock was ignored due to negligible cases; An individual who is bitten or scratched by rabid dog becomes exposed; Individuals in each group have equal natural death rate; Populations are homogeneous, that is each individual has equal probability of being bitten or scratched by a dog and thereby contracting the diseases; Once an individual reaches to infectious stage there is no recovery and death is 100% certain.
2.2Model Compartment and Dynamics
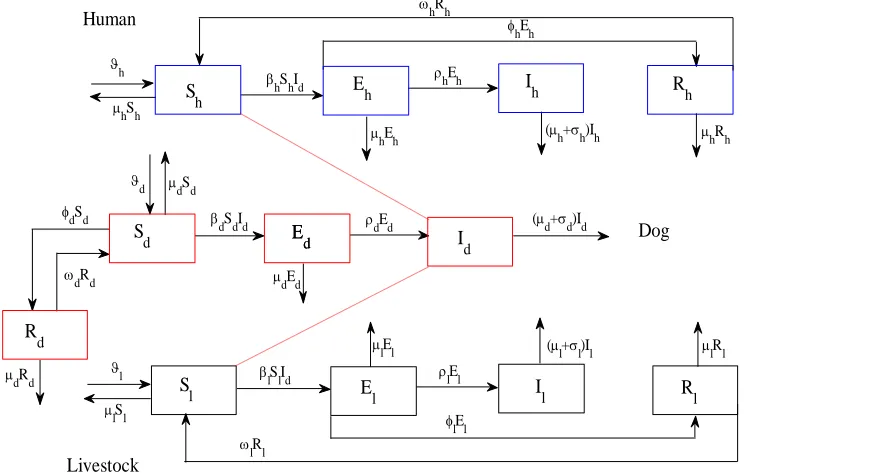
Figure 1: Flow diagram for rabies transmission among dogs and to human and livestock in which the parameters are as defined in Table 1.
Using the assumptions, definition of variables and parameters, the model flow diagram which depicts the dynamics of rabies transmission among dogs and from dogs to both human and livestock is shown in Figure 1.
I
h Rh
E
h
hRh
Sh
E
d
S
d Ed
Rd
I
d
S
l El Il Rl
lEl
dSdId dEd (d+d)Id
lRl
hEh
dRd
d
dSd
hEh
hRh (h+h)Ih
h
dEd
dRd
l
lSl
lRl
lEl
(
l+l)Il
hShId hEh
lSlId lEl
dSd
hSh
Dog
The parameters of the model are positive. i where ih d l, , represents the annual birth of dog, human and livestock populations respectively. Exposed populations of human and livestock can recover through post exposure treatment. The parameters i where ih d l, ,
represent the latency rates of human, dog and livestock population respectively so that 1
𝜌𝑖 where ih d l, , are the corresponding incubation periods.
2.3Model Equations
Based on the assumptions and interrelation between the variables and parameters in Fig.1 rabies transmission dynamics can be described by using ordinary differential equations.
( )
( )
( )
h
h h h h d h h h
h
h d h h h h h
h
h h h h h
h
h h h h h
dS
R I S S
dt dE
I S E
dt dI E I dt dR E R dt
Human (1a)
( )
( )
( )
( )
d
d d d d d d d d
d
d d d d d d
d
d d d d d
d
d d d d d
dS
R I S
dt dE
S I E
dt dI E I dt dR S R dt
Dog (1b)
( )
( )
( )
l
l l l l d l l l
l
l d l l l l l
l
l l l l l
l
l l l l l
dS
R I S S
dt dE
I S E
dt dI E I dt dR E R dt
Livestock (1c)
( ) ( ) ( ) ( ) ( )
( ) ( ) ( ) ( ) ( )
( ) ( ) ( ) ( ) ( )
h h h h h
d d d d d
l l l l l
N t S t E t I t R t
N t S t E t I t R t
N t S t E t I t R t
Therefore adding each of the differential equations of system (1) of human, dog and livestock populations will give us:
h
h h h h h
d
d d d d d
l
l l l l l
dN
N I
dt dN
N I
dt dN
N I
dt
(2)
where Ni, ih d l, , is the total of human, dog and livestock populations at time t.
Invariant Region
The model system represented by (1) dealing with human, dog and livestock population will be analyzed in the feasible region, and all state variables and parameters are assumed to be positive for all t ≥ 0. The invariant region will be obtained through theorem 1.
Theorem 1:
All solutions of the system (1) are contained in the region Φ 12
and = h d l
4 4 4
.
Proof. The model system (1) was grouped in to Human Nh, Dog Nd and livestock Nl. Such that
4
{( , , , ) : 0 h}
h h h S E I Rh h h h N
4
{( , , , ) : 0 d}
d d d S E Id d d Rd N
4
{( , , , ) : 0 l}
l l l S E I Rl l l l N
and is the positive invariant for system (1)
Thus = h d l 4 4 4.
3. Model Analysis
3.1Disease Free Equilibrium Points (DFE)
To find the disease free equilibrium points we set the right hand side of equations of system (1) equal to zero. In the absence of attack or in the absence of rabies the following compartments will be zero.
0
h h h d d l l l
E
R
I
E
I
E
R
I
then the disease free equilibrium (DFE)
0 will be0 0
0
0 0 0 0
( , 0, 0, 0, , 0, 0, , , 0, 0, 0)
( )
where , , and
( ) ( )
h d d l
h d d d d d l
h d d h
h d d d d d d d d l
S S R S
S S R S
For the dog population in the case of disease free equilibrium points
R
d cannot be zerobecause susceptible dogs which are vaccinated transfer to recovered class. Therefore the disease free equilibrium points of system (1) is exist and given by:
0
( )
, 0, 0, 0, , 0, 0, , , 0, 0, 0
( ) ( )
h d d d d d l
h d d d d d d d d l
(3)
3.2 The Basic Reproduction Number, R0
The basic reproduction number
R
0 is a threshold parameter defined as the average numberof secondary infection caused by an infectious individual by introducing in to a completely susceptible population. It is also called basic reproduction ratio or basic reproductive rate [6]. Basic reproduction number is very important parameter which helps to determine whether the disease spread in the population or it dies out. If R0 1, then on average an infected individual produces less than one new infected individual over the course of its infectious period, and the infection cannot grow. Conversely, if R0 1 then each infected individual produces, on average, more than one new infection, and the disease can invade the population. It is also crucial in the process of analyzing sensitive parameters which drive the dynamics of the disease and stability analysis of disease free and endemic equilibrium points.
To compute the basic reproduction number it is important to identify new infections from all other changes in the population. We used next generation operator method proposed by [16]. We considered system (1) without vaccination i.e. 0.
differentiable at least twice in each variable. The disease transmission model of system (1) consists of nonnegative initial conditions together with the following system of equations:
𝑥̇ = ℱ𝑖(𝑥) = f xi( ) v xi( ), i1,..., 6 (4)
where vi vivi
We consider expressions in which the infection is in progression. These are
, ,
, ,
and
h h d d l l
E I E I E
I
.( )
( )
( )
h
h h d h h h
h
h h h h h
d
d d d d d d
dE
S I E
dt dI
E I
dt dE
S I E
dt (5) ( ) ( ) ( ) d
d d d d d
l
l l d l l l
l
l l l l l
dI
E I
dt dE
S I E
dt dI E I dt
By rearranging equations of system (1) without vaccination from infected to infectious class of human dog and livestock population with a system of equations given by (5)
Let F be a non-negative n n matrix and V be a non-singular N-matrix such that
F = i( 0)
j f x
and V =
0 ( ) i j v x
with 1i j, n
The point 0 is the disease free equilibrium point in (3) without vaccination.
where 1 2 3 4 5 6 0 0 0
h h d
d d d i
l l d
f S I
f
f S I
f f S I f f
(6)
1 2 3 4 5 6 ( ) ( ) ( ) ( ) ( ) ( )
h h h
h h h h h
d d d
d d d d d
l l l
l l l l l
E v I E v v E v
v I E
v E
v I E
(7)
By considering the classes in which infection is on progression and using the linearization technique. The Jacobean matrices of f and v at the disease free equilibrium point 0 are
F= i
( )
0 jf
x
=0 0 0 0 0
0 0 0 0 0 0
0 0 0 0 0
0 0 0 0 0 0
0 0 0 0 0
0 0 0 0 0 0
h h h d d d l l l (8)
V= i( 0)
j v x
=0 0 0 0 0
0 0 0 0
0 0 0 0 0
0 0 0 0
0 0 0 0 0
0 0 0 0
h h
h h h
d d
d d d
l l
l l l
(9)
Solve for 1
V and multiplying it with F will give us a matrix
1
1 i( 0) i( 0)
j j f v FV x x
Choosing the maximum eigenvalue in absolute terms that is the spectral radius of the matrix
1
FV gives us the basic reproduction number which is given by:
0
( )( )
d d d
d d d d d
R
(10)
In our assumption there is no secondary infection in human and livestock population, due to this all the parameters of R0 in (10) are depending on dog population. This shows that targeting dog population in the process of combating rabies transmission is very important. Providing PEP for human or livestock population does not eradicate the disease from the community.
3.3The Effective Reproduction Number, Re
number Re of system (1) is computed by applying the same procedure of R0. The spectral radius (dominant eigenvalue) of 1
FV denoted byRe
(FV).( )
( )( )( )
d d d d d
e
d d d d d d d d
R
(11)
Since 0
( )( )
d d d
d d d d d
R
, we can express Re in terms of R0 as
0
( )
( )
d d
e
d d d
R
R
(12)
The simulation for the basic reproduction number shows that rabies transmission is very
high without any intervention. We simulated the effective reproduction number with
different vaccination coverages and a combination of interventions consisting of
vaccination, culling and controlling the annual crop of newborn puppies. The results show
that as we increase vaccination of the dog population there is a possibility for the disease to
die out. The simulations show that a combination of interventions are the best way to
reduce Re less than unity. In Fig. 2, R0 is without any vaccination, Re1 is the current 10%
vaccination coverage, Re2 is 60% vaccination coverage, Re3 is 90% vaccination coverage and
Re4 is combination of interventions consisting of 60% vaccination, 15% culling of stray dogs
Figure 2: Reproduction number for different vaccination coverages and combination of vaccination, culling and controlling newborn puppies.
From Fig. 2 we observe that Re4Re3Re2Re1R0 , which shows that as we increase vaccination of dog populations the effective reproduction number decreases and becomes less than unity. It is very important to combine different interventions so as to facilitate the eradication of the disease form the community.
3.4 Sensitivity Analysis of Re with Respect to the Model Parameters
The aim of any mathematical epidemiology study is to understand the dynamics of a disease so as to control it by targeting some sensitive parameters. This can be achieved by performing sensitivity analysis based on the model parameters. The parameters of our model are given with their descriptions in Table 2.
Sensitivity analysis tells us how each parameter of Re affects its result. This will help to
identify which parameters are most sensitive for the spread of the rabies virus, so that appropriate control measure can be taken [4]. Sensitivity analysis can be done by computing the sensitivity indices ofRe. With small variation of the parameters it is important to identify
which parameters greatly affect Re.
0 0.2 0.4 0.6 0.8 1 1.2 1.4
x 10-5 0
0.2 0.4 0.6 0.8 1 1.2 1.4 1.6 1.8 2
Exposure rate
d
R
ep
ro
d
u
ct
io
n
n
u
m
b
er
Variation of Reproduction Number with Exposure rate d
R
0
R
e1
R
e2
R
e3
R
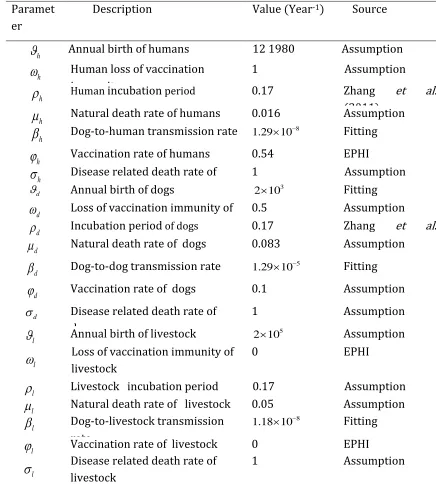
Table 2: The parameter values of the model Paramet
er
Description Value (Year-1) Source
h
Annual birth of humans 12 1980 Assumptionh
Human loss of vaccination immunity1 Assumption
h
Human incubation period 0.17 Zhang et al.(2011) h
Natural death rate of humans 0.016 Assumptionh
Dog-to-human transmission rate 81.29 10 Fitting
h
Vaccination rate of humans 0.54 EPHIh
Disease related death rate of humans1 Assumption
d
Annual birth of dogs 3
2 10 Fitting
d
Loss of vaccination immunity of dogs0.5 Assumption
d
Incubation period of dogs 0.17 Zhang et al. (2011)d
Natural death rate of dogs 0.083 Assumptiond
Dog-to-dog transmission rate 1.29 10 5 Fittingd
Vaccination rate of dogs 0.1 Assumption d Disease related death rate ofdogs
1 Assumption
l Annual birth of livestock 2 10 5 Assumption
l Loss of vaccination immunity oflivestock
0 EPHI
l Livestock incubation period 0.17 Assumptionl
Natural death rate of livestock 0.05 Assumptionl
Dog-to-livestock transmission rate8
1.18 10 Fitting
l
Vaccination rate of livestock 0 EPHIl
Disease related death rate oflivestock
1 Assumption
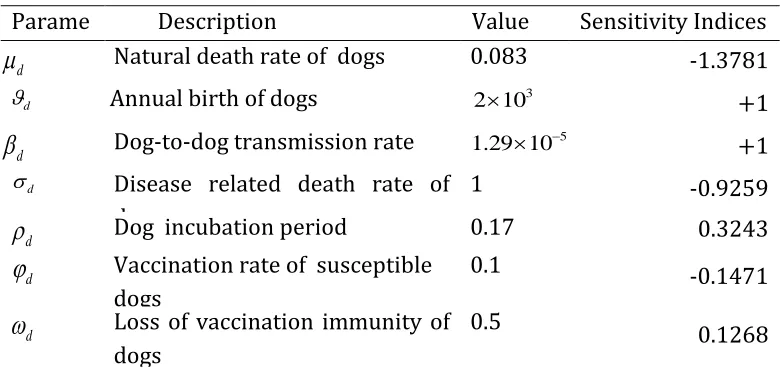
Table 3: Sensitivity indices of Re Parame
ter
Description Value Sensitivity Indices
d
Natural death rate of dogs 0.083 -1.3781d
Annual birth of dogs 3
2 10 +1
d
Dog-to-dog transmission rate 51.29 10 +1
d
Disease related death rate of dogs
1 -0.9259
d
Dog incubation period 0.17 0.3243
d Vaccination rate of susceptible dogs0.1 -0.1471
d
Loss of vaccination immunity of dogs0.5
0.1268
Definition 1: The normalized forward sensitivity index of variable g that depends on parameter b is defined as:
g b
g b b g
(13)
Since we have computed the effective reproductive number,
R
e, the normalized forwardsensitivity with respect to the parameter b is given by:
g e b
e
R b
b R
For example the sensitivity indices of
R
e with respect to
d is given by:1
d
g e d
d e
R R
(14)
By using the same notion, the sensitivity indices of the effective reproduction number given
in expression 11is computed with respect to all parameters embedded to
R
e.According to the sensitivity indices, the parameters of annual birth of dogs d and
dog-to-dog transmission rate d are the most positively sensitive parameters. This means
increasing the parameters increases the effective reproduction number and vice versa. For
instance increasing d by 10% will increase
R
e by 10%. Decreasing d by 10% willdecrease
R
e by 10%. Dog loss of vaccination immunity
d and dog incubation period
d areless sensitive positive parameters.
Natural death rate of dog d and disease related death rate d are the most negatively
value of
R
e and vice versa. For instance e dR
-1.3781 means increasing the natural death rateof dogs by 15%will decrease
R
e by 18%.In summary, targeting the most positively and negatively sensitive parameters in the process of combating rabies will be most effective in reducing the transmission of the virus within and around Addis Ababa.
4. Numerical Results and Discussion
In this section we present the numerical simulations of the system (1). We used ode45 MATLAB's standard solver for ordinary differential equations (ODEs). This function implements a Runge-Kutta method with a variable time step for efficient computation. Using the data reported from EPHI we first simulated human rabies fatal cases from 2008 to 2014. The data like the annual birth of dog populations, dog-to-dog transmission, dog-to-human transmission and dog-to-livestock transmission are not found from EPHI data, they are obtained by data fitting.
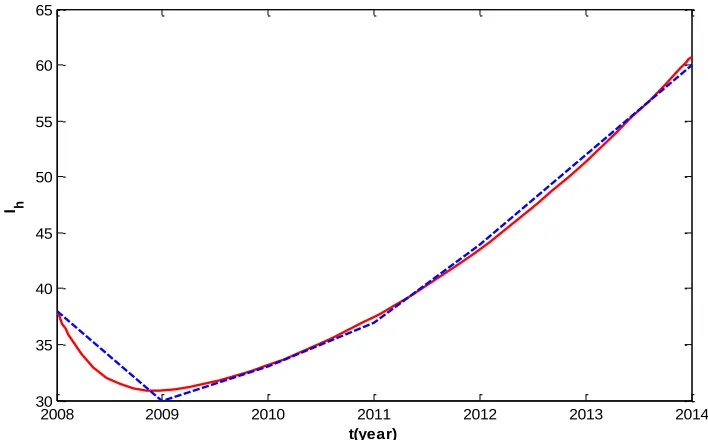
In Fig. 3 the broken curve represents the data which was reported from EPHI and the smooth curve is the simulation of the system (1) of infected human populations. There is a good match between our model and the reported data. Our simulation further predicts that human rabies will increase for the upcoming thirty two years. The simulations are based on parameters which are presented in Table 2. The initial conditions of the variables are consisting of the data that are reported from EPHI, logical assumptions and data fitting. Thus
(0) h
S = 5106, (0) h
E =100, Ih(0)= 38, Rh(0)=2.5104, (0) d
S =3105, (0) d
E = 8000, Id(0)
=4000, Rd(0)=5104, (0) l
E = 2.5105, (0) l
Figure 3: Comparison between reported data and simulation of system (2.1) for rabies infected humans in and around Addis Ababa from 2008 to 2014.
In Fig. 4 the numerical result of the infected human population shows that the rabies virus will spread very rapidly in the coming years and it will peak in 2024. The bite of a rabid dog is the main reason for the transmission of rabies to humans. The increased number of dogs within and around Addis Ababa raises the number of stray dogs. Surveys indicate that in Addis Ababa, 1299 dog bites and/or scratches were reported in humans for the period September 2008 to August 2009. The majority of bites were made by stray dogs [12]. This indicates that there is a need for stray dog control strategy to reduce the number of human infections.
From our sensitivity analysis, we found that annual dog birth is one of the sensitive parameters which controls the dynamics of the disease. A minor increase in newly born puppies increases human infection and vice versa. Fig. 5 shows a different figure of annual birth of dogs versus human infection. It can be noted that applying a strategy to control the annual birth of new born puppies is one of the most effective ways to reduce human rabies.
2008 2009 2010 2011 2012 2013 2014
30 35 40 45 50 55 60 65
Figure 4: The dynamics of rabies in infected humans for the next 32 years in and around Addis Ababa.
Figure 5: The effect of annual birth of dogs d for human rabies infection.
From the data fitting the annual birth of dogs is estimated to be 20 000. Replacing this value with a lower estimate of 18 000 annual dog birth significantly decreases human infection. This shows that targeting the annual birth of the dog population is very significant to reduce human infection.
0 5 10 15 20 25 30 35 40
20 40 60 80 100 120 140 160
t(year)
I h
0 5 10 15 20 25 30 35 40
20 40 60 80 100 120 140 160
t(year)
I h
d=2x10⁴
d=1.8x10⁴
d=1.4x10⁴
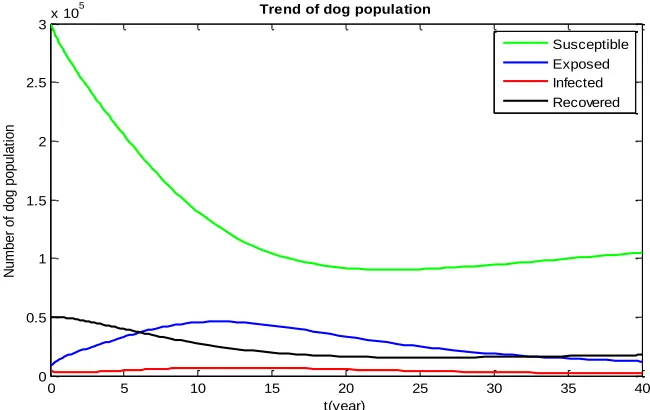
Figure 6: Transmission of rabies in dog population in 40 years’ time.
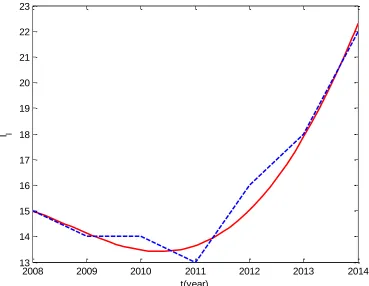
The numerical solution for the dog population in Fig. 6 shows that based on the current condition of rabies transmission dynamics the disease will not perish. As the susceptible dog population decreases, exposed and infected populations increase. Dog-to-dog transmission is higher than dog-to-human or dog-to-livestock transmission. It is estimated that 70% of the total dog population in Addis Ababa is stray dogs and rabies transmission is more likely in stray dogs than owned dogs. In most cases a stray dog which bites a human will run away. This complicates the quarantine process and the stray dog continues to spread the virus. Fig.7 shows rabies prevalence in the livestock population within and around Addis Ababa. According to the information we got from EPHI there is no rabies vaccine for livestock being used in Ethiopia and little is known about the status of rabies in livestock populations. In our simulation we show how rabies vaccination of livestock has the potential to reduce rabies livestock infection, if this intervention was applied in Ethiopia.
The broken curve in Fig.7 shows the data reported from EPHI for rabies infected livestock populations. The smooth curve is the simulation of our system. The number of infected livestock decreases from 2008 to 2011 and it increases rapidly from 2011 onwards. The transmission of the rabies virus in livestock populations is underestimated; it is likely there are more livestock infection cases which are not reported to EPHI.
0 5 10 15 20 25 30 35 40
0 0.5 1 1.5 2 2.5
3x 10
5
t(year)
N
u
m
b
e
r
o
f
d
o
g
p
o
p
u
la
ti
o
n
Trend of dog population
Figure 7: Comparison between the reported data and the model simulation of infected livestock population from 2008 to 2014.
Figure 8: The trend of livestock populations with different vaccination coverage in 40 years time.
Fig.8 shows that the rabies virus increases rapidly in the livestock population for the coming fifteen years and will peak in 2026. Aside from control measures which should be taken in
2008 2009 2010 2011 2012 2013 2014
13 14 15 16 17 18 19 20 21 22 23
t(year) I l
0 5 10 15 20 25 30 35 40
0 20 40 60 80 100 120 140 160 180 200
t(year) I l
Infected livestock
dog populations there is a possibility to reduce the disease by applying 25% vaccination coverage in the livestock population, which can cut the number of livestock infections predicted around 2026 by half. Our simulation shows there is no way to eliminate rabies disease by increasing vaccination of livestock alone. With each increase of 25% vaccination coverage the total impact in terms of reductions of rabies infected livestock gets smaller. Even 75% vaccination coverage does not lead to the elimination of the disease. For this reason, we recommend that reducing rabies transmission in the dog population is the best method for controlling the transmission in human and livestock populations.
5. Conclusion
In this paper we have formulated an SEIR model of rabies with vaccination. We have computed the basic reproduction number R0 2and the effective reproduction number
1.6
e
R , which shows rabies is endemic within and around Addis Ababa. The current 10% vaccination coverage for dog population is very less. Immunization of dogs have to be increased by combining with other intervention strategies. Combination of interventions in
dog populations can greatly reduce rabies infection in human and livestock populations. A 60%
vaccination coverage in the dog population reduces the threshold parameter 𝑅𝑒 less than unity, which means rabies will die out from the community. A more aggressive intervention consisting of 60% vaccination coverage in dog populations, 15% culling of stray dogs and reducing the annual crop of newborn puppies by 25% will reduce the number of human and livestock infection by 70% which leads to a fast eradication of the disease from the community. In Fig. 9 the upper curves show human and livestock infection cases before interventions in dog populations. After combining interventions in dog populations, the number of infected cases in livestock and humans are greatly reduced as shown by lower line curves.
the coming thirty years. This can be observed from Fig.10 by taking the difference between the curves of no vaccination and 25% vaccination.
Figure 9: Effects of combining interventions in dog populations (cid) on human and livestock rabies infection.
As we increase vaccination coverage for livestock populations the number of livestock infection reduces, we strongly recommend that more control measures should be adopted to save many numbers of vulnerable livestock populations. But this should be combined with the control measures which we recommended for dog population.
Figure 10: Comparison between no vaccination and 25% vaccination for rabies infected livestock.
0 5 10 15 20 25 30 35 40
0 20 40 60 80 100 120 140 160 180 200
t(year)
th
e
n
u
m
b
e
r
o
f
in
fe
ct
e
d
h
u
m
a
n
a
n
d
li
ve
st
o
ck
infected human before cid infected livestock before cid infected human after cid infected livestock after cid
0 5 10 15 20 25 30 35 40
0 20 40 60 80 100 120 140 160 180 200
Infected Livestock Population
t(year)
Il
REFERENCES
[1] Acha, P. N., & Arambulo, P. V. (1985). Rabies in the tropics—history and current status. In Rabies in the
tropics (pp. 343-359). Springer Berlin Heidelberg.
[2] Addo, K. M. (2012). An SEIR Mathematical Model for Dog Rabies. Case Study: Bongo District, Ghana,MSc.
Dessertation Kwame Nkrumah University of Science and Technology,p 4-8
[3] Ali, A., Mengistu, F., Hussen, K., Getahun, G., Deressa, A., Yimer, E., & Tafese, K. (2010). Overview of Rabies in and around Addis Ababa, in Animals Examined in EHNRI Zoonoses Laboratory Between, 2003 and 2009. Ethiopian Veterinary Journal, 14(2), 91-101.
[4] Chitnis, N., Hyman, J. M., & Cushing, J. M. (2008). Determining important parameters in the spread of malaria through the sensitivity analysis of a mathematical model. Bulletin of mathematical biology, 70(5), 1272-1296.
[5] Deressa, A., Ali, A., Bayene, M., Selassie, B. N., Yimer, E., & Hussen, K. (2010). The status of rabies in Ethiopia: A retrospective record review. Ethiopian Journal of Health Development, 24(2).
[6] Hethcote, H. W. (2000). The mathematics of infectious diseases. SIAM review, 42(4), 599-653.
[7] Hou, Q., Jin, Z., & Ruan, S. (2012). Dynamics of rabies epidemics and the impact of control efforts in Guangdong Province, China. Journal of theoretical biology, 300, 39-47.
[8] Jemberu, W. T., Molla, W., Almaw, G., & Alemu, S. (2013). Incidence of rabies in humans and domestic animals and people's awareness in North Gondar Zone, Ethiopia. PLoS neglected tropical diseases, 7(5), e2216.
[9] Khan, S. (2012). Rabies molecular virology, diagnosis, prevention and treatment. Available oline at http://www.biomedcentral.com/content/pdf/1743-422X-9-50.pdf. Retrieved 13 April 2015.
[10] Lembo, T., Niezgoda, M., Velasco-Villa, A., Cleaveland, S., Ernest, E., & Rupprecht, C. E. (2006). Evaluation of a direct, rapid immunohistochemical test for rabies diagnosis. Emerging infectious diseases, 12(2), 310-313.
[11] Lloyd, A. L., & Valeika, S. (2007). Network models in epidemiology: an overview. Complex population
dynamics: nonlinear modeling in ecology, epidemiology and genetics. Available online at
http://infoserve. sandia.gov/sand_doc/2008/086044.pdf. Retrieved 13 April 2015
[12] Mengistu, F., Hussen, K., Ali, A., Getahun, G., & Sifer, D. (2011). Dog bite as a publichealth concern in Addis Ababa. Ethiopian Journal of Health Development, 25(1), 58-60.
[13] Pankhurst, R. (1970). The history and traditional treatment of rabies in Ethiopia. Medical history, 14(04), 378-389.
[14] Petros A., Yalemtsehay M., Gashew G. (2014). Rabies and its Folk Drugs Remedies in Ethiopia: A Review.
European Journal of Biological Sciences 6 (4): 104-109.
[15] Reta, T., Teshale, S., Deresa, A., Ali, A., Mengistu, F., Sifer, D., & Freuling, C. (2014). Rabies in animals and humans in and around Addis Ababa, the capital city of Ethiopia: A retrospective and questionnaire based study. Journal of Veterinary Medicine and Animal Health, 6(6), 178-186.
[16] Van den Driessche, P., & Watmough, J. (2002). Reproduction numbers and sub-threshold endemic equilibria for compartmental models of disease transmission. Mathematical biosciences, 180(1), 29-48. [18] WHO. (2013). WHO Expert Consultation on Rabies. Second report. World Health Organization technical
report series(982), 1.
TESFAYE TADESSE EGA, NELSON MANDELA AFRICAN INSTITUTION OF SCIENCE AND TECHNOLOGY, P.O. BOX
447, ARUSHA, TANZANIA
LIVINGSTONE S. LUBOOBI, NELSON MANDELA AFRICAN INSTITUTION OF SCIENCE AND TECHNOLOGY, P.O. BOX 447,
ARUSHA, TANZANIA
MAKERERE UNIVERSITY, P.O. BOX 7062, KAMPALA, UGANDA
DMITRY KUZNETSOV, NELSON MANDELA AFRICAN INSTITUTION OF SCIENCE AND TECHNOLOGY, P.O. BOX 447, ARUSHA, TANZANIA