277
© 2018 by the Serbian Biological Society How to cite this article: Mostafa DG, Khaleel EF, Abdel-Aleem GA. Inhibition of the hepatic glucose output is responsible for the hypoglycemic effect of Crataegus aronia against type 2 diabetes mellitus in rats. Arch Biol Sci. 2018;70(2):277-87.
Inhibition of the hepatic glucose output is responsible for the hypoglycemic effect of
Crataegus aronia
against type 2 diabetes mellitus in rats
Dalia G. Mostafa1,4,*, Eman F. Khaleel2,4 and Ghada A. Abdel-Aleem3,5
1Department of Medical Physiology, Faculty of Medicine, Assiut University, Assiut, Egypt 2Department of Medical Physiology, Faculty of Medicine, Cairo University, Cairo, Egypt 3Department of Medical Biochemistry, Faculty of Medicine, Tanta University, Tanta, Egypt
4Department of Medical Physiology, College of Medicine, King Khalid University, P.O. Box 3340, Abha 61421, Saudi Arabia 5Department of Medical Biochemistry, College of Medicine, King Khalid University, Abha, Saudi Arabia
*Corresponding author: [email protected]
Received: May 10, 2017; Revised: July 23, 2017; Accepted: September 18, 2017; Published online: November 13, 2017
Abstract: This study aimed to analyze the ameliorative effect of Crataegus aronia against type 2 diabetes mellitus (type
2-DM). Type 2-DM rats were treated with the extract and the changes in serum parameters (glucose, insulin, HbA1c and
lipids) and hepatic parameters (oxidative stress, inflammation and mRNA levels of GLUT-2 and gluconeogenesis enzymes) were compared to those of control and untreated type 2-DM rats. Also, levels of hepatic insulin receptors 1A (IR-1A) were
measured immunohistochemically and compared between groups. In type 2-DM rats, C. aronia significantly improved
the oral glucose tolerance test (OGTT), lowered plasma glucose, serum lipid levels and the hepatic glycogen content. Also, it significantly lowered the levels of hepatic lipid peroxidation, tumor necrosis factor alpha (TNFα) and interleukin-6
(IL-6) and enhanced the level of reduced glutathione (GSH) and increased superoxide dismutase (SOD) activity. C. aronia
enhanced hepatic mRNA expression of the insulin receptor A isoform (IR-A) and glucose 6-phosphatase (G6Pase), and
lowered glucose transporter-2 (GLUT-2) and glycerol kinase (GK) mRNA expression. In conclusion, C. aronia ameliorates
T2DM by inhibiting hepatic glucose output.
Key words: C. aronia; insulin receptor; liver; GLUT-2; type 2 diabetes mellitus
INTRODUCTION
Noninsulin-dependent diabetes mellitus (NIDDM or type 2-DM) is the most common form of diabetes mellitus and accounts for more than 90% of diabetes patients [1]. Current understanding of type 2-DM progression indicates that insulin resistance in periph-eral tissues results in compensatory hyperinsuline-mia, followed by β-cell failure, which initially leads to prandial and later to overt fasting hyperglycemia [1,2].
The liver is the main organ regulating glucose out-put through two main mechanisms, glycogenolysis and gluconeogenesis. These different processes are regu-lated via different mechanisms in response to plasma glucagon, nonesterified fatty acids (NEFAs), insulin [3] and neural input [4]. Circulatory NEFAs, glucagon, and catecholamines stimulate hepatic glucose synthesis
and secretion, whereas circulatory insulin suppresses this process via stimulation of several intracellular pro-tein substrates [5]. At present, there is still a debate as to whether muscle or hepatic insulin resistance is the key player in the progression of type 2-DM.
muscle insulin resistance [7]. Also, mice completely deficient in skeletal muscle insulin receptors (IR) do not develop diabetes [8], and individuals with inactive muscle glycogen synthase are not necessarily hyper-glycemic [9].
Various triggers produce hepatic insulin resist-ance, and the associated hyperglycemia in patients or animals with type 2-DM is due to interference with insulin receptor expression or signaling. Accumulat-ing evidence suggests that high levels of reactive oxy-gen species (ROS) [10-12], inflammation [13,14] and hepatic steatosis trigger type 2-DM-associated insulin resistance [15].
In this regard and based on the role of hepatic insulin resistance in the development of the hyperg-lycemic state, an ideal therapeutic agent should have hypoglycemic, hypolipidemic and antioxidant po-tentials. The currently available oral synthetic agents against type 2-DM-induced hyperglycemia have sev-eral serious side effects and are expensive, especially for patients in developing countries [16]. Therefore, the search for effective, low-cost hypoglycemic agents of plant origin with fewer side effects is promising and is recommended by many authors [17].
Crataegus aronia, which is a dominant species in the mountains of the Mediterranean basin, has been extensively used in traditional Arab medicine to treat various conditions, including cardiovascular disease, cancer, hyperlipidemia and diabetes [18]. Recently,
C. aronia has been shown to have anti-obesity and hypoglycemic effects in animals via inhibition of pan-creatic lipase activity [19]. However, in spite of the well-known effect of C. aronia in traditional medicine in decreasing blood glucose levels and reducing the as-sociated macro- and microvascular complications, no strong scientific evidence is available in the literature. Hence, in this study, we investigated the ability of C. aronia to reverse some clinical complications linked with type 2-DM, such as hyperglycemia, hyperlipi-demia and insulin resistance, and examined some of the mechanisms of its action by targeting the modula-tors of hepatic insulin signaling and gluconeogenesis.
MATERIALS AND METHODS
Plant material and extraction
This procedure was done in accordance with our pre-vious work [20]. In brief, fresh hawthorn (C. aronia)
whole plants (stems, leaves and flowers) were purchased from a local market. The plant was identified, dried and extracted in the Department of Pharmacology, Col-lege of Pharmacy, King Khalid University. The dried plant material was ground to a powder and extracted by maceration using distilled water (1 kg/L, w/v) for 3 days at 37°C. The aqueous extract was then filtered and evaporated and the dried residue (32 g) produced was then stored at 4°C. At the time of use, the residue was reconstituted in distilled water and filtered through 0.2-µm filters to the desired concentration.
Animals
Adult healthy male Wistar rats (240±10 g, 9 weeks old) were included in the study and were supplied, main-tained and treated in the animal house of the College of Medicine, King Khalid University, Abha, KSA. The rats were fed standard rat pellets and allowed free ac-cess to water before the experiment. Before and during the experimental procedures, the rats were housed in a controlled ambient temperature of 25±2°C and 50±10% relative humidity, with a 12-h light/dark cy-cle. All procedures used in this study were performed with the approval of the Research Ethics Committee (REC) at the College of Medicine, King Khalid Uni-versity, Abha, Saudi Arabia, which are in accordance with the Guide for the Care and Use of Laboratory Animals published by the US National Institutes of Health (NIH Publication No. 85-23, revised 1996).
DEvELOPMENT Of TyPE 2-DM RATS
previ-ously described by Srinivasan et al. [22] (Supplemen-tary Table S1). To induce type 2-DM, rats were fasted overnight at the end of day 14 when they were injected a single low i.p. dose of streptozotocin (35 mg/kg, STZ in citrate buffer, pH 4). All rats continued feeding on their initial diets for another 7 days. On day 21, the animals fasted overnight and their blood glucose was measured. Rats with blood glucose higher than 300 mg/dL were considered diabetic and were included in the experimental design. All rats were returned to the standard diet once the experimental procedure was started.
Experimental design
Once type 2-DM was established in rats, the experi-mental animals were divided into three groups (n=6, each) and treated as follows: Group 1 was the control nondiabetic group that was administered 0.5 mL dis-tilled water orally for 60 days. Group 2 was the type 2-DM group that was administered 0.5 ml distilled water orally for 60 days. Group 3 was the type 2-DM group of rats that were treated with an oral dose of C. aronia aqueous extract (500 mg/kg bw) in a final vol-ume of 0.5 mL of distilled water for 60 days. The dos-age was adjusted every week according to any change in body weight (bw) to maintain a similar dose/kg bw of the rat over the entire period of study. Food intake was also monitored weekly. At the end of the experiment, the animals were euthanized with sodium pentobarbital (75 mg/kg, i.p.) and blood samples and liver tissues were obtained.
Biochemical study
On the day before euthanization, all animals were weighed and an oral glucose tolerance test (OGTT) was performed. Blood samples were obtained from the lateral tail vein of rats deprived of food overnight (10-12 h). Successive blood samples were taken at 0, 30, 60, 90 and 120 min intervals following the admin-istration of glucose solution (3 g/kg bw) through gas-tric intubation. Plasma glucose and insulin levels were measured using a special rat glucose colorimetric kit (Cat. No. 10009582, Caymen, Fl, USA) and an insulin ELISA kit (Cat No. 10-1250-01, Mercodia, Uppsala, Sweden) according to the manufacturer’s instructions.
Blood chemistry
From each rat, 1 mL of blood was collected in a heparinized (20 µL, 200 IU/ml) Eppendorf tube. The serum was prepared by centrifuging at 5000 rpm for 10 min and used to determine levels of serum total cholesterol (TC), triglycerides (TGs) and HDL cho-lesterol (HDL-c) using special commercially avail-able kits according to the manufacturer’s instructions. Serum LDL-cholesterol (LDL-c) level was calculated according to Friedewald’s formula [23]: (LDL-c=TC-TGs/5-HDL-c), and the serum VLDL cholesterol (VLDL-c) concentration was calculated according to Nobert formula [24]: (VLDL-c=TGs/5). Blood glyco-sylated hemoglobin (HbAC1) was determined in the heparinized blood samples by the Helena GLYCO-Tek affinity column method (Helena Laboratories, USA). Tissue collection
Livers were rapidly excised, washed carefully with ice-cold phosphate buffer saline (PBS; pH 7.4) and then stored at -80°C for further biochemical and molecu-lar analysis. Both left and right epididymal fat pads were excised, trimmed and weighed for assessment of adiposity.
Measurement of the liver glycogen content
Liver glycogen was determined using the method de-scribed by Lo et al. [25]. Briefly, samples were homog-enized in potassium hydroxide (KOH) solution and incubated in boiling water for 30 min. After addition of 90% ethanol, the samples were incubated overnight at 4°C, followed by centrifugation at 1000 g for 30 min at 4°C. Absorbance was measured at 490 nm. Bovine liver glycogen (Sigma Chemical Co., St. Louis, MO, USA) was used as a standard.
Oxidative stress assays
were carried out as per the manufacturer’s instructions. Levels of total reduced glutathione (GSH) were deter-mined manually according to the method of Jollow et al. [26] with slight modification. In brief, the liver ho-mogenate was mixed with 4% sulfosalicylic acid (w/v) at a 1:1 ratio (v/v). The samples were incubated at 4°C for 1 h and centrifuged at 1200 × g for 15 min at 4°C. The assay mixture contained 0.1 mL of supernatant, 1.0 mM DTNB and 0.1M PB (pH 7.4) in a total volume of 1 mL. The yellow color that developed was measured im-mediately at 412 nm in a spectrophotometer. The GSH content was calculated as nmol GSH/mg of protein.
RNA extraction and RT-PCR
The procedure was optimized for semiquantitative de-tection using primer pairs and conditions described in Supplementary Table S2 and previously used by Farsi et al. [27]. Total RNA was extracted from frozen liver parts (30 mg) using an RNeasy Mini Kit (Qiagen Pty. Ltd., Victoria, Australia) according to manufacturer’s instructions. The purity of the extracted RNA was es-timated by the 260/280nm absorbance ratio. Single-strand cDNA synthesis was performed as follows: 30 µL of reverse transcription mixture contained 1 µg of DNase I pretreated total RNA, 0.75 µg of oligo d(T) primer, 6 µL of 5x RT buffer, 10 mM dithiothreitol, 0.5 mM deoxynucleotides, 50 U of RNase inhibitor and 240 U of reverse transcriptase (Invitrogen). The RT re-action was carried out at 40oC for 70 min, followed by
heat inactivation at 95oC for 3 min. The tested genes
and the internal control (β-actin) were amplified by PCR using 2 µL RT products from each sample in a 20-µL reaction containing Taq polymerase (0.01 U/ mL), dNTPs (100 mM), MgCl2 (1.5 mM) and buffer (50 mM Tris-HCl). PCR reactions comprised a first denaturing cycle at 97oC for 5 min, followed by a
vari-able number of cycles of amplification, consisting of denaturation at 96oC for 30 s, annealing for 30 s and
extension at 72oC for 1 min. A final extension cycle of
72oC for 15 min was included. The annealing
tempera-ture was adjusted for each target as shown in Table S2. A control reaction without reverse transcriptase was included for every sample of RNA isolated to verify the absence of contamination. PCR products (10 µL) were separated by electrophoresis on 2% agarose gels containing 100 ng/mL of ethidium bromide and pho-tographed under ultraviolet illumination. Image J was
used to analyze the percentages of expression of each mRNA against its corresponding β-actin mRNA.
Immunohistochemistry procedure
Histological sections of livers (5 µm) were cut from paraffin blocks with a rotary microtome. Immunohis-tochemistry was performed to localize GLUT-2 recep-tors by the avidin-biotin complex (ABC) technique. In brief, all sections were deparaffinized and rehydrated in a descending ethanol series, followed by immersion in a retrieval solution and washing (DAKO 51700, DAKO Diagnostics S.A., Barcelona. Spain). Inhibition of endogenous peroxidase activity was achieved with 3% H2O2 in absolute methanol for 30 min and then washing. Then sections were blocked by incubating with normal goat serum (DAKO X 909, DAKO Diag-nostics S.A., Barcelona, Spain) with PBS diluted 1:4, followed by incubation with rabbit polyclonal anti-body against GLUT-2 receptor protein, diluted 1:400 for 2 h at room temperature. Slides were washed with PBS and incubated with biotinylated goat anti-rabbit IgG (ab64256, Abcam, USA), washed and incubated with ABC complex (DAKO LSAB 2Kit, DAKO Di-agnostics S.A). After successive washings, peroxidase was detected using 3’,3’diaminobenzidine tetrahydro-chloride as a chromogen (DAB). Hematoxylin was used as a counterstainand PBS was used instead of the monoclonal antibody as a negative control.
Statistical analysis
Statistical analysis was performed using the Graph-Pad Prism statistical software package (ver. 6). The data are presented as means with standard deviation (mean±SD). All comparisons were analyzed by one-way ANOVA, followed by post hoc Tukey’s t-test and accepted as significant at p<0.05.
RESULTS
Changes in food intake, final body weight and epididymal fat pad weight
exhibited a significant increase in average daily food intake with concomitant increases in both final body and epididymal weights as compared to the control. Significant decreases in the levels of all these param-eters were detected in type 2-DM rats that received the C. aronia aqueous extract for 60 days (Group 3) as compared to diabetic rats (Group 2). However, in spite of these reductions, analysis showed that the levels of these parameters remained significantly higher than their corresponding levels in control rats.
Changes in blood biochemistry and liver glycogen content
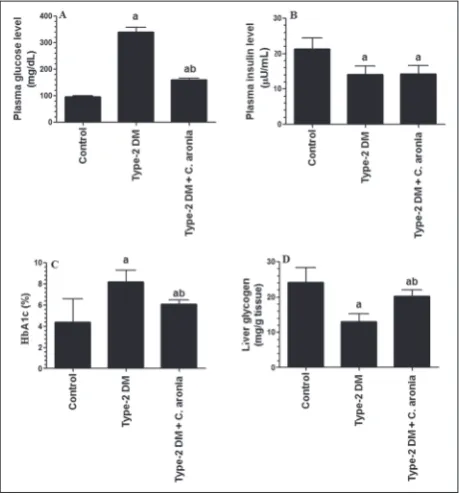
Fig. 1 shows the changes in OGTT in all groups of rats. Fig. 2 shows the changes in fasting plasma glu-cose (FPG) (Fig. 2A) and insulin (FPI) (Fig. 2B), blood percentages of glycosylated Hb (HBA1c%) (Fig. 2C) as
well as liver glycogen content (Fig. 2D) in all experi-mental groups. As compared to the control rats, type 2-DM rats (Group 2) had significantly higher levels of FPG and HbA1c, which coincided with a decrease in both FPI levels and hepatic glycogen contents (Fig. 2). OGTT displayed disturbed glucose disposal and impaired glucose tolerance (Fig. 1). On the other hand, even if it did not affect FPI levels, administra-tion of the C. aronia aqueous extract to diabetic rats (Group 3) significantly lowered FPG, HbA1c% and enhanced the glycogen content when compared to the type 2-DM group (Group 2). Except for HbA1c%, the levels of FPG and hepatic glycogen content remained
Table 1. Changes in food intake, body weight and epididymal fat content in all groups of rats.
epididymal fat pad
weight (g) final body weight (g) initial body weight (g) intake/rat (g)daily food Group
3.78±2.65 288.8±12.3 210.4±9.9 13.4±2.5 Control
7.67±2.35a 343.9±7.8a 206.6±7.6 21.3±3.2a DM2
5.4±1.7ab 302.9±9.8 ab 209.8±5.6 16.7±3.4ab DM2+C. aronia
Values are expressed as the mean±SD for 6 rats in each group for results obtained in triplicate for each sample. Values were considered significantly different at p<0.05. DM-2 – type 2-DM; a indicates significant difference when compared to the control group; b indicates significant difference when
compared to DM-2.
fig. 1. OGTT of all groups of rats. Values are expressed as the
mean±SD for 6 rats in each group in triplicates of 3 for each sam-ple. Values were considered significantly different at P<0.05; a indicates significant difference when compared to a 0 min read-ing; b indicates significant difference when compared to a 15 min reading; c indicates significant difference when compared to a 30 min reading; * indicates significant difference when compared to the same time interval measured in the control group; # indicates significant difference when compared to the same time interval measured in the DM2+C. aronia group.
slightly but significantly higher than their correspond-ing levels in control rats.
Changes in the serum lipid profile
Changes in serum levels of TGs, TC and LDL-c, VLDL-c and HDL-c, in the serum of all groups are shown in Table 2. Significant increases in the levels of TGs, TC, LDL-c and VLDL-c with a parallel decrease in the level of HDL-c were observed in the serum of type 2-DM rats (Group 2) when compared to control rats. As compared to type 2-DM group (Group 2), rats that were administered C. aronia (Group 3) showed significant decreases (but not to normalization), in the levels of TGs, TC, LDL-c and VLDL-c, and a sig-nificant increase in HDL.
RT-PCR and immunohistochemistry
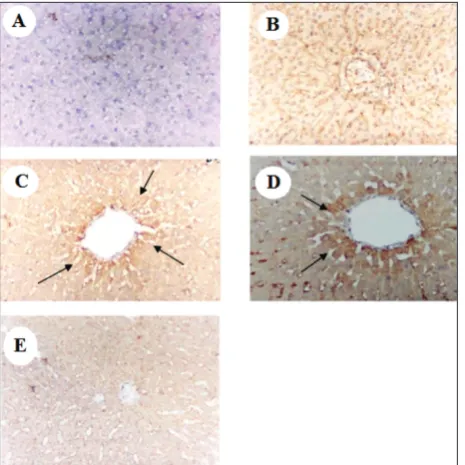
The levels of GK and IR-1A mRNA were significant-ly decreased, and the mRNA levels of G6Pase and GLUT-2 were significantly increased in the livers of type 2-DM rats (Group 2) (Fig. 3). Along with these changes, the immunohistochemical study revealed a significant increase in GLUT-2 expressions in type 2-DM rats (Figure 4 C and D). In contrast, significant decreases in the levels of G6Pase and GLUT-2 mRNAs and significant increases in GK and IR-1A mRNAs (Fig. 3), with a concomitant decrease in GLUT-2 im-munoreactivity (Fig. 4E), were detected in the livers of type 2-DM rats that were treated with the C. aronia
aqueous extract (Group 3) as compared to diabetic rats (Group 2).
Oxidative stress and inflammation
The concentration of GSH and the specific activity of total SOD were significantly decreased, while levels
of TNFα, interleukin-6 (IL-6) and TBARS were sig-nificantly increased in the liver homogenates of type 2-DM rats (Group 2) when compared to control rats (Fig. 5). Even though not fully normalized, the admin-istration of C. aronia to type 2-DM rats for 60 days (Group 3) significantly improved the concentration
Table 2. Levels of triglycerides (TGs), total cholesterol (TC), very low-density low lipoproteins cholesterol (VLDL-c), low-density
lipo-proteins cholesterol (LDL-c) and high-density lipoprotein cholesterol (HDL-c) in the sera of all groups of rats.
HDL-C (mg/dL) LDL-c (mg/dL) vLDL-c (mg/dL) TC (mg/dL) TGs (mg/dL) Group
19.3±2.1 34.17±3.5 12.3±1.7 65.0±10.6 79.2±7.5 Control
13.0±1.96a 104.7±8.2 a 32.8±4.5 a 147.8±9.6a 182.2±16.6a DM-2
16.17±2.4 ab 55.6±5.5ab 18.4±1.7ab 96.3±9.9ab 112.5±13.2ab DM2+C. aronia
Values are expressed as mean±SD for 6 rats in each group. Values are expressed as mean±SD for 6 rats in each group in triplicates of 3 for each sample. Values were considered significantly different at p<0.05. DM-2 – type 2-DM; a indicates significant difference when compared to the control group; b indicates significant difference when compared to DM-2.
fig. 3. Levels of mRNA expression for GK (A), G6Pase (B),
of GSH and SOD activity, and significantly inhibited the increases in the levels of TBARS, TNFα and IL-6 in the livers of these rats (Fig. 5).
DISCUSSION
The exact site of the insulin resistance that leads to decreased glucose disposal remains a matter of debate. Although insulin resistance appears to be the greatest in skeletal muscle in both animals and humans during very early phases of type 2-DM, [6,28], several studies have indicated the role of hepatic insulin resistance as a determining factor for fasting blood glucose (FBG) concentrations in all phases of type 2-DM. This is sup-ported by normal whole-body glucose homeostasis in the muscle of rats deficient in IR [8]. Further studies have reported similar results, and the overall conclu-sion was that increased hepatic glucose production (HGP) is strongly correlated with fasting hyperglyc-emia in type 2-DM patients [28]. Hence, targeting he-patic insulin resistance rather than insulin resistance in skeletal muscles may be much more important in lowering FBG levels.
Hence, in this study we sought to investigate the effect of the aqueous extract of C. aronia on the rat model of type 2-DM induced by a high fat diet com-bined with the administration of a low dose of STZ, with emphasis on HGP and uptake. We also examined the major mechanisms responsible for hepatic insulin resistance, including lipid accumulation, aspects of the oxidative stress and some inflammatory markers. One finding of this study is that type 2-DM rats (Group 2) exhibited hepatic IR-1A deficiency associated with an enhanced rate of gluconeogenesis, inhibition of glycogen synthesis, enhanced levels of HbA1C and overexpression of GLUT-2 mRNA and protein levels.
fig. 4. Immunoreactivity of GLUT-2 receptors in cells of the liver
of all groups of rats. A – negative control; B – control non-diabetic rats; C, D – type 2-DM. E – type 2-DM+C. aronia. Counterstain-ing was with hematoxylin; magnification: 200X. Brown coloration (arrows) indicate a positive reaction.
fig. 5. Activity of SOD (A), the concentrations of TBARS (B),
In addition, the livers of these rats displayed a lower endogenous antioxidant status and enhanced levels of inflammatory cytokines, paralleled by increases in serum levels of TGs, TC and LDL-c. Also, the admin-istration of the C. aronia extract to type 2-DM rats for 60 days (Group 3) significantly reversed all of the abovementioned changes via a mechanism that is ap-parently mediated by the antioxidant and antiinflam-matory potentials of this plant.
Type 2-DM rats displayed enhanced polyphagia and increased body weight. Coexistent with these signs were the high levels of plasma fasting blood glu-cose and HbA1C. The plasma levels of insulin signifi-cantly decreased with impaired OGTT. Interestingly, liver glycogen levels were significantly decreased. Hence, we investigated the role of the hepatic insulin resistance by investigating aspects of hepatic insulin metabolism.
Once insulin binds to its receptor, it initiates a cascade of events that eventually suppresses hepatic glucose output [5]. In this process, insulin mediates the phosphorylation activation of PI3K/Akt, which in turns mediates the phosphorylation inhibition of gly-cogen synthase (GS) [29], the key enzymes in glycog-enolysis. In addition, the phosphorylated PI3K/Akt phosphorylates forkhead box protein O1 (FOXO1) in turns mediates the inhibition of phosphoenolpyruvate carboxykinase (PEPCK) and G6Pase, the key regula-tory enzymes of gluconeogenesis [29]. On the other hand, hepatic GLUT-2 is expressed in response to high circulatory or hepatic glucose levels [30]. Hence, insu-lin has a negative impact on hepatic GLUT-2 expres-sion in mice [31].
The work presented here revisits the role of the IR expression in the pathology of type 2-DM (Group 2) and suggests that abundant expression of liver IR-1A has an important role in insulin-mediated metabolic signaling and hepatic insulin resistance. In the current study, type 2-DM rats had decreased IR-1A mRNA, in-creased G6Pase mRNA and dein-creased GK mRNA lev-els and concentrations of hepatic glycogen. These data, in addition to the enhanced levels of plasma fasting glucose, could explain the increases in hepatic mRNA and protein levels of GLUT-2 in type 2-DM rats. Tak-en together, these data suggest that impaired insulin hepatic signaling due to downregulation of IR-1A
expression or decreased plasma insulin levels plays an important role in the pathology of type 2-DM.
In this study, we are the first to confirm that the antidiabetic potential of C. aronia against type 2-DM in rats (Group 3) is mediated by decreased fat accu-mulation, enhanced hepatic insulin signaling and de-creased hepatic glucose output. This is evident from the lower levels of FPG and HbA1C, the higher glyco-gen content, enhanced GK mRNA and lower G6Pase mRNA levels in the livers of type 2-DM rats treated with C. aronia. Interestingly, C. aronia did not affect the circulatory insulin levels but significantly en-hanced hepatic the level of IR-1A mRNA and down-regulated the mRNA and protein levels of GLUT-2. Such increases in the expression of IR-1A could be the key mechanism by which C. aronia enhances insulin signaling in the liver of diabetic rats, instead of af-fecting the plasma insulin levels. The decrease in the concentration of plasma glucose and the inhibition of hepatic gluconeogenesis in the liver of diabetic rats explains the mechanisms by which C. aronia medi-ates the decreases in mRNA levels and expression of GLUT-2 in the livers of these diabetic rats. However, in spite of these observations, the definite effect of C. aronia on protein abundance and phosphorylation of insulin signaling mediators remains to be investigated.
It is accepted that ROS, inflammatory cytokines and hepatic steatosis are the major risk factors in the genesis of type-2 DM. Different mechanisms have been suggested to explain the roles of these altera-tions in inducing hepatic insulin resistance [11-15]. Indeed, most type 2-DM patients have fatty liver and hepatic insulin resistance [32-34]. Also, the hepatic levels of NF-κB and IL-6 were reported to be increased in the livers of diet- and genetically-induced type 2-DM rats with or without steatosis [13,14]. In addi-tion, animals with very high levels of hepatic ROS had impaired insulin signaling and exhibited both hepatic and systemic insulin resistance [10,11]. Furthermore, disturbed mitochondrial function with increased ROS levels were reported in type 2-DM patients with fatty liver [35-39]. Moreover, palmitate-induced hepatic insulin resistance was dependent on the generation of mitochondrial ROS [12].
antioxidant potential (decreased SOD activity and GSH concentration), and enhanced lipid peroxida-tion as a marker of high levels of oxidative stress. In addition, the increased levels of IL-6 and TNFα de-tected in the liver homogenates of type 2-DM rats and their serum displayed prominent increases in the levels of TGs, CHOL and LDL-c. Administration of
C. aronia to type 2-DM rats (Group 3) significantly reduced the levels of IL-6 and TNFα and significantly enhanced the activity of SOD and the concentration of GSH, leading to significant inhibition of hepatic lipid peroxidation. Also, C. aronia application significantly normalized serum lipids. Thus, it would appear that the antioxidant, antiinflammatory and hypolipidemic effects of C. aronia improve hepatic insulin signaling.
The chemical composition of the leaves and flow-ers of C. aronia have been identified previously by oth-er authors [40,41]. The major ingredients include phe-nolics such as oligomeric proanthocyanidin, flavonoids (vitexine-2-O-rhamnoside, VOR) and polyphenols, such as chlorogenic acid, hyperoside and quercetin. Interestingly, proanthocyanidin and VOR have been shown to have a potent antioxidant potential against superoxide- and hydrogen peroxide-induced oxida-tive damage and can be safely used at a wide range of concentrations [42-46]. In addition, some authors have also shown that theflavonoidVOR has a potent hy-polipidemic effect and is capable of treating fatty liver diseases [47]. Furthermore,isovitexin is a well-known antiinflammatory agent [48] with potent antidiabetic activity in a murine model of type 2 diabetes [49].
Recent evidence has highlighted the important role of chlorogenic acid as an antioxidant and of polyphenols in lowering glucose and lipid levels in different animal disease models [50]. Importantly, quercetin and its derivatives exert antidiabetic effects by acting through various mechanisms, including in-hibition of intestinal starch digestion and hepatic glu-cose production by enhancing hepatic gluglu-cose kinase activity, improving skeletal muscle uptake of glucose and by protecting against pancreatic islet damage [51-56]. It also has a potent hypolipidemic effect and is capable of ameliorating the resultant insulin resist-ance in STZ-induced diabetic animal models [51,53]. Furthermore, quercetin has potent antioxidant and antiinflammatory actions in various tissues of diabetic animals [53,55].
Given all this information, we could speculate that the amelioration of oxidative stress and the antidiabet-ic mechanisms reported in this study are essentially related to the concomitant and synergistic effects of all these ingredients. However, there are some limitations in this study. Even though C. aronia enhanced the expression levels of IR-1, inhibited gluconeogenesis and activated glycogen synthesis, the effect of the ex-tract on cellular insulin signaling cannot be confirmed by the available data. Further studies measuring the phosphorylation status and abundance of proteins involved in insulin signaling should be carried out to confirm the exact mechanisms by which HFD and C. aronia act. In addition, such studies should be done in other animal models and sexes in order to confirm the endpoints.
The novel findings of the current study are unique in confirming the role of hepatic insulin resistance associated with decreased IR expression as the major factor in the etiology of type 2-DM. Our results are the first to show a possible mechanistic effect of C. aronia
in lowering blood glucose in rats with type 2-DM.
Acknowledgments: The authors would like to express their
grati-tude to King Khalid University (KKU), Saudi Arabia for providing administrative and technical support. They also wish to thank the technical staff of the animal house facilities at the College of Medi-cine at KKU for their help in the management, care and feeding of the animals used in this study. In addition, the authors wish to thank the technical staff at the Department of Biochemistry, Col-lege of Medicine, and the staff at the Department of Pharmacology at the College of Pharmacy in KKU for their help in some of the biochemical measurements in this study.
funding: This research did not receive any specific grant from
funding agencies in the public, commercial, or not-for-profit sec-tors.
Author contributions: DGM, EFK and GAA contributed equally
to the current study. Both authors designed the experimental pro-cedure and performed all statistical analyses as well as participated in writing the manuscript. EFK and GAA produced the animal model and performed all the treatments of rats, measured the biochemical parameters and performed the RT-PCR procedure and analysis. DGM helped in tissue and blood sampling, measure-ments and analysis of the biochemical parameters and performed the immunohistochemistry study.
Conflict of interest disclosure: The author declares that there
REfERENCES
1. Moller DE. Transgenic approaches to the pathogenesis of NIDDM. Diabetes. 1994;43:1394-401.
2. Taylor SI, Accili D, Imai Y. Insulin resistance or insulin defi-ciency: which is the primary cause of NIDDM? Diabetes. 1994;43:735-40.
3. Lin HV, Accili D. Hormonal regulation of hepatic glucose production in health and disease. Cell Metab. 2011;14:9-19. 4. Dufour S, Lebon V, Shulman GI, Petersen KF. Regula-tion of net hepatic glycogenolysis and gluconeogenesis by epinephrine in humans. Am J Physiol Endocrinol Metab. 2009;297:E231-E235.
5. Ader M, Bergman RN. Peripheral effects of insulin domi-nate suppression of fasting hepatic glucose production. Am J Physiol. 1990;258:E1020-E1032.
6. Lillioja S, Mott DM, Spraul M, Ferraro R, Foley JE, Ravus-sin E, Knowler WC, Bennett PH, Bogardus C. Insulin resis-tance and insulin secretory dysfunction as precursors of non insulin-dependent diabetes mellitus. Prospective studies of Pima Indians. N Engl J Med. 1993;329:1988-92.
7. Petersen KF, Dufour S, Befroy D, Lehrke M, Hendler RE, Shulman GI. Reversal of nonalcoholic hepatic steatosis, hepatic insulin resistance, and hyperglycemia by moderate weight reduction in patients with type 2 diabetes. Diabetes. 2005;54:603-8.
8. Brüning JC, Michael MD, Winnay JN. A muscle-specific insulin receptor knockout exhibits features of the metabolic syndrome of NIDDM without altering glucose tolerance. Mol Cell. 1998;2:559-69.
9. Savage DB, Zhai L, Ravikumar B. A prevalent variant in PPP1R3A impairs glycogen synthesis and reduces mus-cle glycogen content in humans and mice. PLoS Med. 2008;5:e27.
10. Houstis N, Rosen ED, Lander ES. Reactive oxygen species have a causal role in multiple forms of insulin resistance. Nature. 2006;440(7086):944-8.
11. Anderson EJ, Lustig ME, Boyle KE. Mitochondrial H2O2 emission and cellular redox state link excess fat intake to insulin resistance in both rodents and humans. J Clin Invest. 2009;119(3):573-81.
12. Nakamura S, Takamura T, Matsuzawa-Nagata N. Palmitate induces insulin resistance in H4IIEC3 hepatocytes through reactive oxygen species produced by mitochondria. J Biol Chem. 2009;284(22):14809-18.
13. Samuel VT, Liu ZX, Qu X, Elder BD, Bilz S, Befroy D, Romanelli AJ, Shulman GI. Mechanism of hepatic insulin resistance in non-alcoholic fatty liver disease. J Biol Chem. 2004;279:32345-53. [PubMed: 15166226]
14. Cai D, Yuan M, Frantz DF, Melendez PA, Hansen L, Lee J. Local and systemic insulin resistance resulting from hepatic activation of IKK-beta and NF-kappaB. Nat Med. 2005;11:183-90.
15. Seppala-Lindroos A, Vehkavaara S, Hakkinen AM, Goto T, Westerbacka J, Sovijarvi A, Halavaara J, Yki-Jarvinen H. Fat accumulation in the liver is associated with defects in insulin suppression of glucose production and serum free fatty acids independent of obesity in normal men. J Clin Endocrinol Metab. 2002;87:3023-8.
16. Rubin RJ, Altman WM, Mendelson DN. Health care expen-ditures for people with diabetes mellitus. J Clin Endocrino Metab. 1992;78:809A-809F.
17. Day C. Traditional plant treatments for diabetes mellitus: pharmaceutical foods. Br J Nutr. 1998;80:5-6.
18. Ali-Shtayeh MS, Yaniv Z, Mahajna J. Ethnobotanical survey in the Palestinian area: a classification of the healing potential of medicinal plants. J Ethnopharmacol. 2000;73(1-2):221-32. 19. Al-Hallaq EK, Kasabri V, Abdalla SS, Bustanji YK, Afifi FU.
Anti-obesity and antihyperglycemic effects of Crataegus aro-nia Extracts: In vitro and in vivo evaluations. Food Nutr Sci. 2013;4:972-83.
20. Shatoor AS, Said Ahmed MAA. Cardioprotective effect of Crataegus aronia syn. Azarolus (L) Aqueous Extract Against Doxorubicin-Induced Cardiotoxicity and Heart Failure in Wistar Rats. J Basic Appl Sci Res. 2014;4(2):102-14. 21. Mansor LS, Gonzalez ER, Cole MA, Tyler DJ, Beeson JH,
Clarke K, Carr CA, Heather LC. Cardiac metabolism in a new rat model of type 2 diabetes using high-fat diet with low dose streptozotocin. Cardiovasc Diabetol. 2013;12:136. 22. Srinivasan K, Viswanad B, Asrat L, Kaul CL, Ramarao P.
Combination of high-fat diet-fed and low-dose streptozoto-cin-treated rat: a model for type 2 diabetes and pharmaco-logical screening. Pharmacol Res. 2005;52(4):313-20. 23. Friedewald WT. Estimation of concentration of low-density
lipoprotein cholesterol in plasma without use of the prepara-tive ultracentrifuge. Clin Chem. 1972;18(7):499-502. 24. Nobert WT. Clinical guide to laboratory tests. 3rd ed.
Phila-delphia, PA: W.B. Saunders Co; 1995.
25. Lo S, Russell JC, Taylor AW. Determination of glycogen in small tissue samples. J Appl Physiol. 1970;28:234-6. 26. Jollow DJ, Mitchell JR, Zampaglione N, Gillette JR.
Bromo-benzene-induced liver necrosis: Protective role of glutathi-one and evidence for 3, 4‐bromobenzene oxide as the hepa-totoxic metabolite. Pharmacology. 1974;11:151‐69. 27. Farsi E, Ahmad M, Hor SY, Ahamed MPK, Yam MF, Asmawi
MZ. Standardized extract of Ficus deltoidea stimulates insulin secretion and blocks hepatic glucose production by regulating the expression of glucose-metabolic genes in streptozotocin-induced diabetic rats. BMC Complement Altern Med. 2014;14:220.
28. DeFronzo RA. Pathogenesis of type 2 diabetes: metabolic metaband molecular implications for identifying diabetes genes. Diabetes Rev. 1997;5:177-269.
29. Saltiel AR, Kahn CR. Insulin signalling and the regulation of glucose and lipid metabolism Nature. 2001;414(13):799:806. 30. Leturque A, Brot-Laroche E, Le Gall M. GLUT2 mutations,
translocation, and receptor function in diet sugar managing. Am J Physiol Endocrinol Metab. 2009;296:E985-E992. 31. Burkhardt BR, Parker MJ, Zhang YC, Song S, Wasserfall CH,
Atkinson MA. Glucose transporter-2 (GLUT2) promoter mediated transgenic insulin production reduces hyperglyce-mia in diabetic mice. FEBS Lett. 2005; 24;579(25):5759-64. 32. Shulman GI. Cellular mechanisms of insulin resistance. J
Clin Invest. 2000;106:171-6.
34. Fabbrini E, Sullivan S, Klein S. Obesity and nonalcoholic fatty liver disease: biochemical, metabolic, and clinical impli-cations. Hepatology. 2010;51:679-89.
35. Caldwell SH, Swerdlow RH, Khan EM. Mitochondrial abnormalities in non-alcoholic steatohepatitis. J Hepatol. 1999;31(3):430-4.
36. Cortez-Pinto H, Chatham J, Chacko VP, Arnold C, Rashid A, Diehl AM. Alterations in liver ATP homeostasis in human nonalcoholic steatohepatitis: a pilot study. JAMA. 1999;282(17):1659-64.
37. Hensley K, Robinson KA, Gabbita SP, Salsman S, Floyd RA. Reactive oxygen species, cell signaling, and cell injury. Free Radic Biol Med. 2000;28(10):1456-62.
38. Perez-Carreras M, del Hoyo P, Martın MA. Defective hepatic mitochondrial respiratory chain in patients with nonalco-holic steatohepatitis. Hepatology. 2003;38(4):999-1007. 39. Seki S, Kitada T, Yamada T, Sakaguchi H, Nakatani K,
Wakasa K. In situ detection of lipid peroxidation and oxi-dative DNA damage in non-alcoholic fatty liver diseases. J Hepatol. 2002;37(1):56-62.
40. Kumar D, Arya V, Bhat ZA, Khan NA, Prasad DN. The genus Crataegus: chemical and pharmacological perspec-tives. Rev Bras Farmacogn. 2012;22(5):1187-200.
41. Bahri-Sahloul R, Ammar S, Fredj RB, Saguem S, Gree S, Trotin F, Skhiri FH. Polyphenol contents and antioxidant activities of extracts from flowers of two Crataegus azarolus L. varieties. Pakistan J Biol Sci. 2009;12:660-8.
42. Petkov V. Plants and hypotensive, antiatheromatous and cor-onarodilatating action. Am J Chinese Med. 1979;3:197- 236. 43. Bahorun T, Gressier B, Trotin F, Brunet C, Dine T, Luyckx M, Vasseur J, Cazin M, Cazin JC, Pinkas M. Oxygen species scavenging activity of phenolic extracts from hawthorn fresh plant organs and pharmaceutical preparations. Arzneimit-telforschung Drug Research. 1996;46:1086-9.
44. Rice-evans C. Flavonoids and isoflavones: absorp-tion, metabolism and bioactivity. Free Radic Biol Med. 2004;36:827-8.
45. Orhan I, Ozcelik B, Kartal M, Ozdeveci B, Duman H. HPLC Quantification of vitexine-2-O-rhamnoside and hyperoside in three Crataegus species and their antimicrobial and anti-viral activities. Chromatographia. 2007;66:S153-S157. 46. Wei W, Ying X, Zhang W, Chen Y, Leng A, Jiang C, Liu J.
Effects of vitexin-2”-O-rhamnoside and vitexin-4”-O-glu-coside on growth and oxidative stress-induced cell apoptosis of human adipose-derived stem cells. J Pharm Pharmacol. 2014;66(7):988-97.
47. Chang WT, Dao J, Shao ZH. Hawthorn: potential roles in cardiovascular disease. Am J Chin Med. 2005;33:1-10. 48. Lin CM, Huang ST, Liang YC, Lin MS, Shih CM, Chang
YC, Chen TY, Chen CT. Isovitexin suppresses lipopolysac-charide-mediated inducible nitric oxide synthase through inhibition of NF-kappa B in mouse macrophages. Planta Medica. 2005;71:748-53.
49. Choi JS, Islam MN, Ali MY, Kim EJ, Kim YM, Jung HA. Effects of C-glycosylation on anti-diabetic, anti-Alzheimer’s disease and anti-inflammatory potential of apigenin. Food Chem Toxicol. 2014;64:27-33.
50. Meng S, Cao J, Feng Q, Peng J, Hu Y. Roles of chlorogenic acid on regulating glucose and lipids metabolism: A Review. Evid-Based Complement Altern Med. 2013; 2013:801457. 11. 51. Vessal M, Hemmati M, Vasei M. Antidiabetic effects of quercetin in streptozocin1061 induced diabetic rats. Comp Biochem Physiol C Toxicol Pharmacol. 2003;135C:357-64. 52. Coskun O, Kanter M, Korkmaz A, Oter S. Quercetin, a
fla-vonoid antioxidant, prevents and protects streptozotocin-induced oxidative stress and beta-cell damage in rat pan-creas. Pharmacol Res. 2005;51:117-23.
53. Jeong SM, Kang MJ, Choi HN, Kim JH, Kim JI. Quercetin ameliorates hyperglycemia and dyslipidemia and improves antioxidant status in type 2 diabetic db/db mice. Nutr Res Pract. 2012;6:201-7.
54. Eid HM, Martineau LC, Saleem A, Muhammad A, Vallerand D, Benhaddou-Andaloussi A, Nistor L, Afshar A, Arnason JT, Haddad PS. Stimulation of AMP-activated protein kinase and enhancement of basal glucose uptake in muscle cells by quercetin and quercetin glycosides, active principles of the antidiabetic medicinal plant Vaccinium vitis-idaea. Mol Nutr Food Res. 2010;54:991-1003.
55. Dai X, Ding Y, Zhang Z, Cai X, Li Y. Quercetin and quer-citrin protect against cytokineinduced injuries in RINm5F beta-cells via the mitochondrial pathway and NF-kappaB signaling. Int J Mol Med. 2013;31:265-71.
56. Babu PV, Liu D, Gilbert ER. Recent advances in understand-ing the anti-diabetic actions of dietary flavonoids. J Nutr Biochem. 2013;24(11):1777-89.
Supplementary Data
Supplementary Table S1. Composition of HFD used in the
ex-perimental procedure.
Ingredients g/Kg
Powder normal chow 365
Lard 310
Casein 250
Cholesterol 10
Vitamin and mineral mix 60
dL-Methionine 03
Yeast powder 01
Sodium chloride 01
Supplementary Table S2. RT-PCR primers and annealing
condi-tions.
Annealing
temperature sequence Primer Gene
61.7 5ʹ-CATATGTGCTCCGCAGGACTAG-3ʹ5ʹ-CTTGTACACGGAGCCATCCA-3ʹ ForwardReverse GK
62.7 5ʹ-GGATCTACCTTGCGGCTCACT-3ʹ5ʹ-TGTAGATGCCCCGGATGTG-3ʹ ForwardReverse G6Pase
63.4 5ʹ-CATCAAAACGTAGAGCACGGTAA-3ʹ5ʹ-TATGGGCATTTAGTCTGCACGTA-3ʹ ForwardReverse GLUT-2
62 5ʹ- TGAAAAGTCACCTCCGTTCTCT-3ʹ5ʹ-CTCTCGTCATTCCAAAGTCTCC-3ʹ ForwardReverse IR-1A