Coronary Calcification and Male Gender
Predict Significant Stenosis in Symptomatic
Patients in Northern and Southern Europe
and the USA: A Euro-CCAD Study
Ying Zhao
1, Rachel Nicoll
2, Axel Diederichsen
3, Hans Mickley
3, Kristian Ovrehus
4, Jose
Zamorano
5, Benjamin Dubourg
6, Axel Schmermund
7, Erica Maffei
8, Filippo Cademartiri
8,9,
Matt Budoff
10, Urban Wiklund
11, Michael Y Henein
21. Department of Ultrasound, Beijing Anzhen Hospital, Capital Medical University, Beijing, China 2. Institute of Public Health and Clinical Medicine, Umeå University, Umeå, Sweden
3. Department of Cardiology, Odense University Hospital, Denmark 4. Vejle Hospital, Vejle, Denmark
5. University Alcala, Hospital Ramon y Cajal, Madrid, Spain
6. Radiology department of Rouen University hospital, Rouen, France 7. Bethanien Hospital, Frankfurt, Germany
8. Centre de Recherche & Department of Radiology, Montréal Heart Institute/Université de Montréal, Montréal, QC, Canada 9. Department of Radiology, Erasmus Medical Center University, Rotterdam, The Netherlands
10. Los Angeles Biomedical Research Institute at Harbor-UCLA Medical Center, Los Angeles, USA 11. Department of Radiation Sciences, Umeå University, Umeå, Sweden
Corresponding author: Michael Henein MSc PhD FESC Professor of Cardiology
Institute of Public Health and Clinical Medicine Umeå University, Umeå, Sweden
Email: [email protected]
Abstract
Background
Significant stenosis is the principal cause of stable angina but its predictors and their variation by geographical region are unclear.
Methods and Results
From the European Calcific Coronary Artery Disease (Euro-CCAD) cohort, we retrospectively investigated 5515 symptomatic patients from northern Europe (Denmark, France, Germany), southern Europe (Italy, Spain) and the USA. All had conventional cardiovascular risk factor assessment, angiography and CT scanning for coronary artery calcium (CAC) scoring. There were differences in the patient characteristics between the groups, with the USA patients being younger and having more diet and lifestyle-related risk factors, although hypertension may have been better controlled than in Europe. USA patients had a two-fold increase in prevalence of significant stenosis and a three-fold increase in median CAC score. In all three groups, the log CAC score proved to be the strongest predictor of >50% stenosis followed by male gender. In the USA group, there were no additional independently predictive risk factors, although in northern Europe obesity, hypertension, smoking and hypercholesterolaemia remained predictive, with all risk factors other than hypertension proving to be predictive in the southern Europe group. Without the CAC score as a variable, male gender followed by diabetes were the most important predictors in all three regions, with hypertension also proving predictive in northern Europe.
Conclusions
In symptomatic patients, the CAC score and male gender were the two most important predictors of significant stenosis in northern and southern Europe and the USA.
Keywords: Stenosis, coronary artery calcification, risk factors, geographical region
Citation: Zhao Y, Nicoll R, Diederichsen A, Mickley H, et al. Coronary Calcification and Male Gender Predict Significant Stenosis in Symptomatic Patients in Northern and Southern Europe and the USA: A Euro-CCAD Study. International Cardiovascular Forum Journal 2018;13:16-22, DOI: 10.17987/icfj.v13i0.487
ISSN: 2410-2636 © Barcaray Publishing
* Corresponding author. E-mail: [email protected]
Introduction
Coronary artery disease (CAD) is the most common cause of death in Europe and North America [1], making early detection or prediction of atherosclerosis an important clinical goal. Although conventional angiography remains the clinical reference standard in the diagnosis of significant CAD, computed tomographic coronary angiography (CTCA) permits not only detection of stenosis but also the presence and extent of coronary artery calcification (CAC) which reflects plaque burden. CAC forms within the coronary artery wall, and is usually found in or adjacent to atherosclerotic plaques and is consequently known as sub-clinical atherosclerosis [2]. In addition to its role in affecting plaque stability, extensive CAC can be associated with exertional angina even in the absence of significant flow limiting lesions [3].
The conventional cardiovascular (CV) risk factors (dyslipidaemia, hypertension, diabetes mellitus, obesity and smoking) are regularly used to estimate the 10-year coronary event risk [4]. The European Calcific Coronary Artery Disease (Euro-CCAD) study, an international platform established in 2009 in Umeå, Sweden, was initiated with an objective of assessing the additional role of coronary calcification in stratifying patterns of CAD in symptomatic patients. We have previously explored the relationship between CV risk factors, CAC and significant (>50%) stenosis in symptomatic patients [5]. This retrospective cross-sectional study elaborates on that report by investigating any differences in the predictive ability of conventional CV risk factors, including family history of coronary artery disease (CAD), and CAC for significant stenosis in symptomatic patients from northern and southern Europe and the USA.
Methods
Retrospective data was collected from seven heart centres in six countries on two continents in patients with intermediate (10-20%) 10-year risk for developing coronary heart disease [6]. Some data were collected from registries. Patients had typical or atypical angina symptoms; data allowing classification of chest pain as typical angina, atypical angina or non-cardiac chest pain as defined by Diamond [7] were not available although it was surmised that the majority had typical angina. Patients received a thorough clinical examination and assessment of conventional risk factors for CAD, together with CAC scoring using the local CT protocol. They also received coronary angiography (conventional or CTCA) to assess the presence and extent of stenosis. Significant coronary stenosis was defined as >50% narrowing of one or more of the epicardial coronary arteries.
These patients were collected from the following centres: Northern Europe
Denmark: 1015 patients from 2 centres; 825 CTCA, 190 angiography.
Germany: 345 patients; all CTCA. France: 546 patients; all angiography. Southern Europe
Italy: 2787 patients; all CTCA. Spain: 174 patients; all CTCA. USA
USA: 648 patients; all CTCA.
The exclusion criteria for this study were:
• Acute coronary syndrome or recent cardiovascular event • Stroke or transient ischaemic attack
• Cardiac valve disease • Atrial fibrillation
• Prior coronary intervention (percutaneous intervention or bypass graft surgery)
• Heart failure or previous decompensation • Chronic kidney disease (creatinine >120mmol/l) • Parathyroid disease
• Pregnancy
Computed tomography scanning protocol
CT scanning for coronary calcification was undertaken with the patient in the supine position. The heart was localized by low-dose, low-resolution spiral CT imaging of the chest. High-resolution scanning of the heart was begun at the level of the bifurcation of the main pulmonary artery and proceeded caudally through the cardiac apex. Rotation and slice acquisition protocols were adopted according to individual scanners and local protocols. At least four contiguous pixels with a CT density ≥130 Hounsfield units were used to define an area of CAC. The total CAC score (CACS) was computed from all calcified lesions by means of the Agatston score, calculated by multiplying the area of each lesion by a density factor and then summing the individual lesion scores [7]. Analyses were performed using local protocols and workstations [8]. Calcium scores were categorized as follows: 0, 1-99 (mild), 100-399 (moderate), 400-999 (severe) and ≥1000 (extensive).
Computed tomographic coronary angiogram scanning
protocol
CTCA was performed according to local protocols. Heart rate was controlled by oral or intravenous metoprolol administered before CTCA. As an example, CTCA may be performed using a 64-slice scanner (64 × 0.625 mm collimation, 330 ms gantry rotation time, VCT, GE Medical Systems, Milwaukee, WI, USA), with dose modulation attained with ‘electrocardiographic gating’ for maximum gantry delivery 40%-80% of the R-R interval. Image datasets were analysed using volume rendering and multiplanar reconstruction on post-processing workstations. A semiquantitative scale was used by the CTCA readers to grade extent of luminal stenosis as a percentage of the vessel diameter using visual estimation.
Risk factor assessment
kg/m2 indicating obesity. The patient was classified a smoker if they had smoked during the last month. A total risk factors score was created by counting 1 for each risk factor present, with the exception of age, without any attempt to give more weight to any particular risk factor.
Statistical analysis
Statistical analysis was undertaken using IBM SPSS Statistics version 18 (IBM Corporation, Armonk, NY, USA). Continuous variables were expressed as mean ± SD or median, the CAC score was log-transformed after adding 1 in the multivariable logistic regression model. The differences between groups (Europe vs USA and northern vs southern Europe) were analysed by Student’s t test or Mann-Whitney test, as appropriate. Categorical variables were expressed as absolute value and percentage and the differences were analysed by Chi-Square test. The covariates-adjusted odds ratios (OR) and 95% confidence intervals (CI) of risk factors were derived from the Multivariable Logistic Regression models. Patients with missing values were excluded from the Multivariable Logistic Regression analysis. To assess the stability of the derived models 10-fold cross-validation was used, where the corresponding classification accuracy, sensitivity and specificity were determined for each of the ten models. Classification results based on different sets of explanatory variables were compared using nonparametric methods. A p-value of <0.05 was considered statistically significant.
Results
Continent comparison: Europe vs USA Patient characteristics
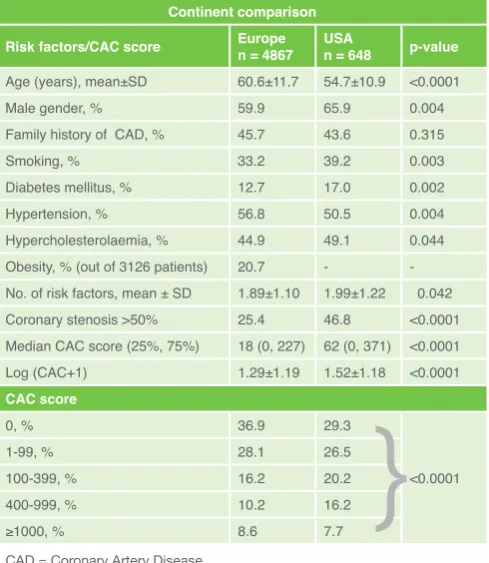
Table 1 shows the patient characteristics divided into 4867 patients from Europe and 648 from the USA. The USA patients were younger by a mean of six years (p<0.0001) with a higher percentage of males (p=0.004) than the Europe patients. In the USA group, the prevalence of diabetes (p=0.002), smoking (p=0.003) and hypercholesterolaemia (p=0.044) and the number of risk factors (p=0.042) were significantly higher but the prevalence of hypertension was lower (p=0.004) compared to the Europe group. There was no difference in the prevalence of a family history of CAD. Approximately 40% of obesity values were missing, including from all USA patients, and consequently no comparison could be carried out between continents.
The prevalence of significant coronary stenosis in the USA group was nearly double that of the Europe group (p<0.0001). Despite the mean age being higher in the European subjects, the median CAC score was more than three times higher in the USA group (p<0.0001) and the mean log (CAC+1) was also higher (p<0.0001). When broken down into CAC scores according to stenosis (Figure 1), the USA group had fewer patients with zero and mild CAC but more patients with moderate and severe CAC compared to the Europe group, since the USA group had more patients with any CAC score ≥100 (p<0.001) than the Europe group. The prevalence of extensive CAC (score ≥1,000) was not different between groups. The severity of calcification parallels the prevalence of coronary stenosis.
Multivariable risk factor predictors of >50% stenosis between Europe and USA patients with and without the CAC score as a risk factor
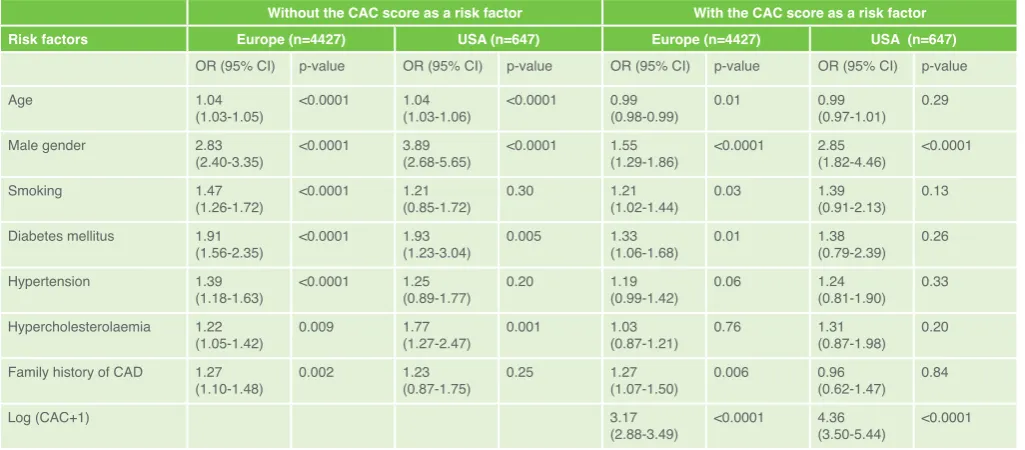
With the CAC score excluded as a risk factor, Table 2 shows that
in both the Europe and USA groups, age was strongly correlated with >50% coronary stenosis (p<0.0001 for both). Male gender was the strongest predictor of stenosis (ORs 2.83 and 3.89 respectively, p<0.0001), followed by diabetes (ORs 1.91, p<0.0001 and 1.93 p=0.005 respectively). In the Europe group, smoking was the next strongest predictor (OR 1.47, p<0.0001), followed by hypertension (OR 1.39, p<0.0001), family history of CAD (OR 1.27, p=0.002), and hypercholesterolaemia (OR 1.22, p=0.009). In the USA group, hypercholesterolaemia was the next strongest predictor (OR 1.77, p=0.001), but smoking, hypertension and family history of CAD were not independently predictive.
When the CAC score was included in the multivariable analysis its effect eclipsed that of all risk factors, giving an OR of 3.17 for the Europe group and 4.36 for the USA group (p<0.0001 for both). Age was correlated with >50% coronary stenosis only in the Europe group (p=0.01). Male gender remained the next most important predictor on both continents, with an OR of 1.55 for the Europe group and 2.85 for the USA group (p<0.0001 for both). In the Europe group, diabetes was the next most important risk factor (OR 1.33, p=0.01), followed by family history of CAD (OR 1.27, p=0.006), and smoking (OR 1.21, p=0.03), but hypertension and hypercholesterolaemia lost significance. In the USA group, there were no other independently predictive risk factors.
Region comparison: Northern vs Southern Europe Patient characteristics
Table 3 shows the patient characteristics divided into 1906 patients from northern Europe (NE) and 2961 from southern Europe (SE). The NE patients were slightly younger than the SE patients by a mean of two years (p<0.0001) but the gender ratio showed a higher percentage of males in the SE patients (p<0.0001). The prevalence of family history, smoking and obesity
Table 1.
Patient characteristics by continent Continent comparisonRisk factors/CAC score Europe n = 4867 USA n = 648 p-value
Age (years), mean±SD 60.6±11.7 54.7±10.9 <0.0001
Male gender, % 59.9 65.9 0.004
Family history of CAD, % 45.7 43.6 0.315
Smoking, % 33.2 39.2 0.003
Diabetes mellitus, % 12.7 17.0 0.002 Hypertension, % 56.8 50.5 0.004 Hypercholesterolaemia, % 44.9 49.1 0.044 Obesity, % (out of 3126 patients) 20.7 - -No. of risk factors, mean ± SD 1.89±1.10 1.99±1.22 0.042 Coronary stenosis >50% 25.4 46.8 <0.0001 Median CAC score (25%, 75%) 18 (0, 227) 62 (0, 371) <0.0001 Log (CAC+1) 1.29±1.19 1.52±1.18 <0.0001 CAC score
0, % 36.9 29.3
1-99, % 28.1 26.5
100-399, % 16.2 20.2 <0.0001
400-999, % 10.2 16.2
≥1000, % 8.6 7.7
were significantly higher among the NE patients (p<0.0001 for all), while the prevalence of diabetes (p=0.004), hypertension (p<0.0001), hypercholesterolaemia (p<0.0001) and the number of risk factors (p<0.0001) were significantly higher in the SE group.
The prevalence of significant coronary stenosis was not different between the two regions although the median CAC score was twice as high in the SE group (p=0.005) and the mean of log (CAC+1) was also higher (p=0.002). When broken down into CAC score ranges (Figure 2), the SE group had fewer patients with mild CAC but more with a CAC score of ≥100 (p<0.0001).
Multivariable risk factor predictors of >50% stenosis between NE and SE groups with and without the CAC score as a risk factor
With the CAC score excluded as a risk factor, Table 4 shows that in both the NE and SE groups, age was strongly correlated with >50% coronary stenosis (p<0.0001 for both). Male gender was the strongest predictor of significant stenosis (ORs 2.75 and 3.19 respectively, p<0.0001 for both). In the NE group, hypertension was the second strongest predictor (OR 1.45, p=0.004) followed by age (OR 1.04, p<0.0001); smoking, hypercholesterolaemia and family history of CAD had no predictive ability, while diabetes was borderline with a p-value of 0.05. In the SE group, diabetes was the second strongest predictor (OR 2.18, p<0.0001) after gender, followed by smoking (OR 1.86, p<0.0001), hypercholesterolaemia (OR 1.82, p<0.0001), hypertension (OR 1.42, p=0.002), and family history of CAD (OR 1.30, p=0.01). Obesity was excluded from this analysis due to a significant number of missing values but when a separate analysis was performed in the 3126 patients with complete data, the analysis showed that obesity was the second strongest predictor in the NE group (OR 2.40, p=0.03) but showed no predictive ability in the SE group (p=0.40).
When log (CAC +1) was included in the regression analysis, it became the most important independent predictor of significant stenosis in both the NE and SE groups (ORs 2.76 and 3.53 respectively, p<0.0001 for both), followed by male gender (ORs 1.62 and 1.69 respectively, p<0.0001 for
both). In the NE group the second most important predictor was hypercholesterolaemia (OR 1.51, p=0.003) followed by hypertension (OR 1.36, p=0.03) and smoking (OR 1.31,
Table 2.
Multivariate risk factor predictors of >50% stenosis between continents with and without the CAC score as a risk factorWithout the CAC score as a risk factor With the CAC score as a risk factor Risk factors Europe (n=4427) USA (n=647) Europe (n=4427) USA (n=647)
OR (95% CI) p-value OR (95% CI) p-value OR (95% CI) p-value OR (95% CI) p-value
Age 1.04
(1.03-1.05) <0.0001 1.04(1.03-1.06) <0.0001 0.99(0.98-0.99) 0.01 0.99(0.97-1.01) 0.29 Male gender 2.83
(2.40-3.35) <0.0001 3.89(2.68-5.65) <0.0001 1.55(1.29-1.86) <0.0001 2.85(1.82-4.46) <0.0001
Smoking 1.47
(1.26-1.72) <0.0001 1.21(0.85-1.72) 0.30 1.21(1.02-1.44) 0.03 1.39(0.91-2.13) 0.13 Diabetes mellitus 1.91
(1.56-2.35) <0.0001 1.93(1.23-3.04) 0.005 1.33(1.06-1.68) 0.01 1.38(0.79-2.39) 0.26 Hypertension 1.39
(1.18-1.63) <0.0001 1.25(0.89-1.77) 0.20 1.19(0.99-1.42) 0.06 1.24(0.81-1.90) 0.33 Hypercholesterolaemia 1.22
(1.05-1.42) 0.009 1.77(1.27-2.47) 0.001 1.03(0.87-1.21) 0.76 1.31(0.87-1.98) 0.20 Family history of CAD 1.27
(1.10-1.48) 0.002 1.23(0.87-1.75) 0.25 1.27(1.07-1.50) 0.006 0.96(0.62-1.47) 0.84
Log (CAC+1) 3.17
(2.88-3.49) <0.0001 4.36(3.50-5.44) <0.0001 CAD = Coronary Artery Disease
p=0.04). Diabetes and family history had no predictive ability. In the SE group, however, smoking was the next most important risk factor after log (CAC+1) and male gender (OR 1.64, p<0.0001), followed by hypercholesterolaemia (OR 1.63, p<0.0001), diabetes (OR 1.43, p=0.01) and family history of CAD (OR 1.32, p=0.02). Hypertension had no predictive ability. Age was not correlated with >50% stenosis in either group. Obesity was excluded from this analysis due to a significant number of missing values but when a separate analysis was performed in the 3126 patients with complete data, the analysis showed that obesity was the second strongest predictor in the NE group (OR 2.39, p=0.0006) but showed no predictive ability in the SE group.
The classification based on the regression models in Table 2, showed that the classification accuracy was higher when the CAC score was added (overall classification accuracy 81.7% for Europe and 80.8% for USA), compared to without CAC score (classification accuracy: 77.3% for Europe and 62.4% for USA). When the CAC score was added in the model, the specificity was 93% and sensitivity was 43% for Europe, 77% and 85% for USA. Without the CAC score, the specificity was 98% and sensitivity was 7% for Europe and 70% and 62% for USA.
Discussion
Study findingsThere are some striking differences in the patient characteristics between the Europe and USA groups. USA patients were younger and had more diet and lifestyle-related risk factors (diabetes, hypercholesterolaemia, smoking), although hypertension may have been better controlled than in Europe. They also showed a two-fold increase in the prevalence of significant stenosis and a three-fold increase in median CAC scores, compared to Europe. Nevertheless, the most important risk factors for >50% stenosis in both groups were male gender followed by diabetes. Hypercholesterolaemia was also predictive in the USA group, whereas in the Europe group all risk factors were predictive. When the log CAC score was included as a risk factor, it became by far the most important predictor of >50% stenosis in both continents, followed by male gender. In the USA group, there were no additional independently predictive risk factors but in the Europe group, diabetes remained a strong predictor but hypertension and hypercholesterolaemia lost significance. This indicates that despite the increased prevalence of risk factors in the USA group, other than male gender they all become confounding factors in the face of the overwhelming impact of the CAC score.
The difference in age between northern and southern Europe is not so marked but the other risk factors are divided between a greater prevalence of family history, obesity and smoking in NE but a lower incidence of diabetes, hypertension and hypercholesterolaemia. Although the median CAC score was 2-fold lower in the NE group compared to the SE group, there was no difference in the prevalence of significant stenosis. In the NE group, male gender
Table 3.
Patient characteristics by European region Europe region comparisonRisk factors/CAC score Northern Europe n = 1652
Southern Europe
n = 2961 p-value Age (years), mean±SD 59.3±11.0 61.5±12.0 <0.0001 Male gender, % 53.9 63.8 <0.0001 Family history of CAD, % 52.8 40.9 <0.0001
Smoking, % 45.7 25.2 <0.0001
Diabetes mellitus, % 11.0 13.9 0.004 Hypertension, % 50.3 61.0 <0.0001 Hypercholesterolaemia, % 34.5 50.9 <0.0001 Obesity, % (out of 3126 patients) 31.0 19.4 <0.0001 No. of risk factors, mean ± SD 1.95±1.11 2.07±1.24 <0.0001 Coronary stenosis >50% 25.9 25.1 0.55 Median CAC score (25%, 75%) 12 (0.179) 24 (0, 253) 0.005 Log (CAC+1) 1.22±1.17 1.33±1.20 0.002 CAC score
0, % 37.6 36.5
1-99, % 31.1 26.2
100-399, % 14.2 17.4 <0.0001
400-999, % 9.0 11.0
≥1000, % 8.1 8.9
CAD = Coronary Artery Disease
Table 4.
Multivariate risk factor predictors of >50% stenosis between Northern and Southern Europe with and without the CAC score as a risk factor Without the CAC score as a risk factor With the CAC score as a risk factorRisk factors Northern Europe (n=1652) Southern Europe (n=2775) Northern Europe (n=1652) Southern Europe (n=2775) OR (95% CI) p-value OR (95% CI) p-value OR (95% CI) p-value OR (95% CI) p-value
Age 1.04
(1.03-1.05) <0.0001 1.05 (1.04-1.06) <0.0001 0.99(0.97-1.00) 0.09 0.99 (0.98-1.01) 0.31 Male gender 2.75
(2.15-3.51) <0.0001 3.19(2.53-4.01) <0.0001 1.62(1.24-2.13) <0.0001 1.69(1.32-2.17) <0.0001
Smoking 1.08
(0.85-1.37) 0.56 1.86(1.49-2.31) <0.0001 1.31(1.01-1.70) 0.04 1.64(1.29-2.08) <0.0001 Diabetes mellitus 1.44
(0.99-2.07) 0.05 2.18(1.69-2.81) <0.0001 1.07(0.71-1.61) 0.74 1.43(1.08-1.90) 0.01 Hypertension 1.45
(1.13-1.86) 0.004 1.42(1.14-1.77) 0.002 1.36(1.04-1.78) 0.03 1.09(0.85-1.39) 0.52 Hypercholesterolaemia 01.25
(0.97-1.60) 0.09 1.82 (1.49-2.23) <0.0001 1.51(1.15-1.99) 0.003 1.63(1.31-2.03) <0.0001 Family history of CAD 1.07
(0.85-1.36) 0.57 1.30 (1.06-1.59) 0.01 1.06(0.82-1.37) 0.64 1.32(1.05-1.65) 0.02
Log (CAC+1) 2.76
(2.39-3.18) <0.0001 3.53(3.13-3.99) <0.0001
followed by obesity, hypertension were predictive of >50% stenosis but all risk factors were predictive in the SE group with the exception of obesity, with diabetes being the strongest after male gender. Again, when the log CAC score was included as a risk factor, it became by far the most important predictor of >50% stenosis in both European regions, followed by male gender. Curiously, the inclusion of the CAC score increased the number of predictive risk factors in the NE group (obesity and hypertension, smoking, hypercholesterolaemia), with all risk factors other than hypertension proving to be predictive in the SE group.
Comparison with similar studies
The principal geographical comparison studies have been between the US Multi-Ethnic Study of Atherosclerosis (MESA) and the German Heinz Nixdorf Recall study (HNR), both population studies, whereas ours investigated referred symptomatic patients. Although none of these comparison studies assessed significant stenosis, a study of CAC [8] showed that the prevalence of most risk factors among the German cohort was higher than among the US cohort. As in our study, hypertension was lower in the USA group, thought to be due to greater use of anti-hypertensive medication; incidence of smoking and hypercholesterolaemia was also lower in the US cohort but diabetes prevalence was similar. Another comparison study, using a completely different USA cohort (from the Epidemiology of Coronary Calcification study) but possible duplicates among the HNR population, found that risk factors were generally more prevalent among Germans, particularly smoking [9]. A further study comparing Caucasian cohorts from the USA, Portugal and Brazil [10], the latter two selected for their genetic similarity, found that generally risk factors among males and females were most prevalent among the Brazilian cohort, which had the lowest mean age, and were least prevalent in the US cohort, with the Portuguese cohort lying in between; the only exception was the incidence of smoking, which was highest among Portuguese men.
Another MESA/HNR comparison study investigated predictors of carotid intima-media thickness (cIMT) [11], a known surrogate for coronary artery disease, and showed that the CV risk factors were generally worse in the HNR cohort. Nevertheless, the strongest risk factors associated with cIMT in both cohorts were age, male gender and systolic blood pressure, with smoking, diabetes and hypercholesterolaemia also proving significant. The authors described a ‘remarkable level of agreement’ between the US and German cohorts. A further cIMT study (IMPROVE) investigated elderly high risk Caucasian subjects from Finland, France, Italy, the Netherlands and Sweden [12] and found that a more northerly latitude was the most important determinant of cIMT, followed by age, gender, pulse pressure, duration of smoking, educational level and hypertension. Northern European participants had a significantly more proatherogenic profile than patients recruited in France and Italy, thought in part to have been related to the ready availability of olive oil and fresh fruits in southern Europe, which were only available to those of higher socioeconomic status in northern Europe. The authors also considered that a difference in vitamin D metabolism and incidence of depression may help to account for the geographical difference.
Clinical implications
It is interesting that in symptomatic patients, coronary calcification is the strongest predictor of significant stenosis irrespective of the
continent or geographical origin of the patients. This supports previous findings which showed that the extent of coronary calcification is a powerful predictor of stenosis severity. However this study also demonstrates the clinical predictive power of the CAC score over and above those of conventional risk factors, routinely used in clinical practice to manage such patients. Nevertheless, a few patients with stenosis have zero CAC, so the absence of CAC should be taken as indicative and not as ruling out the possibility of significant stenosis. The second important predictor was gender, which again complies with previous population findings which showed that coronary stenosis lags by almost 10 years of age in females compared to males. Although we found that the CAC score was the most important predictor of CAC presence, this does not obviate the need for optimum control of conventional risk factors, particularly in Europe, where they are more prevalent and modestly predictive.
Limitations:
the reproducibility of the assessment or the agreement between readers. The loss of potential predictive value of risk factors for stenosis could be related to the smaller sample volume of the USA patients compared to Europe, and also almost 50% of the former have stenosis compared to only 25% in Europe. Furthermore, most of the USA patients with stenosis are expected to have high CAC scores as shown in Figure 1. We did not have data on obesity in any USA patients and in some of the Europe patients, which hindered the inter-continental and inter-regional comparison of the influence of obesity. The CTCA local protocol might have slightly differed between centres, but this is unlikely to be of significant magnitude to alter the results or to re-stratify patients into different categories. Nutritional habits might also have, to some extent, influenced CAC development and extent, although objective assessment of this was not available.
Conclusion
The most striking result in our study is the strong importance of the CAC score followed by male gender as independent predictors of >50% stenosis in all geographical regions, despite little similarity in the conventional risk factor profiles. Since there were no other independent predictors in the USA group, it suggests that conventional risk factors are either predictive of CAC score or not predictive of significant stenosis. This was in marked contrast to the two Europe groups, where virtually all risk factors with the exception of age remained predictive, albeit to a lesser extent. These differences might be related to the patients’ ethnicity, being mostly Caucasians in Europe but multi-ethnic in the US.
Declarations of Interest
The authors declare no conflicts of interest.
Acknowledgements
The authors state that they abide by the “Requirements for Ethical Publishing in Biomedical Journals” [13].
References
1. National Cholesterol Education Program Expert Panel on Detection E, Treatment of High Blood Cholesterol in A (2002) Third Report of the National Cholesterol Education Program (NCEP) Expert Panel on Detection, Evaluation, and Treatment of High Blood Cholesterol in Adults (Adult Treatment Panel III) final report. Circulation 106 (25):3143-3421
2. Rumberger JA, Simons DB, Fitzpatrick LA, Sheedy PF, Schwartz RS (1995) Coronary artery calcium area by electron-beam computed tomography and coronary atherosclerotic plaque area. A histopathologic correlative study. Circulation 92 (8):2157-2162
3. Nicoll R, Henein M (2010) Extensive coronary calcification: a clinically unrecognised condition. Current vascular pharmacology 8 (5):701-705 4. Grundy SM, Cleeman JI, Merz CN, Brewer HB, Jr., Clark LT, Hunninghake
DB, Pasternak RC, Smith SC, Jr., Stone NJ, National Heart L, Blood I, American College of Cardiology F, American Heart A (2004) Implications of recent clinical trials for the National Cholesterol Education Program Adult Treatment Panel III guidelines. Circulation 110 (2):227-239. doi:10.1161/01. CIR.0000133317.49796.0E
5. Nicoll R, Zhao Y, Wiklund U, Diederichsen A, Mickley H, Ovrehus K, Zamorano J, Gueret P, Schmermund A, Maffei E, Cademartiri F, Budoff M, Henein M (2017) Diabetes and male sex are key risk factor correlates of the extent of coronary artery calcification: A Euro-CCAD study. Journal of diabetes and its complications 31 (7):1096-1102. doi:10.1016/j. jdiacomp.2017.03.013
6. Wilson PW, D’Agostino RB, Levy D, Belanger AM, Silbershatz H, Kannel WB (1998) Prediction of coronary heart disease using risk factor categories. Circulation 97 (18):1837-1847
7. Diamond GA (1983) A clinically relevant classification of chest discomfort. Journal of the American College of Cardiology 1 (2 Pt 1):574-575 8. Erbel R, Delaney JA, Lehmann N, McClelland RL, Mohlenkamp S, Kronmal
RA, Schmermund A, Moebus S, Dragano N, Stang A, Jockel KH, Budoff MJ, Multi-Ethnic Study of A, Investigator Group of the Heinz Nixdorf Recall S (2008) Signs of subclinical coronary atherosclerosis in relation to risk
factor distribution in the Multi-Ethnic Study of Atherosclerosis (MESA) and the Heinz Nixdorf Recall Study (HNR). European heart journal 29 (22):2782-2791. doi:10.1093/eurheartj/ehn439
9. Schmermund A, Lehmann N, Bielak LF, Yu P, Sheedy PF, 2nd, Cassidy-Bushrow AE, Turner ST, Moebus S, Mohlenkamp S, Stang A, Mann K, Jockel KH, Erbel R, Peyser PA (2007) Comparison of subclinical coronary atherosclerosis and risk factors in unselected populations in Germany and US-America. Atherosclerosis 195 (1):e207-216. doi:10.1016/j. atherosclerosis.2007.04.009
10. Santos RD, Nasir K, Rumberger JA, Budoff MJ, Braunstein JB, Meneghelo R, Barreiros M, Pereirinha A, Carvalho JA, Blumenthal RS, Raggi P (2006) Difference in atherosclerosis burden in different nations and continents assessed by coronary artery calcium. Atherosclerosis 187 (2):378-384. doi:10.1016/j.atherosclerosis.2005.09.017
11. Bauer M, Delaney JA, Mohlenkamp S, Jockel KH, Kronmal RA, Lehmann N, Mukamal KJ, Moebus S, Polak JF, Dragano N, Budoff MJ, Erbel R, McClelland RL, Multi-Ethnic Study of A, Investigator Group of the Heinz Nixdorf Recall S (2013) Comparison of factors associated with carotid intima-media thickness in the Multi-ethnic Study of Atherosclerosis (MESA) and the Heinz Nixdorf Recall Study (HNR). Journal of the American Society of Echocardiography : official publication of the American Society of Echocardiography 26 (6):667-673. doi:10.1016/j.echo.2013.03.011 12. Baldassarre D, Nyyssonen K, Rauramaa R, de Faire U, Hamsten A, Smit AJ,
Mannarino E, Humphries SE, Giral P, Grossi E, Veglia F, Paoletti R, Tremoli E, group Is (2010) Cross-sectional analysis of baseline data to identify the major determinants of carotid intima-media thickness in a European population: the IMPROVE study. European heart journal 31 (5):614-622. doi:10.1093/eurheartj/ehp496