JPRHC
Research Article
JPRHC Volume 3 Issue 3 Page 72-76
ESTIMATION OF GATIFLOXACIN IN PHARMACEUTICAL DOSAGE FORMS BY HIGH PERFORMANCE LIQUID CHROMATOGRAPHY
A. LAKSHMANA RAO1*, B.N.V. RAVI KUMAR2 and G.GIRIJA SANKAR2 For Author affiliations see end of the text
This paper is available online at www.jprhc.in
ABSTRACT
A simple, rapid, sensitive and precise High Performance Liquid Chromatographic (HPLC) method has been developed for the estimation of gatifloxacin in its pharmaceutical dosage forms. In this method RP-C18 column
(150mmx4.6mm I.D., 5 m particle size) with mobile phase consisting of acetonitrile and 0.05M phosphate buffer in the ratio of 25:75 v/v in isocratic mode was used. The detection wavelength is 293nm and the flow rate is 0.8ml/min. Ciprofloxacin is used as internal standard. The
linearity was found to be in the range of 0.1 to 10 g/ml and shows a correlation coefficient of 0.9999. The intra- and inter-day variation was found to be less than 1.2% showing high precision of the assay method. The mean percent recovery of the drug from the solution containing 4 g/ml was 100.5 2.06 indicating high accuracy of the proposed method. Hence, this method is simple, fast, specific, accurate, precise and less time consuming for the estimation of gatifloxacin in pharmaceutical dosage forms.
Keywords: HPLC, Gatifloxacin, Estimation, Pharmaceutical dosage forms.
INTRODUCTION
Gatifloxacin(GTF)1 is a broad-spectrum
antimicrobial fluoroquinolone that is active against both gram-positive and gram-negative bacteria, is used in the treatment of wide range of infections. Chemically GTF2 is
1-Cyclopropyl-6-fluoro-1,4- dihydro-8-methoxy-7-(3-methyl-1-piperazinyl)-4-oxo-3-quinolonecarboxylicacid. GTF acts by inhibiting bacterial DNA synthesis by inhibiting DNA gyrase3. Literature survey reveals that a few
methods based on Spectrophotometric4,
Spectrofluorimetric5, HPTLC6 and HPLC7-15 have
been reported for the determination of GTF. In this present study a simple, rapid, accurate, sensitive and precise HPLC method was developed for the estimation of GTF in pharmaceutical dosage forms.
EXPERIMENTAL
GTF was a gift sample from M/s Panacea Biotec. Ltd., New Delhi and Ciprofloxacin was a gift sample from M/s Dr. Reddy’s Lab Ltd., Hyderabad. Acetonitrile of HPLC grade (E-Merck) and Triple distilled water was used. All other reagents used in the study were of AR quality (E-Merck).
Instrumentation
Quantitative HPLC was performed on a HPLC pump Waters Breeze system with Waters 1500 series HPLC pump, Waters 2487 dual absorbance detector and RP-C18 column
(150mmx4.6mm I.D., 5 m particle size) was used. The HPLC system was equipped with Waters Breeze Software.
HPLC Conditions
The contents of the mobile phase were acetonitrile and 0.05M phosphate (KH2PO4) buffer
(pH adjusted to 3.0 with orthophosphoric acid) were filtered through a 0.45 m membrane filter before use, degassed and were pumped from the solvent reservoir in the ratio of 25:75 v/v into the column at a flow rate of0.8ml/min. The run time was set at 6 minutes. The volume of injection loop was20 l prior to injection of the drug solution the column was equilibrated for atleast 30 min. with the mobile phase flowing through the system.
Preparation of Stock solution
JPRHC
Research Article
JPRHC Volume 3 Issue 3 Page 72-76
mark. Daily working standard solutions of GTF and ciprofloxacin were prepared by suitable dilutions of the stock solution with the mobile phase.
Calibration solutions
Nine sets of the GTF solutions were prepared in mobile phase at concentrations of 0.1, 0.2, 0.4, 0.6, 1, 2, 4, 6 and 10 g/ml along with a fixed concentration (4 g/ml) of ciprofloxacin as internal standard.
Procedure
The standard solutions prepared as above were filtered through 0.45 m membrane filter and the filterate was injected (20 l) six times into the column at a flow rate of 0.8 ml/min. The ratio of GTF peak area to that of internal standard for each of the drug concentrations was calculated. The regression of the GTF concentration over the ratio of GTF peak area to that of internal standard was obtained. This regression was used to estimate the amount of GTF in pharmaceutical dosage forms.
GTF solutions containing 2 g/ml, 4 g/ml and 6 g/ml were subjected to the proposed HPLC analysis for finding out the intra- and inter-day variations. The recovery studies were carried out by adding known amount of GTF to the preanalysed samples and subjecting them to the proposed HPLC method.
Estimation of GTF in Pharmaceutical dosage forms
Tablets: Twenty tablets were weighed and powdered. An accurately weighed portion of the powder, equivalent to 100 mg of GTF was transferred to a 100 ml volumetric flask containing 50 ml of 0.1M HCl. The contents of the flask were sonicated to dissolve GTF, made upto volume to get a solution of 1 mg/ml and the resulting solution was filtered through 0.45 m membrane filter.
Injections: An aliquot of injection equivalent to 100 mg of GTF was transferred into a 100 ml volumetric flask and volume was made upto 100 ml with a 0.1M HCl to get a solution of 1 mg/ml. Further dilutions were made with mobile phase to get a working standard solution of 100 g/ml.
Aliquots of this solution was transferred to volumetric flasks and made upto sufficient volume with mobile phase to give an expected
concentration along with a fixed concentration (4 g/ml) of internal standard. This solution (20
l) was injected six times into the column. The mean values of peak area ratio of GTF to internal standard of six such determinations were calculated and the GTF content in the tablet and injection dosage forms were quantified using the regression equation obtained below. The same procedure was used to estimate the concentration of the GTF in two more commercial brands.
RESULTS AND DISCUSSION
The present study was carried out to develop a specific, sensitive, precise and accurate HPLC method for the analysis of GTF in pharmaceutical dosage forms. A typical chromatogram is shown in Fig. 1. The retention times for GTF and internal standard (ciprofloxacin) were 3.21 and 2.48 min respectively. Each of the samples were injected five times and the same retention times were observed in all cases. The ratio of peak area of GTF to peak area of internal standard for different concentrations as above were calculated and the average values for six such determinations are shown in Table 1. The peak areas of both the GTF and internal standard were reproducible as indicated by low coefficient of variation (0.42 %). A good linear relationship (r = 0.9999) was observed between the concentration of GTF and the respective ratio of peak areas. The regression of GTF concentration over its peak area ratio was found to be Y = 0.0061 + 0.6083X (Where Y = ratio of peak area of GTF to that of internal standard; X = concentration of GTF) in the range of 0.1-10 g/ml.
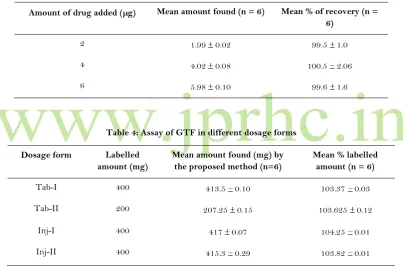
When GTF solution containing 2, 4 and 6 g/ml were analysed by the proposed HPLC method for finding out intra- and inter-day variation, a low coefficient of variation was observed (Table 2). This shows that the present HPLC method is highly precise. The amounts of GTF from the preanalysed samples containing known amounts of the GTF are shown in Table 3. About 100.5 % of GTF could be recovered from the preanalysed samples indicating the high accuracy of the proposed HPLC method.
JPRHC
Research Article
JPRHC Volume 3 Issue 3 Page 72-76
peaks indicates no interference of the excipients used in the dosage forms. The dosage forms were found to contain 103.37 to 104.25 % of the labelled
amount. The low % CV indicates the reproducibility of the assay of GTF in pharmaceutical dosage forms
.
Fig. 1: Typical Chromatogram of Gatifloxacin
Table 1: Calibration of the HPLC method for the estimation of GTF
Concentration of GTF ( g/ml)
Mean peak area ratio (n = 6)
% CV
0.1 0.0682 0.95
0.2 0.1265 0.42
0.4 0.2504 0.47
0.6 0.3772 0.54
1 0.6020 0.36
2 1.2242 0.97
4 2.4662 1.21
6 3.6255 0.44
10 6.0984 1.53
JPRHC
Research Article
JPRHC Volume 3 Issue 3 Page 72-76
Table 2: Precision of the proposed HPLC method
GTF concentration ( g/ml)
Concentration of GTF ( g/ml) found on
Intra-day Inter-day
Mean (n = 6) (%) CV Mean (n = 6) (%) CV
2 2.15 0.93 2.05 1.20
4 4.07 1.75 3.98 0.97
6 6.12 1.21 6.03 0.73
Table 3: Recovery of GTF
Amount of drug added ( g) Mean amount found (n = 6) Mean % of recovery (n = 6)
2 1.99 0.02 99.5 1.0
4 4.02 0.08 100.5 2.06
6 5.98 0.10 99.6 1.6
Table 4: Assay of GTF in different dosage forms
Dosage form Labelled
amount (mg)
Mean amount found (mg) by the proposed method (n=6)
Mean % labelled amount (n = 6)
Tab-I 400 413.5 0.10 103.37 0.03
Tab-II 200 207.25 0.15 103.625 0.12
Inj-I 400 417 0.07 104.25 0.01
Inj-II 400 415.3 0.29 103.82 0.01
CONCLUSION
The proposed HPLC method enables quantitative determination of third generation fluoroquinolones such as gatifloxacin in pharmaceutical dosage forms. Preparation of samples is easy and efficient. UV detection at 293nm was found to be suitable without any interference from tablets or injections excipients or solvents. All calibration curves were found to be linear with correlation coefficient of 0.9999. Analytical results of samples were in accordance
with those of standard solution in the same concentrations. The proposed HPLC method is simple, specific, sensitive, accurate and precise and can be used in routine analysis in quality control laboratories.
ACKNOWLEDGEMENTS
JPRHC
Research Article
JPRHC Volume 3 Issue 3 Page 72-76
REFERENCES
1. The Merck Index, 13th edition, Merck &
Co., Whitehouse Station, NJ, 2001; 4388: 777.
2. Perry, Caroline M, Barman B, Julia A and Harriet M, Gatifloxacin, Drugs, 1999; 58: 683-696.
3. Goodman and Gilmans, The Pharmacological Basis of Therapeutics, 11th edition, Mcgraw-Hill
MedicalPublishing Division, New York, 2006, 1119.
4. Changchuan G, Peng D, Zhijie C, Lie W and Wei J, Rapid determination of gatifloxacin in biological samples and pharmaceutical products using europium-sensitized fluorescence spectrophotometry, Luminescence, 2008; 23: 7-13.
5. Xiashi Z, Aiqin G and Suhai Y, Fluorescence probe enhanced spectrofluorimetric method for the determination of gatifloxacin in pharmaceutical formulations and biological fluids, Spectrochimica Acta Part A: Molecular and Biomolecular Spectroscopy, 2008; 69: 478-482.
6. Suhagia B N, Shah S A, Rathod I S, Patel H M, Shah D R and Marolia B P, Determination of gatifloxacin and ornidazole in tablet dosage forms by HPTLC, Anal. Sci., 2006; 22: 743-747.
7. Leandro T and Teresa D C, High performance liquid chromatography for quantification of gatifloxacin in rat plasma following automated on-line solid phase extraction, J. Pharm. Biomed. Anal., 2007; 44: 205-210.
8. Sonali P, Lata K, Asha T and Deshpande A D, Simultaneous RP-HPLC estimation of gatifloxacin and ornidazole in tablet dosage forms, Ind. J. Pharm. Sci., 2007; 69: 525-528.
9. Al-Dgither S, Naseeruddin Alvi S and Hammami M H, Development and validation of an HPLC method for the determination of gatifloxacin stability in
human plasma, J. Pharm. Biomed. Anal., 2006; 41: 251-255.
10. Salgado H R N Lopes C C G O, Determination of gatifloxacin in bulk and tablet preparations by HPLC, J. AOAC Int., 2006; 89: 642-645.
11. Santoro M I R M, Kassab N M, Singh A K and Kedor-Hackmam E R M, Quantitave determination of gatifloxacin, levofloxacin, lomefloxacin and pefloxacin fluoroquinolonic antibiotics in pharmaceutical preparations by HPLC, J. Pharm. Biomed. Anal., 2006; 40: 179-184.
12. Carazos M L S, Gonzalez L Y C, Lerma G G and Torres N W, Determination of gatifloxacin in semen by HPLC with diode-array and fluorescence detection, Chromatographia, 2006; 63: 605-608.
13. Overholser B R, Kays M B and Sowinski K M, Determination of gatifloxacin in human serum and urine by HPLC with ultraviolet detection, J. Chromatogr. B, 2003; 798: 167-173.
14. Borner K, Hartwig H and Lode H, Determination of gatifloxacin in human serum and urine by HPLC, Chromatographia, 2000; 52: S105-S107.
15. Hisao K, Hajimu K and Ryozo I, HPLC determination of gatifloxacin, a new quinolone, in biological fluids, Japanese J.
Chemotherapy, 1999; 47(2): 104-111.
AUTHORS AFFILIATIONS AND ADDRESS FOR CORRESPONDENCE
1. Principal and Professor,
V.V. Institute of Pharmaceutical Sciences, Gudlavalleru- 521 356, A.P.
2. College of Pharmaceutical Sciences, Andhra University,