THE RESPONSE OF ROOT SYSTEM ARCHITECTURE TO SOIL COMPACTION
Saoirse Rosanna Tracy, BSc. (Hons)
Thesis submitted to the University of Nottingham for the degree of Doctor of Philosophy
Abstract
Soil compaction has been described as the most serious environmental problem
caused by conventional agriculture, as it results in several stresses which may
interact simultaneously, including increased soil strength, decreased aeration
and reduced hydraulic conductivity. Root system architecture (RSA) is the
arrangement of roots within the soil matrix and is important because the
specific deployment of roots within the soil can determine soil exploration and
resource uptake. As roots deliver water and nutrients to growing plants, whilst
also providing anchorage, their importance cannot be overstated. Yet, our
understanding of how roots interact with the surrounding soil, especially at the
micro-scale level, remains limited because soil is an opaque medium, so
preventing roots from being visualised without disturbing them. Destructive
techniques are commonly employed for the analysis of RSA, however this can
result in the loss of key information concerning root architecture, such as
elongation rates and root angles and important soil characteristics such as soil
structure and pore connectivity. However, X-ray Computed Tomography (CT)
has been shown to be a promising technique for visualising RSA in an
undisturbed manner. The species considered in this thesis were wheat
(Triticum aestivum L.) and tomato (Solanum lycopersicum L.). Further
information regarding the response of roots to soil compaction has been
achieved through the use of X-ray CT, automatic root tracing software and
novel image analysis procedures. Soil compaction significantly affected root
length, volume, surface area, angle, diameter, elongation rates and root path
soil, possibly due to the greater nutrient and water holding capacity, but
adversely affected root growth in loamy sand. The results suggest that there is
an optimum level of soil compaction for the different soil types. Roots
elongated rapidly between 2-3 days after germination (DAG), it is
hypothesised that is related to the mobilization of seed storage substances to
the growing roots. The use of transgenic mutants of tomato with altered levels
of abscisic acid (ABA) has provided a greater insight into the role of ABA in
mediating root responses to soil compaction. This work will enable better
phenotyping of plant varieties with enhanced root system traits for resource
foraging and uptake. Knowledge of the responses of root systems in
heterogeneous soil is vital to validate root phenotypes and overcome future
Publications arising from this work
Refereed journal articles included in the thesis
Tracy, S.R., Black, C.R., Roberts, J.A., Mooney, S.J. (2012) Exploring the interacting effect of soil texture and bulk density on root system development in tomato (Solanum lycopersicum L.). Under review.
Tracy, S.R., Black, C.R., Roberts, J.A., Sturrock, C., Mairhofer, S., Craigon, J., Mooney, S.J. (2012) Quantifying the Impact of soil compaction on root system architecture in tomato (Solanum lycopersicum L.) by X-ray micro-Computed Tomography (CT). Annals of Botany, 110, 511 – 519.
Tracy, S.R., Black, C.R., Roberts, J.A., McNeill, A., Davidson, R., Tester, M., Samec, M., Korošak, D., Sturrock, C., Mooney, S.J. (2011) Quantifying the effect of soil compaction on three varieties of wheat (Triticum aestivum L.) using X-ray micro-Computed Tomography (CT). Plant and Soil, 353,195-208.
Tracy, S.R., Black, C.R., Roberts, J.A., Mooney, S.J. (2011) Soil compaction: a review of past and present techniques for investigating effects on root growth. Journal of the Science of Food and Agriculture, 91,1528-1537.
Tracy, S.R., Roberts, J.A., Black, C.R., McNeill, A., Davidson, R., Mooney, S.J. (2010) The X-factor: Visualizing undisturbed root architecture in soils using X-ray computed tomography. Journal of Experimental Botany, 61, 311-313.
Other related refereed journal articles not included as
part of this thesis
Zappala, S., Mairhofer, S., Tracy S.R., Sturrock, C.J., Bennett M., Pridmore T., Mooney, S.J. (2012) The effect of soil moisture content on quantifying root system architecture in X-ray Computed Tomography images. Plant and Soil, Under review.
Helliwell, J., Sturrock, C., Grayling, K., Tracy, S.R., Whalley, W.R., Flavel, R., Young, I.M., Mooney, S.J. (2012) Applications of X-ray Computed Tomography into studies of the soil physical environment. European Journal of Soil Science, Under review.
Mairhofer, S., Zappala, S., Tracy, S.R., Sturrock, C., Bennett, M., Mooney, S.J. and Pridmore, T. (2012) RooTrak: Automated Recovery of Three-Dimensional Plant Root Architecture in Soil from X-Ray Micro-computed Tomography Images Using Visual Tracking. Plant Physiology, 158, 561-569.
Acknowledgements
Firstly I would like to acknowledge the University of Nottingham and the Interdisciplinary Doctoral Training Centre (IDTC) fund for providing the finance to conduct my PhD research for the last 4 years. Also to the British Society of Soil Science and the Society of Experimental Biology for providing student travel grants during my PhD.
I am extremely grateful to my three wonderful supervisors, Prof. Sacha Mooney, Prof. Colin Black and Prof. Jerry Roberts. It was an honour to be guided through my PhD by three very wise men, who were patient, kind, and inspiring. But the thing I am most thankful for is that each had a great sense of humour, which I couldn‟t have done without. Thank you for instilling confidence in me and I will forever look back on our meetings with great fondness.
I would also like to acknowledge Dr. Helen West, who during an undergraduate summer project told me what a PhD entails and made me realise that academic research was the path I wanted to follow. As my PhD was inter-divisional I would like show gratitude to all the technical and admin staff I have pestered with requests over the years. My colleagues across all of Biosciences I am grateful for their comradeship and support.
To old and new friends, thank you for the “Craic”, my lab group, Farmers‟ Market co-founders and resident tutor team amongst many others. Lastly, but by no means least, I am extremely indebted to all my family for the encouragement and belief they give, but especially to my Mum, who I owe so much to.
Lots of Love
Saoirse
CONTENTS
Abstract ... I Publications arising from this work ... III Refereed journal articles included in the thesis ... III Other related refereed journal articles not included as part of this thesis ... III Acknowledgements...IV Abbreviations and acronyms ... VIII List of Tables ... X List of Figures ...XI
1. Chapter 1 ... 1
Author contribution ... 1
Abstract ... 2
Introduction ... 2
Root responses to soil compaction ... 3
Soil strength and root growth ... 3
Root resistance to mechanical impedance ... 3
Radial expansion of roots ... 4
Root elongation rate ... 4
The root cap ... 4
Root exudates... 5
Plant responses to soil compaction ... 5
Resource capture ... 5
Root-to-shoot signaling in response to soil compaction ... 5
Effects on yield ... 6
Innovative techniques for studying the impact of compaction on root growth ... 7
X-ray Computed Tomography ... 7
Other three-dimensional visualisation techniques ... 8
The use of genetic techniques to establish root-sourced signals ... 8
Conclusions ... 9
Acknowledgments ... 9
References ... 9
2. Chapter 2 ... 12
2.1.3 Thesis structure ... 14 3. Chapter 3 ... 16 Author contribution ... 16 Viewpoint ... 17 Conclusions ... 18 References ... 18 4. Chapter 4 ... 20
4.1 General Materials and Methods ... 20
4.1.1 Soil types ... 20
4.1.2 Soil column packing ... 20
4.2 Soil Chemical analysis ... 21
4.2.1 pH ... 21
4.2.2 Nitrate ... 22
4.2.3 Phosphorus ... 22
4.2.4 Potassium ... 23
4.3 Soil Hydraulic Properties ... 24
4.3.1 Water release curves ... 24
4.3.2 Sand Table ... 24
4.3.3 Pressure Membrane Apparatus ... 25
5. Chapter 5 ... 27
Author contribution ... 27
Abstract ... 28
Introduction ... 29
Materials and methods... 30
Results ... 32 Discussion ... 37 Acknowledgements ... 40 References ... 40 6. Chapter 6 ... 42 Author contribution ... 42 Abstract ... 43 Introduction ... 43
Materials and methods... 44
Results ... 45
Literature cited ... 50
7. Chapter 7 ... 52
Author contribution ... 52
Abstract ... 54
Introduction ... 56
Materials and methods... 59
Results ... 63 Discussion ... 70 Conclusions ... 74 Acknowledgements ... 75 References ... 76 8. Chapter 8 ... 88 Author contribution ... 88 Summary ... 91 Introduction ... 92
Materials and methods... 98
Results ... 103 Discussion ... 111 Conclusions ... 114 Acknowledgements ... 115 References ... 116 9. Chapter 9 ... 132 9.1 General Discussion ... 132
9.1.2 Response of root system architecture to soil bulk density ... 132
9.1.3 Response of root system architecture to soil type ... 138
9.1.4 Response of root elongation rate to soil physical properties ... 140
9.1.5 The use of X-ray CT in root:soil interaction studies ... 143
9.1.6 Application of automatic root tracking algorithms and novel image analysis techniques ... 143
10. Chapter 10 ... 147
10.1 Conclusions ... 147
10.2 Further work ... 149
Abbreviations and acronyms
µCT Micro Computed Tomography
2-D Two dimensions
3-D Three dimensions
4-D Four dimensions
ABA Abscisic acid
ACC 1-aminocyclopropane-1-carboxylic acid
AMF Arbuscular mycorrhizal fungi AMR Acid molybdate reagent ANOVA Analysis of Variance
BC Before Christ
c. circa
cv. cultivar
cvs. cultivars
CT Computed Tomography
CTN Computed Tomography Number
DAG Days after germination
DAT Days after transplanting
DEFRA Department for Environment, Food and Rural Affairs
DI Deionised water
DW Dry weight
Ed. Editor
Eds. Editors
Figs. Figures
GE General Electric
ICP-MS Inductively Coupled Plasma Mass Spectrometry
IDTC Interdisciplinary Doctoral Training Centre
LLWR Least limiting water range MRI Magnetic resonance imaging
NCED 9-cis-epoxycarotenoid dioxygenase
NERC Natural Environment Research Council
NMR Nuclear magnetic resonance
Nr Never ripe
PGR Plant Growth Regulator
PPFD Photosynthetic photon flux density
psdcu Pore size distribution (coefficient of uniformity)
Roi Region of interest
RSA Root system architecture
SD Standard deviation
SED Standard error of the difference
SEM Standard error of the mean
sp superpromoter
Tel Telephone
vs. versus
UK United Kingdom
List of Tables
Table Title Page
Chapter 1
1.1 Maximum axial and radial root growth pressures (from Whalley and Dexter, 1993)
3
1.2 Relation between soil bulk density, penetration resistance and mean root diameter (from Kirby and Bengough, 2002)
4
1.3 Arabidopsis thaliana hormone mutants (adapted from Koncz et al., 1992)
8
Chapter 9
9.1 An overview of root characteristic responses observed in the different soil types in this thesis
List of Figures
Figure Title Page
Chapter 1
1.1 Root and apical meristem (from Hawes et al., 2003) 4
1.2 Effect of penetrometer resistance of soil on the leaf area of young wheat plants (from Masle and Passioura, 1987)
6
1.3 Three dimensional reconstruction of chick pea (Cicer arietinum L.) root system 21 days after germination (from Perret et al., 2007)
7
1.4 Cross-section of a soil column (3 cm diameter) showing a root of Triticum aestivum L. traced in 3-D using Rootviz; roots are shown in purple (from Tracy et al.,
2010)
8
Chapter 3
3.1 X-ray CT image of roots of a three week old Zea mays
(L) plant grown in a soil column (loamy sand, Newport series). 1 pixel = 44 µm
17
3.2 X-ray CT image of an Arabidopsis thaliana (L) root growing in a soil column (loamy sand, Newport series). 1 pixel = 16 µm
17
3.3 (A) Cross-section of a soil column (3 cm diameter) showing roots of Triticum aestivum (L.) traced in 3-D using RootViz; roots are shown in purple. (B) Root architecture of a three week old Zea mays (L.) plant grown in a soil column and extracted using Avizo® software 18 Chapter 4 4.1 4.2 4.3
Example image of a scanned loamy sand soil column at 33 µm
Water release curve of the clay loam and loamy sand soils of experimental values obtained
Water release curve of the clay loam and loamy sand soils of values fitted using the Van Genuchten-Mualem model
21
26
26
Chapter 5
5.1 RootViz3D® images of example root systems at 2, 5 and 12 DAG grown in high density soil; Excalibur a (i-iii), Kukri c (i-iii) and RAC875 e (i-iii) and low density soil; Excalibur b (i-iii), Kukri d (i-iii) and RAC875 f (i-iii). Scale bar represents 4 mm
32
5.2 Semi-automated segmented and RootViz3D® images of the root systems of 12 day old plants of (a, b) cv. Kukri grown in high bulk density soil (1.5 g cm-3), (c, d) cv.
Kukri grown in low bulk density soil (1.1 g cm-3) and (e,
the semi-automated segmentation and RootViz3D® approaches 2, 5 and 12 DAG in low and high bulk density soil (1.1 and 1.5 g cm-3 respectively). The linear regression and 1:1 lines are shown
5.4 RootViz3D® images of the roots of 12 day old cv. RAC875 plants grown on (a) low bulk density soil (1.1 g cm-3) and (c) high bulk density soil (1.5 g cm-3); (b, d) root systems of the same plants after extraction and analysis using the WinRHIZO® equipment. Scale bars represent 1 mm and 5 mm
34
5.5 Correlation between total root volumes at day 12 measured destructively using the WinRHIZO® technique and estimated using the RootViz3D® software for plants grown on low or high bulk density soil (1.1 and 1.5 g cm
-3
respectively). The 1:1 line is shown
35
5.6 Mean total root lengths in the low and high bulk density soil columns (1.1 and 1.5 g cm-3). Error bars show double standard errors of the mean. Vertical bars show standard errors of the difference (SED) between treatment means for comparing differences between (1) bulk density treatments and (2) cultivars. ANOVA: P=0.20 (bulk density) P=0.15 (cultivar)
35
5.7 Mean total root volumes derived from X-ray CT images for (a) plants of three wheat cultivars grown at low and high soil bulk densities (1.1 and 1.5 g cm-3) and (b) 2, 5 and 12 DAG for plants of cvs. Excalibur, Kukri and RAC875 grown at low (LD) and high (HD) bulk density. Double standard errors of the mean are shown. Vertical bars show standard errors of the difference (SED) between treatment means for comparing differences between (1) bulk density treatments, (2) cultivars and (3) time. ANOVA: P=0.04 (bulk density) P=0.258 (cultivar) P=<0.001 (time)
36
5.8 Changes in mean soil porosity in the low and high bulk density treatments (1.1 and 1.5 g cm-3) during the scanning period: (a) mean values for all cultivars 2, 5 and 12 DAG, and depth profiles in (b) low and (c) high bulk density columns containing an Excalibur plant. Double standard errors of the mean are shown in (a); vertical bars show standard errors of the difference (SED) between treatment means for comparing differences between (1) bulk density treatments and (2) time. ANOVA: P=<0.001 (bulk density) P=<0.001 (time)
36
5.9 Soil pore size distribution expressed as a percentage of the image area on Day 12 after germination for plants of
cvs. Excalibur (a, b), Kukri (c, d) and RAC875 (e, f) grown on low (a, c, e) or high bulk density soil (b, d, f; 1.1 and 1.5 g cm-3 respectively). Double standard errors of the mean are shown. Vertical bars show SED values
densities, (2) cultivars and (3) time. ANOVA: P=0.016 (bulk density) P=<0.001 (cultivar) P=0.989 (time)
Chapter 6
6.1 Example of (A) convex hull, (B) centroid, (C) maximum width and (D) rooting depth measurements for a 10-d-old tomato plant grown in compacted clay loam soil. Vertical lines represent vertical plane (B) and rooting depth (D)
45
6.2 Semi-automated segmented mean values for (A) root volume, (B) root surface area and (C) tap root length during the 10-d observation period for both compaction treatments and soil types. Error bars associated with the histograms show double standard errors of the mean. Standard errors of the difference are shown for (1) soil type, (2) compaction treatment and (3) day
46
6.3 WinRHIZO® analysis values for (A) total root length and (B) mean root diameter for both compaction treatments and soil types. Error bars associated with the histograms show double standard errors of the mean. Standard errors of the difference are shown for (1) soil type and (2) compaction treatment
46
6.4 Root growth over 10 consecutive days and final destructive WinRHIZO® root images (white background) for uncompacted and compacted clay loam (A, B) and loamy sand soil columns (C, D). Scale bar = 10 mm
46
6.5 Mean root tip diameter (A) and tortuosity (B) values for both compaction treatments and soil types. Error bars associated with the histograms show double standard errors of the mean. Standard errors of the difference are shown for (1) soil type and (2) compaction treatment
47
6.6 Convex hull volumes for 10-d-old plants grown in uncompacted (A) and compacted loamy sand soil (B). Vertical lines with arrow heads illustrate maximum rooting depth. (C) Mean convex hull volumes for both compaction treatments and soil types. Error bars associated with the histograms in (C) show double standard errors of the mean; standard errors of the difference (SED) are shown for (1) soil type and (2) compaction treatment
47
6.7 Mean daily tap root elongation rates for both compaction and soil type treatments during the 10-d experimental period. Error bars show double standard errors of the mean; standard errors of the difference are shown for (1) soil type, (2) compaction treatment and (3) day
47
6.8 Illustration showing how lateral root angle relative to a vertical plane (yellow line) was determined; inset image shows the angle measurement tool in Simpleware ScanIP software. Red cones indicate the ends of the measurement tool. Tripod shows direction of x, y and z
clay loam (A, B) and loamy sand soils (C, D) visualized using the Defect analysis tool in VGStudioMAX®. Blue areas show small unconnected pore space; green and orange areas are volumes of connected pores and equal the volume value on the scale bar. The intensity of colouration reflects the volume of connected pores
Chapter 7
7.1 WinRHIZO® analysis values at 3 (A, C, E) and 10 (B, D, F) days after germination (DAG) at bulk densities ranging from 1.2 to 1.6 Mg m-3 for mean root volume (A, B), root surface area (C, D) and root diameter (E, F). Error bars associated with the histograms show double standard errors of the mean. Standard errors of the difference (SED) are shown for (1) soil type, (2) compaction treatment and (3) time
80
7.2 Diagram showing typical root systems grown in clay loam (A) and loamy sand (B) soil at all bulk densities and destructively harvested at 3 (upper row) and 10 days after germination (DAG; lower row). Gradient bar represents increasing bulk density from left to right
81
7.3 WinRHIZO® analysis values at 3 (A, C) and 10 (B, D) days after germination (DAG) at soil bulk densities ranging from 1.2 to 1.6 Mg m-3 for total root length (A, B) and root dry weight (C, D). Error bars associated with the histograms show double standard errors of the mean. Standard errors of the difference (SED) are shown for (1) soil type, (2) compaction treatment and (3) time
82
7.4 WinRHIZO® analysis values at 3 (A, C) and 10 (B, D) days after germination (DAG) at soil bulk densities ranging from 1.2 to 1.6 Mg m-3 for shoot height (A, B) and shoot dry weight (C, D). Error bars associated with the histograms show double standard errors of the mean. Standard errors of the difference (SED) are shown for (1) soil type, (2) compaction treatment and (3) time
83
7.5 Semi-automated segmented mean values for (A) root volume, (B) root surface area and (C) root depth during the 10 day observation period for both compaction treatments and soil types. Error bars associated with the histograms show double standard errors of the mean. Standard errors of the difference (SED) are shown for (1) soil type, (2) compaction treatment and (3) time
84
7.6 Mean primary root length (A) and tortuosity (b) values for both compaction treatments and soil types. Error bars associated with the histograms show double standard errors of the mean. Standard errors of the difference (SED) are shown for (1) soil type and (2) compaction treatment
85
7.7 Root growth over 10 consecutive days and final destructive WinRHIZO® root images (white background)
clay loam (A and B) and loamy sand (C and D). Horizontal line represents the location of the bulk density transition. Scale bar indicates 1 cm
7.8 Mean lateral root numbers for both compaction treatments and soil types. Error bars associated with the histograms show double standard errors of the mean. Standard errors of the difference (SED) are shown for (1) soil type and (2) compaction treatment
87
Chapter 8
8.1 X-ray µCT-derived mean values for (a) root volume, (b) root surface area, (c) root depth and (d) primary root length for all compaction treatments and genotypes. Error bars associated with histograms show double standard errors of the mean. Standard errors of the difference (SED) are shown for (1) bulk density and (2) genotype
122
8.2 WinRHIZO® analysis values for (a) root volume, (b) root surface area and (c) total root system length for all compaction treatments and genotypes. Error bars associated with histograms show double standard errors of the mean. Standard errors of the difference (SED) are shown for (1) bulk density and (2) genotype
123
8.3 X-ray µCT-derived mean values for (a) number of lateral roots, (b) total lateral root length and (c) lateral root length for all compaction treatments and genotypes. Error bars associated with histograms show double standard errors of the mean. Standard errors of the difference (SED) are shown for (1) bulk density and (2) genotype
124
8.4 WinRHIZO® analysis values for mean (a) root diameter and (b) root tip diameter measurements determined by confocal microscopy for all compaction treatments and genotypes. Error bars associated with histograms show double standard errors of the mean. Standard errors of the difference (SED) are shown for (1) bulk density and (2) genotype
125
8.5 Destructive analysis values for (a) shoot height, (b) root length and (c) shoot dry weight for all compaction treatments and genotypes. Error bars associated with histograms show double standard errors of the mean. Standard errors of the difference (SED) are shown for (1) bulk density and (2) genotype
126
8.6 X-ray µCT-derived mean values for (a) convex hull volume for all compaction treatments and genotypes. Error bars associated with histograms show double standard errors of the mean. Standard errors of the difference (SED) are shown for (1) compaction and (2) genotype. (b) Typical root systems grown in
wildtype plants (7, 8 and 9) plants
8.7 X-ray µCT-derived mean values for (a) centre of mass and (b) maximum horizontal rooting width for all compaction treatments and genotypes. Error bars associated with histograms show double standard errors of the mean. Standard errors of the difference (SED) are shown for (1) bulk density and (2) genotype
128
8.8 X-ray µCT derived mean values for tortuosity of the root path for all compaction treatments and genotypes. Error bars associated with histograms show double standard errors of the mean. Standard errors of the difference (SED) are shown for (1) bulk density and (2) genotype
129
8.9
8.10
Examples of segmented individual root systems (black background) and their associated final destructive WinRHIZO® root image (white background) for all compaction treatments and genotypes. Scale bar indicates 1 cm
ABA concentrations measured in (a) shoots and (b) roots. Error bars associated with histograms show double standard errors of the mean. Standard errors of the difference (SED) are shown for (1) bulk density and (2) genotype.
130
131
Chapter 9
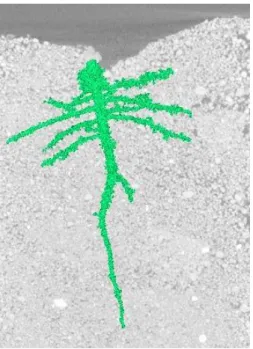
9.1 Segmented root system of a tomato plant growing in uncompacted (1.2 Mg m-3) loamy sand soil. Roots have been falsely coloured green for clarity.
146
Chapter 10
10.1 Example image of a scanned field core containing a wheat plant (20 cm height, 5 cm diameter)
1. Chapter 1
Paper as published in Journal of the Science of Food and Agriculture
Chapter 1 is the main introductory chapter and is a review paper published in the
Journal of the Science of Food and Agriculture (Tracy et al. 2011. 91, 1528–1537),
so is presented in „paper format‟. The paper reviews past and present techniques used to investigate soil compaction and the effect on root growth.
Author contribution
:Project supervision performed by CR Black, JA Roberts and SJ Mooney
2. Chapter 2
2.1 General Introduction
2.1.1 Summary of literature
The use of X-ray CT to examine undisturbed roots systems growing in soil was first
implemented over two decades ago. Watanabe et al. (1992) first employed this
approach to visualise the storage roots of Chinese Yam (Dioscorea oppositifolia L.)
at a resolution of 2 - 5 mm. The earliest studies were limited to visualising plant
species with coarse roots as the spatial resolution was not adequate to observe finer
roots. Grose et al. (1996) used a medical scanner but were unable to resolve roots of
wheat, cotton and radish <0.4 mm in diameter. Heeraman et al. (1997) undertook
consecutive scans and obtained 3-D images of intact root systems of bush bean
(Phaseolus vulgaris L.) using X-ray CT, although only to a depth of 0.8 cm. One of
the first experiments that used a micro-tomography system was reported by Jenneson
et al. (1999), who generated 3-D time-lapse images of growing roots of wheat
(Triticum aestivum L.) seedlings to determine root length and volume, while Gregory
et al. (2003) observed root growth for pre-germinated wheat and rape (Brassica
napus L.) seedlings transplanted into a sandy loam soil in 25 mm diameter plastic
containers with an image resolution of 100 µm. Kaestner et al. (2006) reconstructed
the fine roots of two alder (Alnus incana L.) plants using X-ray micro-tomography.
Similarly, Perret et al. (2007) used X-ray CT to visualise and quantify the roots of
chick pea (Cicer arietinum L.). This approach, also used by Hargreaves et al. (2009)
was able to measure root traits directly in barley (Hordeum vulgare ssp. vulgare and
spontaneum L.). X-ray CT can be used successfully to examine the root responses to
effect of interfaces between high and low bulk density soil horizons on root
architecture. Therefore, previously unanswerable questions regarding effects of the
3-D soil environment on root architecture over time can now be addressed following
the advent of X-ray CT scanning. The experiments reported in this thesis are some of
the first to focus directly on the response of root architecture to soil compaction
using X-ray CT.
2.1.2 Research aims and objectives
The overall aim was to investigate the response of root system architecture (RSA) to
soil compaction. The project utilised X-ray CT technology to obtain non-destructive
visualisations of roots growing in different soil textures at differing bulk densities
and used state-of-the-art image analysis software to quantify the response at the
micro-scale.
The overarching hypothesis is:
‘The response of root system architecture to increasing soil compaction is
determined by several soil physical characteristics, which can be visualised and
quantified using non-destructive imaging technology’
The initial objectives were to:
1. Produce a scanning protocol suitable for scanning columns of uncompacted
and compacted soil held at field capacity containing growing roots.
Once these objectives had been achieved, the following questions were addressed:
What is the response of roots to increasing soil bulk density and is this consistent for different soil types?
What are the effects of soil compaction on root elongation rate and does this change over time?
Is abscisic acid (ABA) able to mediate the response of the root systems to soil compaction?
Can automatic root tracking algorithms be successfully applied to the research carried out?
2.1.3 Thesis structure
This thesis is primarily composed of published papers in „paper format‟ and
submitted papers. Each paper that is included as an experimental chapter has all the
associated information relevant for that experiment. Chapter 1 is the main introductory chapter and is a review paper published in the Journal of the Science of
Food and Agriculture (Tracy et al. 2011. 91, 1528–1537), so is presented in „paper format‟. The paper reviews past and present techniques used to investigate soil compaction and the effect on root growth. Chapter 2 provides a short summary of the key literature related to the research conducted. The research aims and objectives are also presented. Chapter 3 offers a viewpoint of the use of X-ray CT to visualise undisturbed root architecture in soil. This has been published in the
Journal of Experimental Botany (Tracy et al. 2010. 61, 311-313), so is presented in „paper format‟. Chapter 4 is a general materials and method chapter and includes
experimental information and further analyses not presented elsewhere. Chapter 5 used X-ray CT to quantify the effect of soil compaction on three Australian wheat varieties. Results from the automatic root tracking algorithm RootViz3D® are also presented. This was published in Plant and Soil (Tracy et al. 2012. 353, 195–208),
so is presented in „paper format‟. Chapter 6 visualised root elongation and RSA development in tomato for a 10 day period following germination in response to soil compaction. Daily quantification of root growth was possible and novel image analysis measurements were made. This was published in Annals of Botany (Tracy et al. 2012. 110, 511 - 519), so is presented in „paper format‟. Chapter 7 investigated the effect of soil texture and bulk density in greater detail with the aim of determining typical responses of root architecture to incremental steps of increasing bulk density and through greater treatment replication. This paper is currently under review for publication. Chapter 8 investigated the role of ABA in mediating root responses to increasing soil compaction using ABA mutants with differing internally generated ABA concentrations. Chapter 9 provides a general discussion of the key results and findings. Chapter 10 draws together the key conclusions from each experimental chapter; a section on possible further work is included.
3. Chapter 3
Paper as published in Journal of Experimental Botany
Chapter 3 offers a viewpoint of the use of X-ray CT to visualise undisturbed root architecture in soil. This has been published in the Journal of Experimental Botany
(Tracy et al. 2010. 61, 311-313), so is presented in „paper format‟.
Author contribution:
Project supervision performed by CR Black, JA Roberts and SJ Mooney
General advice and draft editing performed by A McNeill and R Davidson, (University of Adelaide)
4. Chapter 4
4.1 General Materials and Methods
As stated in Chapter 2, this thesis is primarily made up of published papers in „paper
format‟ or submitted papers. Each paper that is included as an experimental chapter contains detailed information relevant for each experiment. Information presented
here comprises the part of the overall research that has not been presented elsewhere
in the thesis.
4.1.1 Soil types
In Chapter 5, a sandy loam soil (Prospect Hill, Adelaide, Australia, 34o 52‟ S, 138o 30‟ E, A1 horizon, FAO Class: Brown Chromosol) was air-dried and sieved to <2 mm. For the rest of the experimental work undertaken a Newport series loamy sand
(brown soil) and a Worcester series clay loam soil (argillic pelosol) from the
University of Nottingham farm at Bunny, Nottinghamshire, UK (52.52 ° N, 1.07 °
W) were air-dried and sieved to <2 mm for packing into the columns.
4.1.2 Soil column packing
After sieving the soil to < 2 mm and weighing out the correct mass of soil per
column to achieve the desired bulk density, the soil was swirled and poured in small
amounts into the column. The swirling action was to distribute the different sized
soil fractions evenly. After a small amount was poured in and compacted (if
method did not created any distinct layers columns were scanned in the X-ray CT
scanner to check for this. Figure 4.1 is an example image of a packed soil column; no
layering present and the different micro-scale soil fraction sizes are evenly
distributed throughout the column.
Figure. 4.1. Example image of a scanned loamy sand soil column at 33 µm.
4.2 Soil Chemical analysis
4.2.1 pH
A combined electrode was used to measure soil pH, which includes „reference‟ and pH-sensitive glass electrodes incorporated into a single electrode stick. The pH meter was
calibrated with pH 4.01 and pH 7.00 buffers using the „buffer‟ and „slope‟ controls. Approximately 5 g of air dried < 2 mm soil was measured into a centrifuge tube and
12.5 ml of de-ionised water was added. The tube was shaken for 30 min on an
end-over-end shaker to attain equilibrium. After rinsing with de-ionised water the tip of
pH reading to stabilise, the result was recorded. The average pH value of the clay
loam soil was 7.07 and the average pH value of the loamy sand was 7.13.
4.2.2 Nitrate
The amount of available nitrate in the soil was determined by mixing 10 g of air-dry
<2 mm soil with 50 ml 1 M KCl and shaking for one hour. Standards of known
nitrate concentration were prepared by appropriate dilutions of a standard stock
solution. After filtration, 20 ml of the extractant solution was placed in a universal
tube. Then, 3 ml ammonium chloride, 1 ml borax solution and 0.6 g of spongy
cadmium were added to the tube. The tube was then shaken for 20 min. Afterwards
7 ml of this solution was transferred to a 50 ml flask, to which 1 ml of
sulphanilamide solution was added and then gently swirled and allowed to stand for
5 min. Then 1 ml of N-1-napthylethylenediamine dihydrochloride was added and
the flask was made up to 50 ml using de-ionised water. The flask was left for 10 min
and the nitrate concentration measured from the absorbance of the solution on a
spectrophotometer, with the wavelength set to 543 nm. The average nitrate
concentration was 4.09 mg l-1 for the clay loam and 5.48 mg l-1 for the loamy sand.
4.2.3 Phosphorus
Extractable phosphorus concentrations of the soils were determined using the
Olsen-P method. In triplicate, approximately 2.0 g of each soil was weighed into a 50 ml
screw cap centrifuge tube and half teaspoonful of low phosphate charcoal was added.
For calibration standards, 0, 1, 2, 3, 4 and 5 ml of the working phosphate standard
(10 mg P l-1) was added to 50 ml flasks, to give a calibration range expressed as
„amount‟ of P: 200, 400, 600, 800 and 1000 µg\l-1
P. 4 ml of the acid molybdate
reagent (AMR) and 4 ml of the ascorbic acid solution were added before making the
solution up to 50 ml with deionised water. The colour was allowed to develop for 20
min before reading the standards at 880 nm in a 1 cm cell.
After centrifuging, a 5 ml aliquot of the supernatant was added to a 50 ml flask, 2 ml
3 M H2SO4 was added to neutralise NaHCO3. 4 ml of the AMR and 4 ml of the
ascorbic acid solution was added before making up with deionised water. The colour
was allowed to develop for 20 min before reading at 880 nm in a 1 cm cell after
zeroing the spectrophotometer on the zero P standard. Using Appendix 4 from the
DEFRA RB204 book of fertiliser recommendations, the phosphorus concentrations
could be given DEFRA indices to determine whether the soil was deficient or
surplus in those nutrients. For phosphorus concentrations the clay loam samples had
an average DEFRA index of 2 (15.75 mg kg-1), whereas the loamy sand samples had
an average DEFRA index of 3 (29.65 mg kg-1). The values obtained are typical of
British agricultural soils.
4.2.4 Potassium
The potassium concentration of the soils was determined by mixing 10 g of air-dry
<2 mm soil with 50 ml of 1 M ammonium nitrate and shaking for 30 min on a
mechanical shaker. The solution was then filtered and the samples prepared for
equipment. For potassium concentration, the clay loam samples had an average
DEFRA index of 1, whereas the loamy sand samples had a value of 0.
All of the soil chemical analysis data correlated well with the average values stated
on the NERC soil portal (http://www.bgs.ac.uk/nercsoilportal/).
4.3 Soil Hydraulic Properties
4.3.1 Water release curves
Using a combination of sand tables and pressure membrane apparatus, water release
curves were obtained for both soil types. All data were subsequently fitted to the
Van Genuchten-Mualem model using RETC software, (http://www.scisoftware.com/).
4.3.2 Sand Table
The sand table was prepared by filling the glass reservoir and rising above the base
height of the table to ensure full saturation of the sand table with no air bubbles. Soil
samples were prepared in cores packed to a bulk density of 1.2 Mg m-3 and placed
flat on the sand table. Once saturation of the samples was achieved (0 kPa), the
reservoir was lowered to the required pressure levels of -10 kPa, -30 kPa and -60
kPa. After equilibrating at each stage, the samples were weighed and then placed
back on the sand table surface, ensuring good contact. After the final weight
4.3.3 Pressure Membrane Apparatus
Using a blade, the pressure membranes were cut into the correct sizes and placed on
the plates, with the rubber „O‟ rings placed at the top and bottom of the container. The mass of soil was carefully placed into the container and saturated with air-free
water. The container was then sealed and bolted down to ensure a tight fit. Plastic
collection tubes were filled with approximately 1 ml of oil to prevent evaporation of
collected water. Individual tubes were then weighed and placed under the pressure
plate outlets. The nitrogen gas was turned on and the pressure set to the isolator. Gas
leakages were tested for using washing up liquid and observing bubbles; if any leaks
were detected the individual container was cleaned and re-packed with soil. Once no
gas leakages were present, the gas pressure was set to the lowest pressure of -200
kPa, collection tubes were weighed frequently and once equilibrated a higher
pressure was set. This was repeated for pressures of -600, -1000 and -1400 kPa.
After the final measurement, soil samples were oven dried at 105 ºC for 24 hr then
weighed.
The water release characteristic curves for both soil types are displayed in Figures
Figure.4.2. Water release curve of the clay loam and loamy sand soils of experimental values obtained
Figure.4.3. Water release curve of the clay loam and loamy sand soils of values fitted using the Van Genuchten-Mualem model
0 0.1 0.2 0.3 0.4 0.5 -1500 -1000 -500 0 V olu m etr ic w ate r c on te n t (c m 3 cm -3)
Matric potential (kPa) Clay loam Loamy sand
0 0.1 0.2 0.3 0.4 0.5 -1500 -1000 -500 0 V olu m etr ic w ate r c on te n t (c m 3 cm -3)
Matric potential (kPa) Clay loam Loamy sand
Acknowledgements
References
soil physical properties individually and at specific time points, as their importance
changes as the root system becomes established.
Keywords:Solanumlycopersicum; root system architecture; soil compaction; soil texture; X-ray micro-Computed Tomography (µCT); root washing
1.
Introduction
Soil compaction is an increase in the number of soil particles per unit volume,
leading to increasing bulk density and penetration resistance to growing roots and
reducing soil porosity (Batey and McKenzie, 2006). Pore size distribution is
significantly affected by compaction as the larger macropores in particular are
compressed, increasing the proportion of smaller pore sizes (Marshall and Holmes,
1988), thereby reducing the movement of water and air through the soil profile.
These major effects on soil physical properties can also inhibit root growth, reducing
the growth and yield of both annual and perennial species (Unger and Kaspar, 1994).
Yet, our understanding of root system development in heterogeneous soil remains
fragmented.
The relative proportions of sand, silt and clay particles, also known as soil texture,
has a major role in determining the extent to which specific soils become compacted
and the possible effects on root growth (Alameda and Villar, 2012). Soils with
different textures have provided contrasting results in previous studies; for example,
when the coarser grain particles in sandy soils are compacted they are often
positioned in rigid point-to-point contact, with the result that they cannot easily
move to accommodate growing roots (Batey and McKenzie, 2006). Soils composed
predominantly of finer particles such as clay and silt can pack more closely within a
defined volume, however a large overall volumes of pore space remains to allow
growing roots to extend more easily (White, 2006). This contrast in soil mechanics
recent studies of the effects of compaction have examined soils of differing texture
within the same experiment (Gregorich et al., 2011; Alameda and Villar, 2012; Chen
and Weil, 2012; Gao et al., 2012). Studies that consider a continuous range of bulk
densities may provide new information as most previous research has typically
considered only a discrete and widely spaced range of bulk densities. Some
researchers have noted a bell-shaped response of root growth to compaction, with
growth being reduced at the lowest and highest bulk densities (Arvidesson, 1999;
Alameda and Villar, 2009; Atkinson et al., 2009a). The observation that moderate
bulk densities (1.3 – 1.5 Mg m-3) enhance root growth is supported by other workers
(Bouwman and Arts 2000; Hamza and Anderson 2005; Tracy et al., 2012a) and this
effect is more pronounced in nutrient-rich loamy soils. Arvidsson (1999) attributed
this positive effect to a greater nutrient concentration per unit volume of soil and
suggested that improved root-soil contact enhances nutrient uptake, a view supported
by an increase in leaf N concentration in work by Alameda and Villar, (2009).
However, in sandy soils, increases in bulk density decrease root growth and alter
root morphology, possibly due to the absence of any increase in nutrient availability
following compaction due to nitrate leaching from the coarser-grained soils in high
precipitation areas (Lynch and Brown, 2012).
Bulk density varies within individual soil profiles due to the pressure exerted by
farm machinery, soil management practices, overburden pressure and biological
activity (Whalley et al., 1995); this heterogeneity and other environmental
constraints induce markedly different variations in root system architecture (RSA)
and Russell 1980; Bengough and Young, 1993; Bengough et al., 1994). Roots
grown in compacted soil exhibit a more tortuous root path (Konôpka et al., 2009;
Tracy et al., 2012b) and branching may differ from the usual herringbone pattern
(Becel et al., 2012). The increased forces imposed on root systems growing in
compacted soil reduces the size and increases the irregularity of root distribution,
resulting in a smaller volume of soil being exploited (Grzesiak et al., 2012),
requiring water and nutrients to travel greater distances to reach the nearest root
(Tardieu, 1994).
Phenotypying protocols are required to understand the „root phenes‟ controlling RSA, which are related to resource uptake (Lynch and Brown, 2012). Several
techniques can be employed when measuring roots (Mancuso, 2012); the two main
techniques employed in the present study were root washing followed by
WinRHIZO® scanning, which has the advantage of being rapid so numerous samples
can be analysed, and X-ray micro-Computed Tomography (µCT), which provides
repeated, non-destructive three-dimensional (3-D) images of RSA in situ (Mooney et
al., 2012), albeit with a reduced sample throughput. The aim of this study was to
explore the response of root systems to differences in soil type and bulk density and
the effect of their interaction. The objectives were to: (1) test the hypothesis that
intermediate bulk densities are optimum for root growth; (2) dissect the influence of
bulk density at different soil textures on root growth and function; and (3) visualise
and quantify root elongation in soil containing layered bulk density treatments to
gain a greater understanding of root behaviour at bulk density boundaries mimicking
2.
Materials and methods
2.1 Sample preparation
Soil was obtained from the University of Nottingham experimental farm at Bunny,
Nottinghamshire, UK (52.52 ° N, 1.07 ° W). A Newport series loamy sand (brown
soil) and a Worcester series clay loam (argillic pelosol) were air-dried and sieved to
<2 mm. Soil was packed to various bulk densities (listed below) into plastic
columns (70 mm height x 30 mm diameter).
Destructive root architecture experiment: Columns were uniformly packed to
provide bulk densities of 1.2, 1.3, 1.4, 1.5 and 1.6 Mg m-3 with 12 replicates per
treatment for both soil types, giving a total of 120 columns. The columns were
packed with air-dry soil in c. 1 cm deep layers. After compacting each layer, the
surface was lightly scarified to ensure homogeneous packing and hydraulic
continuity within the column (Lewis and Sjöstrom, 2010).
X-ray Computed Tomography (CT) boundary experiment: Columns were packed to
provide a compacted layer (1.6 Mg m-3) over an uncompacted layer (1.2 Mg m-3)
(C/UC) or an uncompacted layer (1.2 Mg m-3) over a compacted layer (1.6 Mg m-3)
(UC/C), with three replicates of each treatment, giving a total of 12 columns. To
achieve the treatment that had a compacted layer over an uncompacted layer (C/UC),
so that the compacted layer was at the top of the column. Two glass beads were
placed either side of the column as reference objects for use during image analysis.
After preparation, all columns in both experiments were wetted thoroughly and
placed in a growth room with day/night temperatures of 28/22 °C and a 12 h
photoperiod; PPFD was 226 µm m-2 s-1. Seeds of tomato (Solanum lycopersicum. L)
cv. Ailsa Craig were imbibed for 48 h before being planted 5 mm below the soil
surface. The columns were initially kept inside a transparent propagator to maintain
high humidity and were weighed daily and sufficient water added to ensure soil
moisture content remained near field capacity throughout the experiment.
2.2 Root scanning and image analysis
Destructive root architecture experiment: Roots were washed from the soil and
analysed three days after transplanting (DAT) and at 10 DAT; six replicates per
treatment were analysed on both dates. The washed roots were analysed using
WinRHIZO® 2002c scanning equipment and software to determine root volume,
surface area, length and diameter. Plant dry weight was measured as described by
Rowell (1996) after being dried at 100 °C for 40 h.
X-ray CT Boundary experiment: Columns were scanned daily for 10 DAT using a
Phoenix Nanotom® (GEMeasurement & Control Solutions) X-ray µ-CT scanner set
at 110 kV and 180 µA, with a 0.1 mm copper filter and an image averaging of 1.
Pixel/voxel resolution was 24 µm and each scan took 20 min to complete. The total
was 1200 with a file size of c. 15 GB. The columns were positioned so that scanning
occurred just below the seed to ensure the primary roots were sampled. The columns
were initially scanned in a randomised order during the photoperiod; scan order and
the timing of each scan were subsequently kept constant so that the columns were
scanned at 24 h intervals to ensure all treatment combinations were equally exposed
to any diurnal variation in root growth and avoid systematic error.
Root systems were non-destructively extracted by segmentation from the greyscale
µCT images using the Region Growing selection tool in VG StudioMAX® 2.1
software. The root system models segmented from the µCT image data were used
for quantitative determination of root length, volume, surface area, mean diameter
and maximum rooting depth. Root length was expressed in two ways, vertical length
(i.e. maximum rooting depth) and primary root length determined using the Polyline
tool in VGStudioMAX® 2.1. Tortuosity of the root path (the ratio of actual path
length compared to the shortest possible path) was measured by comparing the
length of the primary root to the vertical depth of the root system. The elongation
rate of the primary root was recorded daily.
2.3 Statistical analysis
The results were analysed by three-way general analysis of variance (ANOVA)
containing soil type, bulk density, time and all possible interactions as explanatory
variables using Genstat 13.1. Each column was analysed individually, with
the analysis; significant treatment*linear interactions indicate that the specific root
characteristic being analysed differed among treatments. This approach facilitated
the testing of whether the linear component of changes with time differed between
treatments to a greater extent than expected from the residual variation, instead of
simply considering the overall effect of time. Normality was tested by interpreting
the plots of residuals and homogeneity of variance (homoscedasticity) by assessing
the plot of residuals against fitted values. In each case, the data were distributed
3.
Results
Destructive root architecture experiment: The effect of soil type and bulk density on
root volume differed between treatments as values were greatest at high bulk density
in the clay loam but decreased with increasing bulk density in the loamy sand,
particularly at 10 DAT (Fig. 1A, B; P<0.001). The bulk density*soil type interaction
was significant for both time points because root volume differed between soil types
(Fig. 1A, B; P<0.001); mean root volume for both time points was substantially
greater in the clay loam than in the loamy sand (101 vs. 44 mm3). At 10 DAT, root
volumes were greater in the clay loam in the 1.4, 1.5 and 1.6 Mg m-3 treatments
(P<0.001). At 3 DAT, mean values for the loamy sand and clay loam soils were 16
and 21 mm3 respectively (Fig. 1A) compared to 73 and 179 mm3 at 10 DAT (Fig.
1B). Root volumes in the clay loam soil were greatest at the two highest bulk
densities, 46 and 30 mm3 respectively in the 1.5 and 1.6 Mg m-3 treatments at 3 DAT
(Fig. 1A) and 227 and 276 mm3 at 10 DAT (Fig. 1B). The effect of bulk density on
root volume was significant at 3 DAT (P<0.001) but not at 10 DAT. This pattern
was seen for several rooting characteristics, as described below. At 3 DAT, mean
root volumes in clay loam were 12, 11, 8, 46 and 30 mm3 at 1.2, 1.3, 1.4, 1.5 and 1.6
Mg m-3 respectively compared to 14, 24, 12, 19 and 11 mm3 respectively in the
loamy sand. The bulk density*soil type*time interaction was significant (P<0.001),
highlighting the changes in the influence of bulk density and soil type between 3 and
Unsurprisingly, the patterns for root surface area (Figs. 1C, D) closely matched those
for root volume as the effect of bulk density was significant at 3 DAT (P<0.001) but
not at 10 DAT. At 3 DAT, mean surface area in the clay loam was 97, 97, 77, 277
and 209 mm2 at bulk densities of 1.2, 1.3, 1.4, 1.5 and 1.6 Mg m-3 respectively
compared to 104, 161, 150, 137 and 107 mm2 in the loamy sand. Root surface area
was greatest at the higher bulk densities in the clay loam but no trend was apparent
for the loamy sand, although the values tended to be greatest at intermediate bulk
densities (1.3 and 1.4 Mg m-3). Surface area was greater in the clay loam than in the
loamy sand at 10 DAT (P<0.001), but not at 3 DAT. Mean values were respectively
151 and 132 mm2 for the clay loam and loamy sand at 3 DAT compared to 768 and
345 mm2 respectively at 10 DAT. The bulk density*soil type interaction was
significant at both time points (P<0.001) due to the different responses to bulk
density shown by roots grown in the different soil types. The bulk density*soil
type*time interaction was also significant (P<0.01), again emphasising the differing
interactions between bulk density and soil type at 3 and 10 DAT.
The impact of bulk density on root diameter was significant at 3 DAT (Figs. 1E, F;
P<0.001) but not at 10 DAT. Root diameter increased slightly with increasing
compaction, although this response was more pronounced in the clay loam, although
the mean values were reduced at 1.4 Mg m-3. At 3 DAT, mean root diameter in the
clay loam was 0.48, 0.43, 0.42, 0.67 and 0.59 mm at 1.2, 1.3, 1.4, 1.5 and 1.6 Mg m-3
respectively, compared to 0.52, 0.57, 0.32, 0.54 and 0.42 mm2 respectively in the
loamy sand. Mean root diameters were 0.52 and 0.48 mm in the clay loam and
loamy sand at 3 DAT, compared to 0.87 and 0.82 mm at 10 DAT. The bulk
a uniform response across all treatment combinations. Figure 2 clearly illustrates the
influence of bulk density on root diameter as the primary root became progressively
thicker as bulk density increased, particularly in the loamy sand (Fig. 2B). Other
deleterious effects of increasing bulk density included reductions in the number and
length of lateral roots, inducing poorer root architectures. The detrimental response
to increasing bulk density was more apparent in the loamy sand, in which mean
particle size was greater.
The influence of bulk density on the total root system length was significant at 3
DAT (Fig. 3A; P<0.001) but not at 10 DAT. The mean values at 3 DAT were 6, 7,
6, 13 and 12 cm at 1.2, 1.3, 1.4, 1.5 and 1.6 Mg m-3 respectively in the clay loam,
compared to 6, 9, 15, 8 and 8 cm respectively in the sandy loam. The difference in
total root length between soil types at the higher bulk densities was much greater at
10 DAT than at 3 DAT (Fig. 3A). The influence of soil type on total root length was
significant at day 10 DAT (P<0.001) but not at 3 DAT. Total root length was greater
in the clay loam than in the loamy sand for all bulk densities at 10 DAT, when the
mean values for the former were 29, 21, 27, 31 and 31 cm at 1.2, 1.3, 1.4, 1.5 and 1.6
Mg m-3 respectively, whereas the corresponding values for the loamy sand were 16,
19, 15, 12 and 8 cm respectively. The bulk density*soil type interaction was
significant (P<0.001) as total root length did not show a uniform response to bulk
density in both soil types.
The response of bulk density on root dry weight was significant at 3 DAT (Fig. 3C;
respectively compared to 0.0011, 0.0038, 0.0012, 0.0032 and 0.0010 g respectively
in the loamy sand. At both time points, root dry weight in the clay loam was greatest
at 1.5 and 1.6 Mg m-3 (Figs. 3C, D). At 10 DAT, root dry weight increased with
bulk density in the clay loam, but decreased slightly with increasing bulk density in
the loamy sand (Fig. 3C). The effect of soil type was significant (Fig. 3D; P<0.001)
at 10 DAT but not at 3 DAT. The mean value for all bulk densities was slightly
greater in the clay loam than in the loamy sand at both time points (0.0041 vs. 0.0021
g at 3 DAT and 0.0103 vs. 0.0031 g at 10 DAT (P<0.001). The soil type*bulk
density interaction was significant (Figs. 3C, 3D; P<0.001) as root dry weight
responded differently to increasing bulk density in the two soil types.
The effect of bulk density on shoot height was significant at 3 DAT (Fig. 4A;
P<0.001) but not at 10 DAT. At 3 DAT, mean shoot heights in the clay loam were
25, 23, 18, 34 and 31 mm at 1.2, 1.3, 1.4, 1.5 and 1.6 Mg m-3 respectively; the
corresponding values for loamy sand soil were 30, 35, 17, 28 and 24 cm respectively.
At 3 DAT, shoot height was greatest at the highest bulk densities (1.5 and 1.6 Mg m
-3
) in the clay loam, but was greatest in the lowest bulk densities (1.2 and 1.3 Mg m-3)
in the loamy sand (Fig. 4A). However, by 10 DAT, shoot height in the loamy sand
was greatest at intermediate bulk densities (1.3 and 1.4 Mg m-3). The influence of
soil type on shoot height was significant at 10 DAT (Fig. 4B; P<0.001), but not at 3
DAT, the opposite of the effect found for bulk density. Mean values for all bulk
densities were slightly higher for the loamy sand i.e. 27 vs. 26 mm for the clay loam
at 3 DAT and 46 vs. 39 mm at 10 DAT (P<0.01). The soil type*bulk density
interaction was significant (Figs. 4A, B; P<0.001), as the effect of both factors was
The effect of bulk density on shoot dry weight was significant at both time points
(Figs. 4C, 4D; P<0.001). At 3 DAT, mean shoot dry weight in the clay loam was
0.0019, 0.0011, 0.0016, 0.0029 and 0.0032 g at 1.2, 1.3, 1.4, 1.5 and 1.6 Mg m-3
respectively compared to 0.0083, 0.0071, 0.0079, 0.0099 and 0.0118 g at 10 DAT.
For the loamy sand, mean shoot dry weights were 0.0024, 0.0027, 0.0012, 0.0020
and 0.0016 g at 1.2, 1.3, 1.4, 1.5 and 1.6 Mg m-3 respectively at 3 DAT, compared to
0.0113, 0.0077, 0.0053, 0.0050 and 0.0038 g respectively at 10 DAT. The response
of shoot dry weight to soil type was not significant at 3 DAT but was at 10 DAT
(Fig. 4D; P<0.001); mean values for all bulk densities were slightly greater in the
clay loam at both time points. Mean shoot dry weight for all bulk densities did not
differ between the clay loam and the loamy sand at 3 DAT, but differed significantly
at 10 DAT (0.0090 vs. 0.0066 g respectively; P<0.001). The soil type*bulk density
interaction was again significant (Figs. 4C, D; P<0.001) as the effects of both
variables differed between time points.
X-ray CT Boundary experiment: Surprisingly, root volume was not significantly
affected by compaction treatment but was affected by soil type, being greater in the
loamy sand after day 8 (Fig. 5A; P<0.05). In the C/UC treatment, mean root volume
for all time periods was 21 mm3 in the clay loam compared to 23 mm3 in loamy sand
(Fig. 5A; P<0.05); the corresponding values for the UC/C treatment were 18 vs. 20
mm3 (Fig. 5A; P<0.05). Although the effects of compaction treatment on root
volume were not significant, in 80% (16/ 20) instances root volume was greater in
values for root volume increased. As expected, the influence of time on all root
characteristics examined was significant (P<0.001).
No significant effects or interactions were detected for root surface area (Fig. 5B),
apart from the influence of time (P<0.001). Again, this may be explained by the
large error bars, as 75% (15/ 20) of the root surface area values were greater in the
C/UC treatment (Fig. 5B). Maximum root depth showed no detectable treatment
effects, although the interactions between soil type*bulk density and soil type*bulk
density*time were significant (Fig. 5C; P<0.05 and P<0.01 respectively). Plants
grown in the C/UC treatment of clay loam achieved the deepest rooting depths from
4 DAT (Fig. 5C), and 80% of the values were greater in C/UC treatment of the clay
loam. Plants grown in the UC/C treatment of the loamy sand subsequently achieved
greater root depths, with 90% of the values being greater than in the C/UC treatment
(Fig. 5C). In the C/UC treatment, mean root depth for all time intervals was 25 mm
in clay loam vs. 19 mm3 in the loamy sand (Fig. 5C); the corresponding values for
the UC/C treatment were 20 vs. 23 mm3. No detectable treatment effects were found
for primary root length but the soil type*bulk density and soil type*bulk
density*time interactions were significant (Fig. 6A; P<0.01 and P<0.001). Primary
root length was greatest in the C/UC treatment of the clay loam (Fig. 6A) and in the
UC/C treatment of the loamy sand. Mean primary root length for all time periods
was 37 mm in the C/UC treatment of the clay loam, compared to 26 mm3 in loamy
sand (Fig. 6A); the corresponding values for the UC/C treatment were 26 vs. 28