Seton Hall University
eRepository @ Seton Hall
Seton Hall University Dissertations and Theses(ETDs) Seton Hall University Dissertations and Theses
Spring 3-19-2019
The Predictive Power of Teacher Practice in
Explaining Student Growth
Nick Pillsbury
Follow this and additional works at:https://scholarship.shu.edu/dissertations
Part of theEducational Assessment, Evaluation, and Research Commons, and theEducational Leadership Commons
Recommended Citation
Pillsbury, Nick, "The Predictive Power of Teacher Practice in Explaining Student Growth" (2019).Seton Hall University Dissertations and Theses (ETDs). 2651.
The Predictive Power of Teacher Practice in Explaining Student Growth by
Nick Pillsbury
Submitted in Partial Fulfillment of the Requirements for the degree of Doctor of Education
Department of Education, Management, Leadership and Policy Seton Hall University
iv
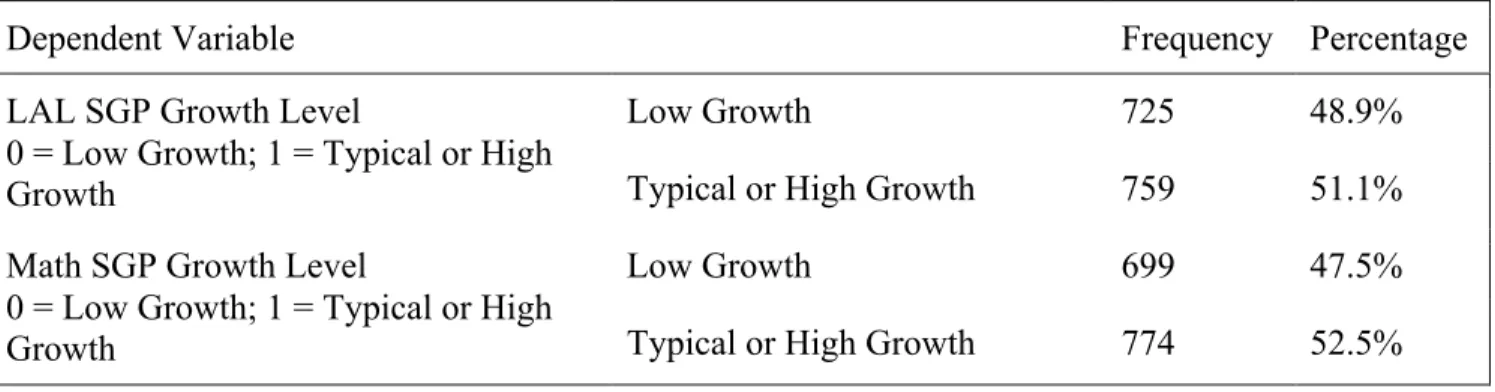
The purpose of this quantitative study was to examine the relationship between teacher practice and student growth. The study determined the probability that a student will have typical or high growth on the state assessment in relation to the teacher’s practice score based on
classroom observations. Some of the essential questions regarding this research are as follows: a) Are teacher-level variables such as gender, ethnic background, and age significant predictors of student growth? b) Are school-level variables such as school performance status (Comprehensive schools, Target schools, and NonStatus schools) and percent of student subgroup ethnic
composition significant predictors of student growth? c) How is student growth in language arts and mathematics impacted by a teacher’s effectiveness as the practice score measures it when one controls for teacher- and school-level characteristics? and d) To what extent does the relationship between teacher effectiveness and student outcome vary from year 2 of AchieveNJ to year 5 of AchieveNJ?
The sample population for the 2014-2015 school year will consist of 1,132 students (n = 1,132) with a valid language arts SGP and 1,087 students (n = 1087) with a valid mathematics
ABSTRACT
In recent years, states across the nation have increased their interest in developing specific teacher accountability measures and improving student achievement. On August 6, 2012, the state of New Jersey approved the TEACHNJ Act, which reformed tenure laws and linked student growth to a teacher’s evaluation. The ultimate goal of the TEACHNJ Act is to “raise student achievement by improving instruction through the adoption of evaluations that provide specific feedback to educators” (TEACHNJ Guide, 2012). The 2013-14 school year was the first full year of implementation and included student growth percentile (SGP) scores as one component of a teacher’s evaluation.
v
SGP. The sample population for the 2017-2018 school year consisted of 1,484 students (n = 1,484) with a valid language arts SGP and 1,473 students (n = 1,473) with a valid mathematics SGP. The study involved 12 to 14 schools with different grade configurations, performance status, and student ethnic composition.
This study was a cross-sectional explanatory design in which logistic and hierarchical logistic regression methods were used to test the relationships between the dependent variable (student growth) and independent variables (teacher characteristics, school characteristics, and teacher practice). The design consisted of three separate models used to answer four research questions. A logistic regression analysis will be used to analyze Model 1 (teacher characteristics on student growth) and Model 2 (school characteristics on student growth). In Model 3, a
hierarchical logistic regression analysis was used to better interpret the impact of teacher practice and teacher and school characteristics on student growth. Research question four compared and analyzed the significant findings between Model 3 in the 2014-2015 school year and Model 3 in the 2017-2018 school year.
This study will provide insight for educational leaders and policymakers on the positive relationship between teacher practice and student growth. It also recommends that this type of research continue to explore how other variables influence student learning growth based on how teachers deliver instruction.
vi DEDICATION
Most importantly, this work is dedicated to my wife, Ashley Pillsbury, who has sacrificed an exorbitant amount of her time throughout this process. It is through your encouragement, support, and selflessness that I was able to complete this endeavor.
Second, I dedicate this work to my children, Grayson and Sutton, who were an
inspiration to me during this experience and were one of the main reasons I took on this venture to instill in them that education is a powerful tool, and never to give up on a goal.
vii
ACKNOWLEDGEMENTS
I especially acknowledge my mentor, Dr. Elaine Walker, for your knowledge, guidance, and commitment to my work throughout this lengthy process. You encouraged and motivated me to complete this work, and for that I am truly grateful. A special thanks to my committee
members, Dr. Martin Finkelstein and Dr. Peter Mazzagatti, for your knowledge, contribution, and interest in my work.
I would like to acknowledge my Seton Hall Ed.S. – Ed.D. Cohort III members who began this process with me, especially Kevin Jarido, who started at the very beginning with me in the Seton Hall Education Leadership, Management, and Policy Camden Cohort II. Thank you all for your support, knowledge, and enjoyment throughout this process.
viii
TABLE OF CONTENTS
ABSTRACT ... iv
DEDICATION ... vi
ACKNOWLEDGEMENTS ... vii
TABLE OF CONTENTS ... viii
LIST OF TABLES ... xi
I. INTRODUCTION ... 1
Policy Background ... 1
Statement of the Problem ... 8
Purpose of the Study ... 9
Research Questions ... 10
Significance of the Study ... 10
Theoretical Framework ... 12
Limitations of the Study ... 13
Delimitations of the Study ... 13
Definitions of Terms ... 14
II. LITERATURE REVIEW ... 16
Overview ... 16
Teacher Effectiveness and Student Achievement ... 16
Value-Added Models ... 20
ix
Teacher Characteristics and the Impact on Student Achievement ... 28
School Characteristics and the Impact on Student Achievement ... 30
Summary ... 31
III. RESEARCH METHODOLOGY ... 34
Introduction ... 34
Methods ... 35
Design ... 36
Participants ... 36
Setting ... 38
Instrumentation and Variables ... 39
Student Growth Percentile (SGP) Scores ... 42
Teacher Characteristics ... 43
School Characteristics ... 43
Teacher Evaluation Practice Score ... 44
Procedures ... 45
Data Analysis ... 45
IV. RESEARCH FINDINGS ... 49
Introduction ... 49
Participant Demographics ... 50
Findings Model 1 ... 58
Findings 2014-15 ... 59
x Findings Model 2 ... 63 Findings 2014-15 ... 64 Findings 2017-18 ... 66 Findings Model 3 ... 67 Findings 2014-15 ... 68 Findings 2017-18 ... 71 Findings Question 4 ... 74
Summary of Quantitative Findings ... 77
V. SUMMARY, RECOMMENDATIONS, AND CONCLUSIONS ... 79
Recommendations for Future Research ... 85
Conclusion ... 86
REFERENCES ... 88
xi
LIST OF TABLES
Table Page
1. New Jersey Teacher Evaluation Framework ... 5
2. Grade Configurations of Schools with Grades 4, 5, 6, and/or 7 ... 36
3. Instrumentation and Variables ... 44
4. 2014-2015 Teacher Characteristics: Gender, Ethnicity ... 51
5. 2014-2015 Teacher Characteristics: Age ... 52
6. 2017-2018 Teacher Characteristics: Gender, Ethnicity ... 53
7. 2017-2018 Teacher Characteristics: Age ... 53
8. 2014-2015 School Characteristics: School Performance Designation, Student Ethnicity ... 54
9. 2017-2018 School Characteristics: School Performance Designation, Student Ethnicity ... 55
10. 2014-2015 Teacher Evaluation Rating: Student Growth Percentile (SGP) ... 56
11. 2014-2015 Teacher Evaluation Rating: Teacher Practice ... 56
12. 2017-2018 Teacher Evaluation Rating: Student Growth Percentile (SGP) ... 57
13. 2017-2018 Teacher Evaluation Rating: Teacher Practice ... 58
14. 2014-2015 Model 1 Hosmer and Lemeshow Test ... 60
15. 2014-2015 Model 1 Model Summary ... 60
16. 2014-2015 Variables in the Equation: Impact of Teacher Characteristics on Student Growth ... 60
17. 2017-2018 Model 1 Hosmer and Lemeshow Test ... 62
xii
19. 2017-2018 Variables in the Equation: Impact of Teacher Characteristics
on Student Growth ... 63
20. 2014-2015 Model 2 Hosmer and Lemeshow Test ... 65
21. 2014-2015 Model 2 Model Summary ... 66
22. 2014-2015 Variables in the Equation: Impact of Teacher Characteristics on Student Growth ... 66
23. 2017-2018 Model 2 Hosmer and Lemeshow Test ... 67
24. 2017-2018 Model 2 Model Summary ... 67
25. 2014-2015 Model 3 Hosmer and Lemeshow Test ... 70
26. 2014-2015 Model 3 Model Summary ... 70
27. 2014-2015 Variables in the Equation: Impact of Teacher Characteristics on Student Growth ... 71
28. 2017-2018 Model 3 Hosmer and Lemeshow Test ... 72
29. 2017-2018 Model 3 Model Summary ... 73
30. 2017-2018 Variables in the Equation: Impact of Teacher Characteristics on LAL Student Growth ... 73
31. 2017-2018 Variables in the Equation: Impact of Teacher Characteristics on Math Student Growth ... 74
32. Logistic Regression of theImpact of Teacher Practice on Student Growth ... 75
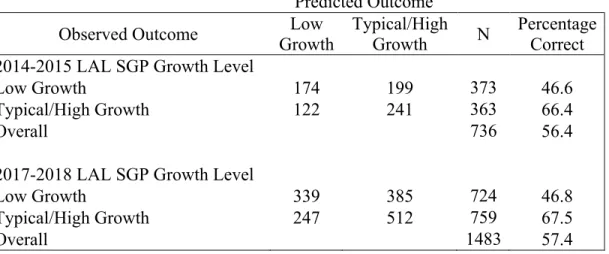
33. Classification Table of Predicted vs. Observed Outcomes of the Logistic Regression Model for Student Growth in Language Arts ... 76
34. Classification Table of Predicted vs. Observed Outcomes of the Logistic Regression Model for Student Growth in Mathematics ... 77
1
CHAPTER I INTRODUCTION Policy Background
Teacher evaluation is not a new concept. Even over 30 years ago, a great deal of national attention focused on setting well-designed evaluation processes to identify and promote highly effective teaching. In 1983, when the National Commission on Excellence in Education
published A Nation at Risk: The Imperative for Educational Reform, it created a new interest in teacher evaluation processes. The commission recommended, “Persons preparing to teach should be required to meet high educational standards, to demonstrate an aptitude for teaching, and to demonstrate competence in an academic discipline...Salary, promotion, tenure, and retention decisions should be tied to an effective evaluation system that includes peer review so that superior teachers can be rewarded, average ones encouraged, and poor ones either improved or terminated” (Wise, 1984, pg. 18).
Wise (1984) broke down the concept of teacher evaluations into four basic purposes: individual staff development, school improvement, individual personnel decisions, and school status decisions. The first two purposes take a formative approach and involve improving practice; the second two purposes take a summative approach and focus on accountability to measure teacher effectiveness. Although many teacher evaluation systems seek to accomplish all four of these purposes, different processes and methods may better suit individual objectives. In particular, an evaluation system that focuses on improvement or accountability requires different standards of acceptability.
Wise (1984) explained that evaluation systems that focus on accountability must be capable of yielding standardized and objective evidence about a teacher’s performance. For
2
teacher evaluation systems that focus on improvement, more emphasis must be placed on descriptive information that identifies areas for growth and produces a course for change. According to the researcher, the improvement of a teacher relies mostly on the success of two conditions. One is for both the teacher and supervisor to have crafted a course of action that they both agree is the correct one to produce improved practice. The other condition necessary for teachers to improve their practice is for them to feel empowered and confident that the given course is possible to achieve.
Although the importance of teacher effectiveness has been discussed and debated for many years, it was in the turn of the 21st century, with the No Child Left Behind Act (NCLB),
when the federal government stepped up and applied a significant amount of pressure on states to improve student proficiency and close the achievement gap. NCLB is the most recent update to the Elementary and Secondary Education Act (ESEA) of 1965, which was the birth of Title I and provided supplemental funding to school districts with a greater number of disadvantaged
students (Editorial Project in Education Research Center, 2015). NCLB held schools responsible for the academic progress of each student. By the 2013-2014 school year, every student had to reach a “proficiency level” that the state set. In order to track progress toward the end goal, schools were required to make “adequate yearly progress,” or AYP. There were several
consequences if a school did not meet that mark every year, which included allowing students to transfer to better performing schools in the same district, offering free tutoring, and facing state intervention. Schools that failed to achieve the required level of academic proficiency would also risk losing their Title I funds (Editorial Project in Education Research Center, 2015). All of these factors put a significant amount of pressure on school districts with the lowest levels of
3
By 2010, 38% of schools were not meeting AYP, and it was clear that many of these schools would not be able to reach the achievement targets that the NCLB set (Editorial Project in Education Research Center, 2015). During that year the Obama administration offered several waivers to schools that were not going to meet NCLB target. However, states with schools that were awarded this waiver “had to agree to set standards aimed at preparing students for higher education and the workforce” (p. 5). Some states chose to adopt the Common Core State
Standards, but others set standards that higher education institutions within their state approved. Another requirement was for these states to establish and implement teacher evaluation systems that used student progress on standardized tests as a measurement for teacher effectiveness.
One year prior, in 2009, President Obama had signed the American Recovery and Reinvestment Act (ARRA), which was designed to support job creation and invest in critical sectors such as the education department (U.S. Department of Education, 2009). From this act, the Race to the Top Fund was born. Race to the Top is a grant program that awarded states for creating innovative education reform that could demonstrate the ability to make significant growth in student outcomes by closing the achievement gap. For a state to be awarded this grant, they had to have met six general criteria. The criterion that was emphasized the most, and
awarded the most points, was “Great Teacher and Leaders.” States must show how they would improve teacher and principal effectiveness based on performance.
The state of New Jersey was one of the states awarded this grant and began the work to improve educator evaluations to increase teacher and leader effectiveness. To create an effective evaluation system, the New Jersey Department of Education established an Educator
Effectiveness Task Force to identify what an effective evaluation system should look like. In 2011, the Task Force released a report that outlined steps for executing an improved evaluation
4
system for teachers and principals. One of those steps was to pilot the new evaluation procedures for 2 years and include more than 15,000 teachers and principals (New Jersey Educator
Effectiveness Task Force, 2011).
In 2012, New Jersey’s State Legislature unanimously approved the TEACHNJ Act, which set mandates for the new educator evaluation system and made significant changes to tenure decisions. Teacher and principals would now have their tenure determined by their evaluation rating.
The law declared:
The New Jersey Supreme Court has found that a multitude of factors play a vital role in the quality of a child’s education, including effectiveness in teaching methods and evaluations. Changing the current evaluation system to focus on improved student outcomes, including objective measures of student growth, is critical to improving teacher effectiveness, raising student achievement, and meeting the objectives of the federal “No Child Left Behind Act of 2001” (Teacher Effectiveness and Accountability for the Children of New Jersey [TEACHNJ] Act, Chapter 26, 2, 2012, p. 1). The ultimate goal of the TEACHNJ Act is to “raise student achievement by improving instruction through the adoption of evaluations that provide specific feedback to educators, inform the provision of aligned professional development, and inform personnel decisions” (Teacher Effectiveness and Accountability for the Children of New Jersey (TEACHNJ) Act, Chapter 26, 2, 2012, p. 1). New Jersey implemented its 1st year of the new evaluation policies for
5
These new evaluation policies were a major shift from prior evaluation procedures. The policies eliminated the binary method of evaluation (i.e., satisfactory vs. unsatisfactory), which did not take into account student growth. The new system, however, now incorporates student growth along with a teacher’s practice to produce an overall performance score that reflects one of four different teacher rating categories (highly effective, effective, partially effective, and ineffective). Prior to the new law, tenured teachers might have only received one observation for the entire year. TEACHNJ requires multiple observations for all teachers. Table 1 provides an overview of the evaluation process prior to and after the implementation of the new law. Table 1
New Jersey Teacher Evaluation Framework
Teacher Evaluation Prior to AchieveNJ (Past)
Teacher Evaluation–AchieveNJ (Present)
Binary measurement with limited ability to differentiate effectiveness and inform growth
Four-tiered measurement to differentiate levels of effectiveness and inform growth Evaluation based solely on single measure
(teacher practice)
Evaluation based on multiple measures (teacher practice and student achievement) Multiple observations (3) required for non-
tenured teachers
Multiple observations required for all teachers
Ongoing calibration and monitoring of observations
(Adapted from “Teacher Effectiveness and Accountability for the Children of New Jersey (TEACHNJ) Guide,” 2014, p. 3).
Before the TEACHNJ Act, districts had the discretion to use their own methods to assess teacher practice, which might be through a district-designed practice rubric or as simple as a checklist. Currently, districts must select from a list of state-approved teacher practice evaluation instruments in accordance with the TEACHNJ Act. The teacher practice evaluation instrument assesses the competencies of a teacher’s practice by gathering evidence, primarily through classroom observations. These state-approved instruments include Charlotte Danielson
6
Framework for Teaching, Marzano’s Causal Teacher Evaluation Model, Mid-Continent
Research for Education and Learning (McREL) Teacher Evaluation Standards, and Focal Point Teaching Practice Model. School districts can change or revise their selected teacher practice evaluation instrument each year but must follow specific state guidelines to do so. At the time of this study, AchieveNJ requires tenured teachers to be observed two times annually. Nontenured teachers are to be observed three times annually. In addition, more than one certified
administrator (multiple observers) are required to observe nontenured teachers and teachers placed on a corrective action plan. Teachers are automatically placed on a corrective action plan when they are rated ineffective or partially effective on their summative evaluation. As per New Jersey state statute:
For each teaching staff member rated ineffective or partially effective on the annual summative evaluation, as measured by the evaluation rubrics, a corrective action plan shall be developed by the teaching staff member and the teaching staff member’s designated supervisor. If the teaching staff member does not agree with the corrective action plan’s content, the designated supervisor shall make the final determination (Educators Effectiveness, 2012, p. 25).
In addition to the teacher’s practice evaluation score, student achievement measures are calculated and incorporated into a teacher’s summative evaluation. Student achievement
measures consist of student growth percentiles (SGPs) and/or student growth objectives (SGOs). SGPs measure student achievement gains in grades 4–8 in language arts and in grades 4–7 in mathematics (tested grades and subjects) on the Partnership for Assessment of Readiness for College and Careers (PARCC) state assessment, which was adopted and administered to all
7
students in New Jersey in the spring of 2014. An SGP score is a number on a scale from 1 to 99 that measures the change in a student’s achievement from one year to the next compared to all other students, or “academic peers,” in the state who had similar historical results (New Jersey Department of Education, 2015). A student’s SGP growth can be categorized as low (SGP < 35), typical (SGP > 34 and SGP < 66), or high (SGP > 65; NJ SMART Education Data System, 2016). Teacher’s evaluations reflect the median student growth percentile (mSGP) of all the students in their class. Students below grade level with a low proficiency rate could earn a high SGP score, which means that these students demonstrated more growth than their “academic peers” and signals that the teacher’s instructional practice may have assisted the students’ growth.
During both the 2014–2015 and the 2017–2018 school years, a teacher’s overall
summative evaluation rating includes the following multiple measures: (a) teacher practice score derived from two or three observations, and (b) SGP scores and/or SGO scores, which are weighted and added together to calculate an overall summative evaluation score from 1 (ineffective) to 4 (highly effective). Teachers in tested grades and subjects receive an mSGP score, and the overall summative evaluation rating in the 2014-2015 school year was calculated by combining the multiple weighted measures of teacher practice (70%), mSGP (10%), and SGO (20%). For teachers in nontested grades and subjects during the 2014-2015 school year who did not receive an mSGP score, the overall summative evaluation rating was calculated by
combining teacher practice (80%) and the average of two SGOs (20%). During the 2017-2018 school year, on the other hand, the overall summative evaluation rating for teachers in tested grades and subjects was calculated by combining the multiple weighted measures of teacher practice (55%), mSGP (30%), and SGO (15%). For teachers in nontested grades and subjects
8
during the 2017-2018 school year who did not receive an mSGP score, the overall summative evaluation rating was calculated by combining teacher practice (85%) and the average of two SGOs (15%).
The district adopted the Department of Education’s state-approved Charlotte Danielson Framework for Teaching instrument to evaluate teacher practices. The instrument focuses on the following four performance domains:
● Planning and Preparation
● Classroom Environment
● Instruction
● Professional Responsibilities
Statement of the Problem
The new teacher evaluation requirements have forced teachers to adapt to a new model of accountability, which determines teacher effectiveness by establishing a relationship between student achievement and teacher evaluations. Currently, no substantial amount of research in the state has offered insight to examine the link between teacher practice and SGPs. However, there have been several studies that illustrated inconsistencies between an individual teacher’s rating and student performance. Weisberg, Sexton, Mulhern, and Keeling (2009) discovered that many educational policies in the United States carry the assumption that teachers are interchangeable. With this assumption, “school systems wrongly conflate educational access with educational quality” (Weisberg et al., 2009, p. 9). This phenomenon is what is known as the Widget Effect. The study goes on to identify how the implementations of many new evaluation systems continue to reinforce the Widget Effect.
9
Other research has illustrated how extreme fluctuations in teacher evaluation rating from year to year have raised validity issues with the reliability of new teacher evaluation systems. Darling-Hammond, Amrein-Beardsley, Haertel, and Rothstein’s (2012) study examined teacher evaluation data from five school districts and found that only 20% to 30% of teachers who were rated below the effective rating in the 1st year were rated the same the following year, compared
to 25% to 45% of teachers who were rated below effective but moved all the way to the highly effective rating the following year. In contrast, only a small minority of highly effective teachers remained highly effective the following year. This study will continue to evaluate the impact of the TEACHNJ Act and examine the relationship between teacher practice and student growth in another school district that the Department of Education has identified as being faithful in its implementation of the new evaluation system.
Purpose of the Study
In 2012, the state of New Jersey mandated the implementation of its new teacher
evaluation system. During the 1st full year of implementation of the TEACHNJ Act, a study was
conducted to identify the relationship between teacher practice and student growth. One of the recommendations for future research is for a similar study to be replicated in another state-controlled district to determine if the results are similar. This study will be completed during the 3rd full year of implementation of the new teacher evaluation mandates.
The purpose of this study was to examine the relationship between teacher practice and student growth while controlling for teacher- and school-level characteristics. The study determined the probability that students will receive a typical or high growth SGP score on the state assessment in relation to their teacher’s practice score based on the practice portion of the evaluation instrument. The study will determine the value added by teacher practice, teacher
10
characteristics, and school characteristics on student achievement in the content areas of language arts and mathematics in grades 4–7. The state reports the change in student growth as an SGP score on a scale from 1 to 99.
The first two research questions below were used to analyze the impact of teacher and school characteristics on student growth separately in Model 1 and Model 2; the third research question included the main predictor variable (teacher practice) in a hierarchical logistic regression in Model 3 to identify its value added on student growth.
Research Questions
1. Are teacher-level variables such as gender, ethnic background, and age significant predictors of student growth?
2. Are school-level variables such as school performance status (Comprehensive schools, Target schools, and NonStatus schools) and percent of student subgroup ethnic
composition significant predictors of student growth?
3. How is student growth in language arts and mathematics impacted by a teacher’s effectiveness as measured by the practice score received when one controls for teacher- and school-level characteristics?
4. To what extent does the relationship between teacher effectiveness and student outcome vary from year 2 of AchieveNJ to year 5 of AchieveNJ?
Significance of the Study
When the federal government initiated the Race to the Top grant program, New Jersey was one of the states awarded this grant to create innovative education reform, which includes the construction of a new teacher evaluation system that could identify and improve a teacher’s effectiveness and ability to increase student achievement. A teacher’s evaluation would now
11
incorporate multiple evaluation measures, provide specific feedback for improvement, be aligned to professional development, and inform tenure decisions.
At the time of this research study, the state of New Jersey was in its 4th year of
implementation of the new teacher evaluation framework (AchieveNJ), and any research finding will benefit future policy decisions. This study will continue the previous research that examined the relationship between SGPs and teacher practice in a different school district in an urban setting with a large number of poor- and low-performing students.
Although the federal government and state administrations remain focused on student achievement on state assessments and teacher evaluations as measures of teacher effectiveness, the public policy debate will strengthen around the validity of using value-added measures for tenure, retention, and termination. More specifically, debates will focus on whether teachers should be evaluated based on student achievement, especially when some researchers are skeptical about using value-added measures. The skepticism is bolstered by the fact that it has been shown that teacher performance can fluctuate over time depending on several factors that influence student growth such as attendance rate, mobility rate, curriculum material, instructional time, class size, and home and community supports (Darling-Hammond et al., 2012).
Using the scores of students with like scores across the state of New Jersey to measure student academic growth makes this study unique. Students are compared to their “academic peers” to determine growth regardless of their level of proficiency, their socioeconomic
background, and whether student assignments to teachers are randomized. Further, the study will explain the relationship between teacher practice and student growth in an urban school district that the state of New Jersey identified as a district in need of improvement.
12
Theoretical Framework
New teacher evaluation systems in many school districts signify an exit from the previous approach that typically used checklists with little observational feedback and rarely included data on student achievement (Wise, Darling-Hammond, McLaughlin, & Bernstein, 1984). A study that Weisberg et al. conducted (2009) found that in 12 school districts across four states, less than 1% of teachers were rated unsatisfactory, teachers did not receive specific feedback on improving their practice, novice teachers were neglected, and poor performance went
unaddressed. In reaction to the new evaluation mandates, controversy has surrounded the validity of using student achievement to assess the effectiveness of teacher practice (Kane, Taylor, Tyler, & Wooten, 2011). Should teachers be held accountable for student achievement on standardized tests when there may be other factors outside of their control?
The development of these new policies depends on the logic linking teacher evaluation to student achievement and has been based on several assumptions. Some studies have confirmed a direct relationship between teacher effectiveness and student academic success. Kane,
McCaffrey, Miller, and Staiger (2013) designed the Measures of Effective Teaching (MET) project, which was essentially established to identify effective teachers. The MET project began by collecting baseline data on teacher effectiveness to predict the impact that a teacher will have on a different group of students the following year. To determine teacher effectiveness, the MET project combined three approaches that could measure an aspect of teaching (student survey, classroom observations, and a teacher’s track record of student achievement gains on a state test). Once baseline data were collected, students were randomly assigned to teachers the following school year, and the researchers collected student achievement data to determine the relationship of student achievement and teacher effectiveness. The MET project compared
13
predicted student outcomes to the actual differences that emerged at the end of the 2nd school
year. The study was able to determine that teachers who were identified as effective produced greater student growth as compared with teachers who were rated less than effective (Kane et al., 2013). Similar studies may have justified the use of student achievement data in teachers’
performance evaluations. This data may also produce reliable and sustainable improvements in the quality of teaching and learning (Darling-Hammond et al., 2012).
To understand the influence of teacher practice on student growth, it must be assumed that several factors are likely to impact student performance. These assumptions, derived from the existing literature, justify that student growth is a function of three sets of variables: teacher practice (the main independent variable), teacher characteristics, and school characteristics. In addition, it can be argued that both teacher- and school-level characteristics also influence teacher practice.
Limitations of the Study
1. The study will exclude bilingual teachers because there were only a few valid teacher practice scores.
2. The teacher evaluation framework does not have an interrater reliability component, and there will be variance in professional development given to observers who provide feedback to teachers.
Delimitations of the Study
1. This study will focus on students who are in grades 4–7 in language arts or mathematics and receive a valid SGP score, which the state calculates and provides.
2. Data collection is confined to state assessment results and teacher practice scores from the school district’s Teachscape and TeachBoost systems, which maintain teachers’
14
observation and evaluation scores. School-level data that include teacher and school characteristics are collected online from New Jersey State school performance reports, and data will be retrieved from the state’s NJSMART portal, which maintains student and teacher records.
Definition of Terms
Academic Peers: students from around the state of New Jersey with similar score histories on
state assessments.
AchieveNJ: a state mandate that relies on multiple measures of performance to evaluate teachers.
These measures include components of both student achievement and teacher practice.
Evaluation Instrument: a teaching practice evaluation instrument that a school district selects from a state-approved list. The evaluation instrument is a rubric that provides measurements that capture teacher competencies.
Observation: a method of collecting data on the performance of a teaching staff member’s
responsibilities and that would be included in the determination of the annual summative evaluation rating.
Student Growth Objectives (SGOs): long-term academic goals for groups of students that
teachers set in consultation with their supervisors.
Student Growth Percentiles (SGPs): New Jersey measures growth for an individual student by
comparing a student’s growth to the growth that the student’s academic peers made within a testing year.
Summative Evaluation: consists of two primary components: teacher practice (measured
15
evaluated based on multiple measures of educator practice and student achievement. Each element of the evaluation results in a rating of 1 to 4, which is weighted according to the state formulas. Once the scores for all evaluation measures are finalized, each educator receives a final summative rating on a scale from 1 to 4 (1 = ineffective, 2 = partially effective, 3 = effective, 4 = highly effective).
Teacher Practice: the methods by which a classroom teacher delivers instruction.
TEACHNJ Act: the tenure reform law, which reformed the processes of earning and maintaining
tenure. Under the act, tenure decisions are based on multiple measures of student achievement and teacher practice that the new evaluation procedures measure. All teachers have to earn an evaluation rating of effective or highly effective to maintain tenure. Any tenured teaching staff member who was rated ineffective or partially effective in two consecutive summative annual evaluations could be charged with inefficiency.
Value-Added Modeling (VAM): a method of teacher evaluation that measures the teachers’
contribution in a given year by comparing the current test scores of their students to the scores of those same students in previous school years, as well as to the scores of other students in the same grade.
16
CHAPTER II LITERATURE REVIEW
Overview
The literature review begins by examining how the nation has increased its focus on teacher accountability over the past few decades, and how states have implemented policies to include student growth measures as a means to evaluate teacher performance. The chapter also reviews the concept of teacher effectiveness and its relationship to student achievement. The literature review explores the new incentive to incorporate value-added models (VAMs) to determine teacher effectiveness and hold teachers accountable for student learning. These accountability measures require teacher evaluations to support effective teaching practices, to support the retention of effective teachers, and to encourage the dismissal of ineffective teachers. Review of the literature revealed that although some research findings have promoted the use of VAMs to determine teacher effectiveness for evaluation purposes, other research has identified setbacks in using VAMs alone to evaluate teachers’ effectiveness. Much of the literature was empirical in nature rather than theoretical. This chapter takes a closer look at Student Growth Percentiles (SGPs), which New Jersey uses to measure student growth on its state summative assessment. The current climate of educational reform and current accountability processes that have been put into place in many school districts require a critical review of their impact on the education process.
Teacher Effectiveness and Student Achievement
As previously noted in Chapter 1, the Race to the Top Fund was a competitive grant program designed to “encourage and reward States that are creating the conditions for education innovation and reform; achieving significant improvement in student outcomes, including
17
making substantial gains in student achievement, closing achievement gaps, improving high school graduation rates, and ensuring student preparation for success in college and careers” (U.S. Department of Education, 2009, p. 2). Among the criteria that states had to meet to be awarded the Race to the Top grant, the criteria that was emphasized the most and awarded the most points was “Great Teacher and Leaders.” For states to meet these criteria, they must show how they will improve teacher and principal effectiveness based on performance.
Among the many states that were awarded funds through the Race to the Top grant program was Illinois. In accordance with the Performance Evaluation Reform Act (PERA) of 2010, every district in Illinois would have to adopt a new teacher evaluation system that
addressed both teacher performance and student growth. The teacher performance measures that PERA required had to include both formal and informal classroom observations. Various
qualifying assessment types had to have defined student growth measures. Both teacher
performance and student growth ratings had to be combined to create a single summative rating of teacher performance. PERA was phased in over the following 4 years, starting with the lowest performing schools, and progressing to statewide adoption by the beginning of the 2016-2017 school year (White et al., 2012).
Although student growth measures were now required to be connected to a teacher’s evaluation, Sartain, Stoelinga, and Krone (2010) explained that achievement data should not be the only indicator of teachers’ need to improve their practice. The federal government recognized that the other major component of teacher evaluations must include some form of classroom observation, which created a new demand for observation frameworks that principals and others could use to identify effective teaching. The Consortium on Chicago School Research (CCSR) conducted a study on the implementation of the Charlotte Danielson Framework for Teaching in
18
Chicago Public Schools (CPS), which was their observational tool used for formal teacher observations. This framework was a major shift from their previous observation tool, which was simply a “checklist” used for the previous 30 years and provided very little insight into effective teaching practice. The Danielson Framework, on the other hand, was able to delineate the observable components of effective teaching.
Cincinnati’s Teacher Evaluation System (TES) conducted another study that evaluated the effectiveness of the Danielson Framework to demonstrate a relationship to student
achievement. Kane et al. (2011) determined that classroom observations can capture elements of teaching that are related to student achievement. Their findings demonstrated a positive and nontrivial relationship between TES scores and student achievement growth. Their main results indicated that moving from an overall TES rating of “Basic” to “Proficient” or from “Proficient” to “Distinguished” is associated with student achievement gains of about one sixth to one fifth of a standard deviation. For example, if a student started the year at the 50th percentile in math and reading and had a teacher in the lowest quartile of the overall TES rating, while a similar student had a teacher in the upper quartile of that rating, we would expect the second student to be four percentile points ahead in math and five percentile points ahead in reading by the end of the year.
The first state, however, to create a value-added system to measure student growth was the Tennessee Department of Education. The Tennessee Value-Added Assessment System (TVAAS) could measure individual teacher performance to student test score gains. In 1985, a scientifically controlled experiment called Project STAR, which stood for Student/Teacher Achievement Ratio, was conducted to test the impact of class size on student achievement and, in particular, the achievement gains from smaller classes by race. Although it was determined that all students performed better in smaller class sizes, the study found that the gains in effect
19
size for minorities were approximately twice the gains of whites, which essentially reduced the achievement gap. The study randomly assigned more than 6,000 students from various racial and socioeconomic backgrounds to small (13–17 students) and large (22–26 students) classes in 79 schools across the state and offered an opportunity to examine differences in student
achievement where the only difference between the classes was the teacher. In addition, teachers were randomly assigned to classrooms each year. Students were assigned to the same class size for up to 4 years. There were no interventions, no special training for teachers, and no special curricula. Achievement gains were greater each year for smaller classes than larger classes. The effect of small classes in mathematics for 3 years (grade 1 = 0.140, grade 2 = 0.063, and grade 3 = 0.067) yielded an average effect of 0.090 deviations per year. In reading over 3 years (grade 1 = 0.124, grade 2 = 0.076, and grade 3 = 0.112), small class size yielded an average of 0.104 standard deviations per year. The difference between small classes and large classes was 0.2 to 0.3 standard deviations in each subject. The study showed that the benefits for small classes were two to three times greater for minority students who attended inner city schools than for White students who attended suburban schools. In large classes, the achievement gap between White and Black students in reading was 14.3% compared to 4.1% in small-class settings (Finn, 2002). Finn indicated that at the end of grade 6, students who attended small classes for 1 year had a 1.2-month advantage in reading over students who attended large classes. Students who attended small classes for 2 years had a 2.8-month advantage, and those who attended for 3 years had a 4.4-month reading advantage over students who attended large-class settings.
Stronge, Ward, and Grant (2011) examined the characteristics of effective teachers versus less effective teachers by examining classroom instructional and management practices. Student learning gains were measured for 1 year where the grade 4 end-of-course reading and
20
mathematics tests served as the grade 5 pretests. The study comprised 1,984 students, of which 931 students were assigned to less effective teachers and 1,053 to effective teachers. The results of the study indicated that student achievement in language arts and mathematics was higher for effective teachers than for less effective teachers by more than 30 percentile points. For reading and mathematics, the difference in gains in 1 year was 0.59 and 0.45 standard deviations, respectively. Stronge et al. (2011) noted, “This translated into more than a 30 percentile difference in achievement based on 1 year’s teaching and learning experience” (p. 345). The comparison of teacher practice between effective and less effective teachers did not reveal a significant difference in teacher beliefs, teacher questioning, student questioning, or student disengagement. However, the results indicated that less time was spent on task due to disruptive behaviors, and less effective teachers had three times more disruptions than effective teachers. In addition, data from observation ratings on teachers’ effectiveness indicated statistically
significant differences favoring the effective teachers on classroom management (p<.01), classroom organization (p<.02), positive relationships with their students (.03), and encouragement of student responsibility (p<.01).
These studies have shown that teacher effects on student learning as inferred from standardized test scores are additive and cumulative over grade levels, and that teacher effectiveness can be measured fairly.
Value-Added Models
As states move forward with establishing teacher evaluation systems, VAMs have become a key component for most of these systems to measure accurate teacher effectiveness. VAMs attempt to predict the “value” that teachers add to their students’ learning growth as the standardized assessments measure. Some states have mandated that up to 50% of the teacher
21
evaluation be tied to student test scores using a value-added measure. The logic of using teacher evaluation to measure teacher effectiveness for school improvement is based on the positive relationship between teacher quality and student academic growth. Administrators collect data on teacher classroom behavior through classroom observations and compare the results against teacher practice standards on an identified teacher evaluation rubric. Student growth models are then used to measure the amount of growth a student shows from the previous year. This
information determines retention, promotion, compensation, and tenure. The use of VAMs for these high-stakes consequential decisions has many questioning its reliability, validity, and consistency.
Hallinger, Heck, and Murphy (2014) conducted a critical evaluation of the empirical literature and found few studies that indicated benefits in using VAMs. A study that Taylor and Tyler conducted (2012) in a Cincinnati school district found evidence to suggests that midcareer teachers’ effectiveness improved during the school year and subsequent following school years when VAMs were incorporated into the evaluation process. Students in mathematics performed higher on end-of-year math tests the year that value-added measures were in place compared to the previous year’s evaluations. Taylor and Tyler explained:
These improvements persist and, in fact, increase in the years after evaluation. We estimate that the average teacher’s students score will be 0.11 standard deviations higher in years after the teacher has undergone an evaluation compared to how her students scored in the years before her evaluation. To get a sense of the magnitude of this impact, consider two students taught by the same teacher in different years, who both begin the year at the 50th percentile of math
22
would score about 4.5 percentile points higher at the end of the year than the student taught before the teacher went through the evaluation (p. 83).
Milanowski (2004) examined the teacher evaluation system in Cincinnati to determine the relationship between the evaluation scores of teachers and VAMs of student learning in grades 3–8. The school system’s administrators “want[ed] to be justified in inferring that
teachers with high scores [were] better performers, defined as producing more student learning” (p. 39). The study yielded some positive and mixed results. However, Milanowski determined that the “moderate level of criterion-related validity” (p. 49) was adequate to support the use of student achievement data in the evaluation of teachers.
Borman and Kimball (2005) studied a sample of 400 teachers and 7,000 students in a school district in Reno, NV. Their goal was to assess whether the standards-based evaluation system helped close the achievement gap among students of different socioeconomic
backgrounds. Their results showed a higher mean achievement in classrooms that effective teachers taught, but the differences were not significant. The authors concluded:
This analysis suggests that teacher quality, as defined and applied in the evaluation system of one school district, may not show reliable relations to closing achievement gaps between poor and more advantaged, minority and nonminority, and low- and high-achieving students. The implications for the evaluation system are important, especially if a key component of teacher quality is an ability to close achievement gaps (Borman & Kimball, 2005, p. 18).
The greatest variability in student outcomes can be attributed to the student’s background and factors outside the control of teachers.
23
Kimball, White, Milanowski, and Borman (2004) conducted a larger scale study of a teacher evaluation system in Washoe County, Nevada in which they wanted to understand if “teachers who score well on such evaluation systems also help produce higher levels of student learning” (p. 56). This research examined the relationship between teacher evaluation results and student gains in achievement in reading and math. The results were mixed. The relationship between teacher evaluations scores to student achievement was positive in each grade in language arts and mathematics but was not statistically significant.
Additional studies found little significance when they examined the relationship between student achievement and teacher evaluation ratings. White’s (2004) study in Coventry, Rhode Island sought to “describe the relationship between a teacher’s overall evaluation score and his or her students’ achievement, while controlling for prior achievement, in order to determine the criterion-related validity of the evaluation scores” (p. 3). The researcher analyzed the value-added achievement data in reading and math from 3,617 students and evaluation data for 173 teachers in four elementary school grades and for 2 school years. White’s results “indicated a small overall correlation in reading (0.240) and essentially no correlation in math (0.032). The results also indicated rather large fluctuations in correlations between years and across subjects and grade levels” (p. 6). Again, the overall pattern of results provided weak empirical evidence to support the relationship between student achievement and teacher evaluation in elementary schools. Hallinger et al. (2014) concluded that the ideology of using VAMs was stronger than the actual evidence of its impact.
If value-added measures are to be used successfully in practice to recognize effective teachers, it is important to have a high level of confidence in the credit of achievement gains to specific teachers (Corcoran, 2010). If students are randomly assigned to teachers, it becomes
24
easier to determine that any differences between classroom achievement gains would mostly be due to the teacher. This would mean that other factors that influence year-to-year changes would essentially average out and uncover real differences in achievement gains across teachers. In reality, however, most students are not randomly assigned to classes, which is purposeful. Therefore, value-added methods must use a statistical model to determine the actual “value” a teacher adds to the classroom in relation to the students’ academic growth.
Reliability Concerns Regarding Value-Added Models
Darling-Hammond et al.’s study (2012) examined teacher evaluation data from five school districts and found that 20% to 30% of the teachers who were rated less effective in any given year were rated the same the following year. Furthermore, 25% to 45% of the teachers who were rated less effective moved to the highly effective rating the following year. The same was true for those who were rated highly effective at the end of a year; namely, only a small minority stayed in the highly effective rating the following year. The researchers summarized three key limitations of using value-added measures for the purposes of teacher evaluation:
1. Value-added models of teacher effectiveness are inconsistent.
2. Teachers’ value-added performance is affected by the students assigned to them, thereby calling into question the transparency and fairness of using value-added measures of student learning in evaluations.
3. Value-added ratings cannot disentangle the many influences on student progress and thereby provide an incomplete and inaccurate measure of an individual teacher’s effectiveness. Most importantly, research has revealed that many more factors in addition to any individual teacher can influence gains in student achievement. These other factors include:
25
● School factors such as class sizes, curriculum materials, instructional time, availability of specialists and tutors, and resources for learning (books, computers, science labs, and more)
● Home and community supports or challenges
● Individual student needs and abilities, health, and attendance
● Peer culture and achievement
● Prior teachers and schooling, as well as other current teachers
● Differential summer learning loss, which especially affects low-income children ● The specific tests used, which emphasize some kinds of learning and not others,
and which rarely measure achievement that is well above or below grade level (Darling-Hammond et al., 2012, pp. 2–4).
Many different VAMs have been used across the states although the largest and most widely implemented VAM in the country is the SAS Educational Value-Added Assessment System (SAS® EVAAS®). According to its developers, the SAS® EVAAS® is meant to “assess and predict student performance with precision and reliability” (Amrein-Beardsley & Collins, 2012, p. 15). The issue of reliability came into question from a study that Amrein-Beardsley and Collins completed (2012) in the Houston Independent School District (HISD). The authors examined the reliability of VAM outputs used as evidence to nonrenew four teachers. The study found several inconsistencies in the data among the four teachers. It was determined that VAM output data in three of the four teachers was unreliable, yet all four teachers were removed from their teaching positions due in part to their VAM scores.
Amrein-Beardsley and Collins (2012) pointed out that VAMs are sensitive and can fluctuate substantially within schools even when a different model is used or tested. Briggs and
26
Domingue conducted a similar study in 2011 that verified this observation. The study used an alternative statistical model to calculate the value-added scores for teachers in the Los Angeles Unified School District (LAUSD); these scores had been published in the Los Angeles Times. The results found that 40% to 55% of the teachers would receive different scores with the alternative model. For reading outcomes, 46% of teachers retained the same effectiveness rating under both models, 8.1% of teachers identified as effective under the alternative model were identified as more effective in LAUSD, and 12.6% of those identified as less or least effective under the alternative model were identified as relatively effective in the LAUSD model. For math outcomes, 60.8% of teachers retained the same effectiveness rating, 1.4 % of those teachers identified as effective under the alternative model were identified as ineffective in the LAUSD, and 2.7% would go from a rating of ineffective under the alternative model to effective under the LAUSD model.
Collins and Amrein-Beardsley (2014) compiled a study to capture state initiatives using growth models and to determine the strengths and weaknesses of each state’s model.
Approximately 40 states were in the process of using student growth models as part of their new teacher evaluation systems. The most popular VAMs used across the country were the EVAAS, the Student Growth Percentiles (SGP) model (also commonly known as the Colorado Growth Model [CGM]), the Value-Added Research Center (VARC) model, and homegrown models. In four states (including New Jersey), teacher consequences attached to growth or value-added data were locally controlled. In 15 states, teacher consequences attached to student performance data were yet to be determined, and in 14 states, teacher consequences would ultimately be attached to growth or value-added scores, which also influenced them. A total of 10 states tied or planned to tie teacher tenure decisions to value-added scores. As discussed in the research, controlling for
27
student characteristics such as socioeconomic status is important to the validity and reliability of VAMs. However, 21 states indicated that student characteristics were not accounted for in their growth model or VAM. Six states indicated that demographic information was accounted for, and nine states indicated that this information was yet to be determined.
In terms of reliability, some states expressed concerns with the accuracy of the data used when linking students to the teacher of record, and others expressed concerns on whether their state assessments were appropriately designed to measure teacher effectiveness over time. Darling-Hammond (2015) suggested:
Standardized tests in the United States are criticized for their narrowness and focus on lower level skills; evidence has shown that high-stakes incentives to focus on these tests have reduced time spent teaching other important content and skills (Darling-Hammond & Adamson, 2014). Furthermore, because the NCLB Act mandated that state tests measure grade-level standards only, the tests do not include items that assess content or skills from earlier or later grade levels. As a result, these tests cannot measure the actual achievement level—or the learning gains—of the large share of students who are above or below grade level in their knowledge and skills (p. 132).
She found the same fault with more recently created national assessments (one of which was used in this study):
The new tests created by the Partnership for Assessing Readiness for College and Careers (PARCC) and Smarter Balanced, the multistate consortia created to evaluate the Common Core State Standards, will not remedy this problem as they, too, have been required to measure grade-level standards. Even though they will
28
report students’ scores on a vertical scale, they will not be able to measure
accurately the achievement or learning of students who started out below or above grade level (Darling-Hammond, 2015, p. 133).
Teacher Characteristics and the Impact on Student Achievement
The research findings related to teacher quality and its contribution to student achievement have been mixed. Some studies have found no or small effects of teacher characteristics, such as certification and experience, and several studies have attested that teachers contribute to student achievement.
Goldhaber and Brewer (1996) examined the test results of 18,000 students to estimate the impact of teacher degrees on student performance. The study found that several teacher
characteristics were statistically significant and positively influenced student achievement. Teachers who were certified in mathematics and those with bachelor’s or master’s degrees in math and science were associated with higher student test scores. In another study, Goldhaber and Brewer (1999) examined teacher certification status and subject major and their relationships to student achievement using data from the National Educational Longitudinal Study of 1988. The authors found that students of teachers who had an undergraduate or graduate degree in mathematics performed better by a small margin of 0.08 standard deviation than students whose teachers did not have a mathematics degree. In addition, they found that students of teachers with any type of mathematics certification outperformed students whose teachers had no mathematics certification. These results suggested that subject knowledge of mathematics may be more important than the type of certification in terms of the contribution to student achievement.
In addition, Okpala, Smith, Jones, and Ellis (2000) conducted a study that determined a relative amount of significance for the impact of teacher characteristics on student achievement.
29
The population of the study consisted of 4,256 grade 4 students from 46 schools in North Carolina during the 1995–1996 school year. The two teacher characteristic variables that the study identified were the percent of teachers with master’s degrees and percent of teachers with more than 10 years’ teaching experience. The results from the study indicated that teachers with master’s degrees explained achievement gains in mathematics with a significance level of 1 percent, but there was no significance in reading. Additional findings indicated a significant correlation between teachers with 10 years of teaching experience and student achievement in mathematics and reading with a significance level of 1 percent and 5 percent, respectively.
Goldhaber and Anthony (2007) examined the relationship between teachers with National Board for Professional Teaching Standards (NBPTS) certification and student achievement. It was determined that NBPTS is able to identify more effective teachers successfully among their applicants. In addition, National Board Certified Teachers (NBCT) were more effective than their noncertified peers at increasing student achievement before they became certified. The study matched 32,399 teachers to 609,160 students’ reading test scores, and it matched 32,448 teachers to 611,517 mathematics test scores in North Carolina. The findings were marginally statistically significant:
The magnitudes of the Future NBCT coefficients suggest that student gains produced by the teachers who are certified by NBPTS exceed those of
noncertified applicants by about 4 percent of a standard deviation in reading and 5 percent of a standard deviation in math (based on a standard deviation of 9.94 on the end-of-year reading tests and 12.34 on the end-of-year math tests). These effects sizes are of the same order of magnitude as those found for math teachers having a bachelor’s degree in their subject area (Goldhaber & Brewer, 1997). The
30
findings for Current NBCTs are smaller but still positive, and in the case of the reading model, statistically significant (p. 11).
Over time, several research studies have linked teacher classroom practices to student achievement. These practices include specific teaching strategies such as communicating clear learning objectives and expectations for student performance, utilizing standards-based learning objectives and assessments, and utilizing best instructional practices. Milanowski (2004)
conducted a study in Cincinnati that analyzed the relationship between teacher evaluation scores and student achievement. The sample included 212 teacher evaluation scores using Danielson’s (1996) framework and students in grades 3–8. The researcher found small to moderate
correlations between teacher evaluation scores and student growth. The average correlations were 0.27 in science, 0.32 in reading, and 0.43 in mathematics.
School Characteristics and the Impact on Student Achievement
Kannapel and Clements (2005) examined 26 high-poverty elementary schools in Kentucky to determine what made high-performing, high-poverty schools different from other high-poverty schools. They selected eight high schools based on a school audit instrument that the state developed. All eight schools received high ratings in areas such as school culture and student, family, and community support. When these schools were compared with
low-performing, high-poverty schools, significant findings were reported in a few areas. Teachers in the high-performing, high-poverty schools conducted frequent assessments, provided feedback to students, delivered instruction aligned to learning goals and assessments, had high expectations for student performance, used student achievement data for staff development purposes, and participated in collaborative decision making and job-embedded professional development.
31
Some research has shown that students’ absenteeism rates can be detrimental to their success as early as kindergarten. In New Jersey, students who are absent for at least 10% of the school year are categorized as chronically absent. Gottfried (2014) examined the effect of chronic absenteeism on both achievement and socioemotional outcomes for a nationally
representative dataset of kindergarten students from the 2010–2011 school year. The study found that chronic absenteeism could, in fact, reduce math and reading achievement outcomes and reduce educational engagement in schools.
Summary
Overall, the literature has provided evidence that classroom teachers have an impact on student achievement, and that the academic achievement of a student may depend on the quality or effectiveness of the teacher’s instruction. Although some studies indicated value in the
concept of holding teachers accountable for student learning, there was still no consensus on how to establish fair and equitable standards to evaluate teachers on their effectiveness and the value they add to a classroom. This lack of consensus is partly due to the incapability of VAMs to measure teacher qualities that could contribute to student learning and would be able to account for teacher evaluations. However, some findings have supported the use of VAMs to measure teacher effectiveness by controlling for factors that are outside the teacher’s influence by using prior-year assessment data compared against the current year to measure the value of learning added during the year, which has created a national push to incorporate VAMs into teacher evaluations. The literature has identified the limitations in the use of VAMs to measure teacher effectiveness for the purposes of retention, promotion, compensation, and tenure.
The use of high-stakes tests to determine accountability measures using VAMs could manipulate teaching habits and influence teachers to teach to the test, even if it means changing
32
course from a preset curriculum guide. The literature has identified how VAMs may, in fact, not detect the effectiveness of teachers when teaching either low-performing or high-performing students. In many instances, the use of VAMs may discourage teachers from working in low-performing schools or with high-needs students, which creates longer vacancies and makes those positions harder to fill with certified teachers. Darling-Hammond (2015) reported that:
● Teachers of grades in which English language learners (ELLs) are transitioned into mainstreamed classrooms are the least likely to show “added value.”
● Teachers of large numbers of special education students in mainstreamed classrooms are also found to have lower “value-added” scores on average. ● Teachers of gifted students show little added value because their students
are already near the top of the test score range.
● Ratings change considerably when teachers change grade levels, often from “ineffective” to “effective” and vice versa (Darling-Hammond et al., 2012, p. 12).
In addition to the sensitivity of high-stakes tests’ effects on teacher evaluation outcomes, the research literature has highlighted a range of issues related to the validity and reliability of VAMs. Some of these concerns stem from the fluctuation of evaluation ratings that may occur when teachers switch schools or change grade levels, which raises many questions regarding the validity of state tests and their ability to measure teacher effectiveness accurately. VAMs that do not control for student-level variables such as socioeconomics run the risk of masking the true effects of teachers on student achievement. VAMs do not specifically address the differences in instructional practices, use of questioning, and classroom management that have an effect on