I
THESIS FOR THE DEGREE OF DOCTOR OF PHILOSOPHY
SPATIAL ANALYSIS OF LIPIDS IN TISSUE SAMPLES
APPLYING MASS SPECTROMETRY IMAGING
Masoumeh Dowlatshahi Pour
Department of Chemistry and Chemical Engineering
Chalmers University of Technology
Gothenburg, Sweden
2018
II
SPATIAL ANALYSIS OF LIPIDS IN TISSUE SAMPLES APPLYING MASS
SPECTROMETRY IMAGING
Masoumeh Dowlatshahi Pour
ISBN: 978-91-7597-690-7
© Masoumeh Dowlatshahi Pour, 2018
Doktorsavhandlingar vid Chalmers tekniska högskola
Ny serie nr 4371
ISSN 0346-718X
Department of Chemistry and Chemical Engineering
Division of Chemistry and Biochemistry
Analytical Chemistry
Chalmers University of Technology
SE-412 96 Gothenburg
Sweden
Telephone: +46 (0)31 772 1000
Front cover: A simple illustration of ionization process in SIMS imaging to produce ion images from a mouse brain tissue sample showing the distribution of phosphatidylcholine at
m/z 184 (left) and cholesterol at m/z 369 (right) in the grey matter and white matter respectively.
Printed by Chalmers Reproservice Gothenburg, Sweden 2018
III Masoumeh Dowlatshahi Pour
Department of Chemistry and Chemical Engineering, Chalmers University of Technology
Abstract
Lipids are important naturally occurring components in all living cellular organisms. They serve as the main building blocks of cellular membranes, participate in many signaling pathways and are also stored as an energy source. Due to the extreme complex cellular chemistry and structure of lipids, there is a real need to have a label-free technique with high chemical specificity, high accuracy and high sensitivity for study of lipids within the cell membrane. Mass spectrometry imaging (MSI) is capable of providing information on the chemical composition and spatial distribution of complex biological molecules. MSI is a powerful label-free tool for lipid analysis across biological materials. Both matrix-assisted laser desorption/ionization (MALDI) and secondary ion mass spectrometry (SIMS), the two most common MSI techniques, have recently undergone many developments to improve spatial resolution and provide high sensitivity, mainly for higher mass species. These two techniques offer different capabilities in the analysis of a biological system. The main differences are that larger molecules can be ionized and detected using MALDI, whereas SIMS is capable of detecting mainly small molecules but at higher spatial resolution compared to MALDI. This thesis mainly focuses on two scopes of investigation with different sample modifications and also on the overall applicability of MSI for analysis of tissue samples. In recent years, some surface modifications have been developed to enhance the yield of intact molecular species in SIMS. One of them is matrix enhancement secondary ion mass spectrometry (ME-SIMS), which is the combination of the protocol for MALDI sample preparation and normal SIMS. In paper I, the possible mechanism of the signal enhancement in ME-SIMS was studied. Here, sublimation was used to deposit a thin layer of an organic matrix on the surface of a brain tissue slice analyzed with SIMS.In this work, I showed that sublimation could successfully provide enhancement in ion yields for a multitude of lipid species in SIMS. The mechanism of this enhancement could be due to a lower ion suppression followed by removal of the cholesterol crystals from the surface of sample allowing detection for less abundant species. It is also possible that the extraction of some specific lipids into the deposited matrix directly leads to an increase of higher mass lipid ion yield. In paper II, two different surface modifications, including matrix sublimation and nanoparticle deposition were applied on Drosophila brain samples and lipid information obtained from MALDI analysis were compared. Here, it was shown that each technique can be used in a complementary approach to detect a variety of lipid species. In paper III, SIMS imaging was employed to investigate the effect of specially processed cereals, as a specific diet on the alteration of lipid composition across the rodent intestine tissue. In paper IV, I continued the study of changes in lipid content, this time on brain samples of animals exposed to the same diet. Intake of such cereals increases active antisecretory factor (AF) in plasma, an endogenous protein with proven regulatory function on inflammation and fluid secretion. Although, the exact mechanism for the activation process of AF at the cellular level remains unclear.The results show changes in lipid content of cell membrane in response to this cereals intake suggesting a relation to activating AF. In paper V, the techniques for developing of sample preparation in SIMS imaging were investigated to improve the signal intensity of intact molecules at higher resolution.
IV
List of publications
The thesis is based on the work contained in the following papers:
I. An investigation on the mechanism of sublimed DHB matrix on molecular ion yields in SIMS imaging of brain tissue.
Masoumeh Dowlatshahi Pour, Per Malmberg, and Andrew G. Ewing, Anal Bioanal Chem., 2016 May, 408, pp 3071–3081.
II. Laser Desorption Ionization Mass Spectrometry Imaging of Drosophila Brain Using Matrix Sublimation versus Modification with Nanoparticles.
Nhu T. N. Phan, Amir Saeid Mohammadi, Masoumeh Dowlatshahi Pour and Andrew G. Ewing, Anal. Chem., 2016 Feb, 88 (3), pp 1734–1741.
III. Mass spectrometric profiling of lipids in intestinal tissue from rats fed cereals processed for medical conditions.
Masoumeh Dowlatshahi Pour, Eva Jennische, Stefan Lange, Andrew G. Ewing and Per Malmberg, Biointerphases, 2016 Jun, 11(2), pp 02A3101- 02A3107.
IV. Food induced changes of lipids in rat neuronal tissue visualized by ToF SIMS imaging.
Masoumeh Dowlatshahi Pour, Eva Jennische, Stefan Lange, Andrew G. Ewing and Per Malmberg, Sci Rep., 2016 Sep, 6, pp 327971-327979.
V. Improved molecular imaging in rodent brain with time of flight secondary ion mass spectrometry using gas cluster ion beams and reactive vapor exposure.
Tina B. Angerer, Masoumeh Dowlatshahi Pour, Per Malmberg, and John S. Fletcher, Anal Chem., 2015 Apr, 87(8), pp 4305-4313.
V
Related publications not included in the thesis
Zinc Regulates Chemical-Transmitter Storage in Nanometer Vesicles and Exocytosis Dynamics as Measured by Amperometry
Lin Ren, Masoumeh Dowlatshahi Pour, Soodabeh Majdi, Xianchan Li, Per Malmberg, and Andrew G. Ewing, Angew. Chem., Int. Ed. 2017, 56, pp 4970 –4975.
New frontiers in investigation of Psoriasis skin tissue by lable-free multi-modal imaging: a pilot study on phototherapy treated patient
Nisha Rani Agarwal¥, Masoumeh Dowlatshahi Pour¥, Maria Siekkeri Vandikas, Annika Enejder, Amra Osmancevic, Per Malmberg, (Submitted).
Imaging mass spectrometry as a novel approach to measure hippocampal zinc. Masoumeh Dowlatshahi Pour, Lin Ren, Andrew G Ewing and Per Malmberg, (Manuscript).
Zinc Changes Lipid Composition of Cells and Mediates Plasticity in Exocytosis: Combining ToF SIMS with Electrochemical Quantification
Lin Ren¥, Masoumeh Dowlatshahi Pour¥, Per Malmberg and Andrew G Ewing, (Manuscript).
VI
Contribution report
Paper I. I took part in planning and designing the project with co-authors. I performed the experimental part and discussed the experimental issues with Per Malmberg and Andrew G. Ewing. I was responsible for analyzing and interpreting the data, and writing the first draft of the manuscript and responding to reviewer comments in consultation with other authors.
Paper II. I took part in planning and designing the project with co-authors. I assisted with sample preparation using sublimation for MALDI analysis. I contributed in writing part of the manuscript.
Paper III. I took part in planning and designing the project with co-authors. I performed and contributed to experiments, data analysis, and interpretation. I wrote the majority of the first draft of the manuscript and responded to reviewer comments in consultation with co-authors.
PaperIV. I took part in planning and designing the project with co-authors. I performed and contributed to experiments, data analysis, and interpretation. I wrote the majority of the first draft of the manuscript and responded to reviewer comments in consultation with co-authors.
Paper V. I took part in experimental part with Tina B. Angerer and contributed in performing sample preparation, data analysis, and interpretation. I contributed in writing part of the manuscript.
VII
List of abbreviations
AA – Arachidonic acid AF – Antisecretory factor AuNP – Gold nanopartilces
CHCA – α-cyano-4-hydroxycinnamic acid DAG – Diacylglycerol
DHB – Dihydroxybenzoic acid FA – Fatty acid
GCIB – Gas cluster ion beam ITO – Indium tin oxide
LDI – Laser desorption ionization LMIG – Liquid metal ion gun
MALDI – Matrix-assisted laser desorption ionization
ME-SIMS – Matrix-enhanced secondary ion mass spectrometry MetA-SIMS – Metal-assisted secondary ion mass spectrometry MSI – Mass spectrometry imaging
NP – Nanoparticle
OPLS-DA – Orthogonal partial least squares discriminant analysis PC – Phosphatidylcholine
PE – Phosphatidylethanolamine PG – Phosphatidylglycerol PI – Phosphatidyinositol PS – Phosphatidylserines
SALDI – Surface assisted laser desorption ionization SEM – Secondary electron microscopy
SIMS – Secondary ion mass spectrometry SM – Sphingomyelin
SPC – Specially processed cereals TAG – Triacylglycerides
TFA – Trifluoroacetic acid ToF –Time of flight
VIII
Contents
1 The
Brain and Neuronal Communication………. 1
1.1. Neurons……… 1
1.2. Glia cells………. 3
1.3. Gray and white substances in the brain……….. 4
1.4 Animal models for biological studies……….. 4
1.4.1 The rodent’s nervous system……….. 4
1.4.1.1 Cerebellum region and functions……….. 5
1.4.2 Drosophila melanogaster brain ……… 7
2
Lipids and Biological Functions of Lipids……….. 10
2.1Categories of lipids ……….... 10 2.1.1 Fatty acyls……….. 11 2.1.2 Glycerophospholipids……… 12 2.1.2.1 Phosphatidylcholine (PC)……….. 12 2.1.2.2 Phosphatidylethanolamine (PE)………. 13 2.1.2.3 Phosphatidylserine (PS)………. 14 2.1.2.4 Phosphatidylinositol (PI)……… 14 2.1.2.5 Phosphatidylglycerol (PG)………. 15 2.1.3 Sphingolipids………. 16 2.1.3.1 Sphingomyelin (SM)……….. 17 2.1.3.2 Gangliosides……….. 17
2.1.4 Sterol lipids (cholesterol)……….. 17
2.2 Biological functions of lipids……… 18
2.2.1 Lipids as the integral components of cell membranes………. 18
2.2.2. Lipids serve as an energy source………. 19
2.2.3. Lipids as second messengers in cellular signaling……….. 19
2.3 Neural membrane lipids alterations in neurological disorders………. 20
3 Biological Mass Spectrometry Imaging………. 22
3.1 The mass spectrometry (MS): brief introduction and history……… 22
3.2 Time-of-flight mass analyzer……… 23
3.3 Mass spectrometry imaging……….. 25
3.4 Advantages of MSI………... 26
3.5 Biological sample preparation for MSI………. 26
3.5.1 Tissue preparation……… 27
3.5.2 Cell sample preparation……… 28
3.6 Pitfalls of MSI……… 29
3.6.1 Resolution and Sensitivity……… 29
4 Matrix Assisted Laser Desorption Ionization (MALDI)……….. 30
4.1 Principles of MALDI……….. 30
4.2 Spatial resolution in MALDI imaging……… 31
IX
4.3.1 Sample washing……….... 32
4.3.2 MALDI matrix choice and application……….. .. 33
4.3.3 Nanoparticles application; an alternative to the organic matrix………. .. 36
5 Secondary Ion Mass Spectrometry (SIMS)……….. 37
5.1 Basic principles……….. 37
5.2 Generation of secondary ions………... 38
5.2.1 Sputtering……….. 38
5.2.2 Ionization………... 39
5.3 Basic equation for SIMS………. 40
5.3.1 Matrix effect……….. 40
5.3.2 Damage cross-section and secondary ion formation efficiency……….. . 41
5.4 Operational modes of SIMS……… 42
5.4.1 Dynamic SIMS………... 42
5.4.2 Static SIMS……… 42
5.5 SIMS imaging………. 43
5.6 Primary ion sources for SIMS………. 44
5.6.1 Liquid Metal Ion Guns (LMIG)………. 44
5.6.2 Electron Impact (EI) Sources………. 45
5.7 Comparison of primary ion sources……… 46
5.8 Technical improvements of SIMS for biological analysis……….. 47
5.9 SIMS data analysis……….. 49
Summary of Papers……….……… 51
Concluding of Remarks………. 54
Acknowledgments……… 55
1
1. The
Brain and Neuronal Communication
The human brain is one of the main parts of the central nervous system (CNS). It is the most complex organ, which controls biological processes in the human system, from simple bio-processes in single cells to complicated bio-processes in complex organs. In fact, the brain is involved in a wide range of specific body functions, including motor control and physical motions, hormone regulation, cognition processes, thought, perception, emotion and many other biological activities and processes. The brain comprises two main groups of cells including nerve cells (neurons) and support cells (glia cells) 1,2 which are described in detail in following sections in this chapter.
1.1 Neurons
Due to the massive variety of brain-controlled processes, the brain necessarily links and communicates with the whole body through a very complicated communication system called the neuronal network. The human brain has been estimated to consist of a billion neurons which are responsible for cellular communication, signaling and transition of information within the network. Neurons can communicate with each other via a junction called a synapse, which is a region about 12-20 nm between twoadjacent neurons 3,4 Figure 1.1 shows a schematic of a neuron and the synaptic connection between two neurons. Compared to the other cell types of the body, neurons are structurally different. They are polarized and typically composed of dendrites, a cell body, and an axon with the axon terminals.. Each of these possesses a specific function.5,6
The cell body (soma or perikaryon) comprises the nucleus and also some other intracellular organelles containing microtubules, ribosomes, golgi, mitochondria, and exclusively neurofilaments which are essential for cell functioning. The dendrites are short processes that extend from the cell body and they are generally divided into smaller branches. The function of the dendrites is to receive signals and information from neighbouring neurons in the synaptic space and then carry signals to the cell body. And at the cell body, small electrical impulses are formed from chemical signals received from presynaptic neurons. These small impulses are then integrated forming a larger potential called an action potential, which
2 travels along the axons and allows the neuron to transmit electrical signals over some distance. Axons are long extensions projecting from the cell body to transfer neuronal outputs typically to dendrites of adjacent neurons via a synaptic junction.1,2
To help better conduction of the action potential, the axons are periodically covered by a thick non-conductive layer composed of lipid substances called the myelin sheath. The process of adding and accumulation of myelin on the axon is called myelination, which is performed by glial cells. The electrically insulating myelin sheaths wrapped around the axon allow transmission of the action potential along the nervous system at considerably higher speeds.2,7
Figure 1.1 An illustration of neuronal structure. Neurons contain 3 main parts; the cell body, the dendrites and the axon. Neurons are typically connected to each other through a structure called a synapse where cellular communication occurs either electrically or chemically.Image reproduced with permission from Fischbach.8
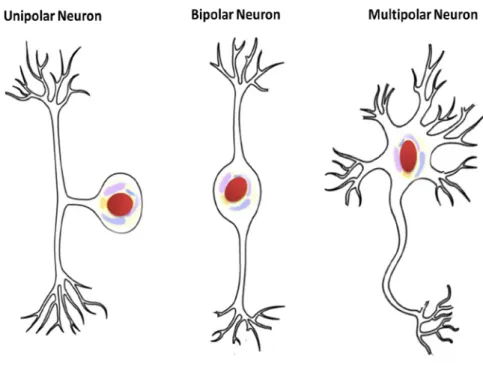
3 Neurons differ in many ways based on their morphology and function. Also, based on polarity, neurons are placed in three different categories of unipolar, bipolar and multipolar (Figure 1.2). In this regard, neurons can be recognized as unipolar when the axon and dendrites grow from the same place on the cell body. Neurons are considered bipolar when a single dendrite and the axon branch from opposite sides of the cell body. If neurons contain one axon with multiple dendrites allowing them to receive signals from other neurons via multiple synaptic points, they are considered multipolar.1,2,7
Figure 1.2 Schematic for structures of three different classes of neurons based on their polarity: unipolar, bipolar and multipolar.
1.2 Glial cells
Another abundant cell type in the brain is the neuroglial cells, which are 10 times more abundant than neurons and indeed compose the bulk of the nervous system. Glial cells have been recognized in two main categories of macroglia and microglia. Macroglia in turn consists of three different classes; 1. oligodendroglia cells, which serve to form myelin sheets around the axon in the central nervous system (CNS); 2. ependyma cells that make myelin sheets in the peripheral nervous system (PNS); and 3. astrocytes play crucial roles such as
4 providing the neurons with nutrients by releasing growth factors, supporting the structure of the nervous system, improving the efficiency of cell signaling between the neurons and also aiding neuronal migration. Microglia cells act as an important agent in the destruction of pathogens and removal of dead neurons.7
Moreover, as glial cells are key factors in maintaining the proper functioning of nervous system, significant alteration in their function can be observed in disorders and diseases such as Parkinson’s disease (PD), Alzheimer’s disease (AD) and Amyotrophic lateral sclerosis (ALS).9
1.3. Grey and white matter in the brain
In general, there are two different kinds of tissue in the CNS, grey and white matter. The grey matter, which appears as gray in color is largely comprised of cell bodies, dendrites, and axonal terminal of neurons. Typically, synaptic communication between neurons mostly occurs in this region. White matter, which is referred to as the area with an off-white colour, mainly contains myelinated axons and in this area, neuronal signals are transmitted via axons over long distances.2
1.4 Animal models for biological studies
1.4.1 The rodent nervous system
There are common similarities known between rodents, particularly rats and mice, and human beings in terms of mammalian genes and biochemical pathways. More importantly, both rodents and humans suffer from many of the same diseases due to having the same basic physiology, organs, and body plans. In recent years, genetic engineering has produced rodent models of disease for clinical, behavioral, and physiological investigations. A remarkable variety of studies using rat models have been presented to characterize the causes of neurological diseases, to find insights into neuronal mechanisms, and also to assess potential drugs and new therapeutic options for humans.10-12
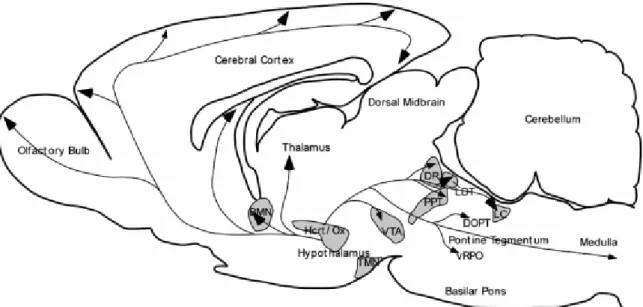
5 A detailed anatomic and structural study of the rat brain has been comprehensively done by Tsujino and Sakurai.13 Figure 1.3 depicts anatomy and structure of different regions in a sagittal section of the rat brain.
Figure 1.3 Schematic illustration of a sagittal section displaying the main parts of the rat brain. Image reproduced
with permission fromNuñez et al.14
1.4.1.1 Cerebellum region and functions
The main tissue type used in this thesis is rat brain cerebellum. The cerebellum is also called the little brain as it is found in the posterior brain hemispheres, located above the brainstem; the structure which forms the connection between spinal cord and brain. The cerebellum makes up about 10 percent of the total weight of the brain, and it has a symmetrical structure with two hemispheres surrounded by cerebellar cortex which is made up of grey matter. The cerebral cortex in the cerebellum is the outermost layer which is composed of neurons densely folded to pack as much surface area as possible into the small space. The cerebellum contains roughly about half of the total number of neurons within the entire mammalian brain. 15,16
6 Figure 1.4a, shows a dorsal view of the cerebellum of a rat brain depicting its geometrical structure which contains three divisions of one midline vermis as the major axis in the middle of two lateral hemispheres positioned at each side. A sagittal slice of the rat cerebellum, illustrated in Figure1.4b, indicates ten various lobules of the cerebellar cortex making up the entire structure of cerebellar region. The cortical layer in each lobule basically consists of three different layers with the molecular layer (ML) as the outermost layer, the Purkinje Perikarya layer (PL) located in the middle and the bottom layer which is called the Granule Cell (GL) layer (Figure 1.4c). Also, a thin sheet of white matter can be seen in the middle of the structure.17
The cerebellum is involved in a variety of functions related to body movement and coordination such as maintaining balance, posture, and gait. 18,19 Also, some recent evidence has been found to implicate the involvement of the cerebellum in a wide range of non-motor higher cognitive functions20 including language,21 planning and prediction,22 learning, emotional memory and emotional experience,23-27 sex and orgasm,28,29 and perceptual ability.30
In addition, dysfunction of the cerebellum has been reported to be involved in some disorders including Bipolar disorder, Schizophrenia, and Specific Language Impairment.31-33
7
Figure 1.4 The ret cerebellum. a: An illustration from dorsal view of the cerebellum in the rat brain. The structure shows an ellipse with a central area called the vermis surrounded by two lateral hemispheres. b: A sagittal cross-section of the rat cerebellum showing 10 different lobules in the structure of the cerebellar cortex.
c: An expanded view of Lobule 7 illustrating three different layers of cerebellar cortex: Molecular Layer (ML) as the outermost layer, Purkinje Perikarya Layer (PL) located in the middle and the bottom layer which is called the Granule Cell (GL) layer (Figure 1.4 c). Also, a thin sheet of white matter is filled in the middle of the structure cortical. Image reproduced with permission from Miquel and et al.17
1.4.2 Drosophila melanogaster brain
Drosophila melanogaster (fruit fly) is known as an ideal model organism in biological studies with many advantages.34-37 Flies reproduce fast (around 100 eggs per day), which is very advantageous for large population studies, statistical analysis, and genetic experiments requiring different generations. In this model, molecular mechanisms such as metabolism, organogenesis, and also neural developmenthave been found to be comparable to humans and mammals. In addition, the fly possesses a variable range of behavioral patterns including learning and memory, sleeping, stress, aggression, drug addiction, and alcohol tolerance, which all imply the existence of refined and developed motor systems, cognitive processes, and coordinated sensory inputs. The nervous system of the fly is very similar to the nervous
8 systems of mammals, particularly the neurotransmitter system and neurological functions related to different parts of the brain.38-40 The Drosophila brain is small, with a volume about 5 nL, and contains more than 100 000 neuronal cells forming complex nervous circuits to carry out a variety of higher order neurological processes.40
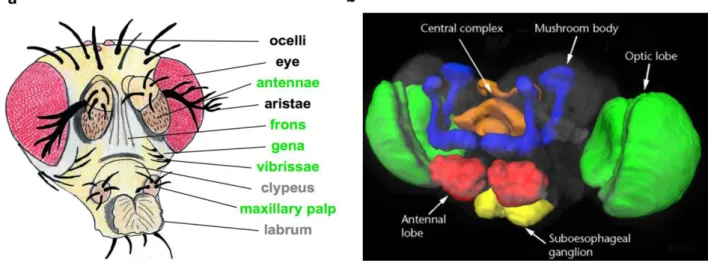
Figure 1.5 depicts a view from the structure of the adult head of Drosophila melanogaster (a) and also a colored schematic of the fly brain showing the main regions and related structures (b).
Figure 1.5 The fly head and brain. a:Drawingof the adult head of Drosophila melanogaster showing different related parts. Image reproduced with permission from Atkins et al.41b: Color-coded representation of the main regions of the fly brain. Image reproduced with permission from Heisenberg et al. 42
As can be seen in Figure 1.5b, the Drosophila brain contains of two main parts, the central brain and the optical lobes.The central brain, the so-called protocerebrum, mainly consists of several regions facilitating different neurological processes. The essential region is the mushroom body which is located in the dorsal and posterior portions of the central brain. The mushroom body region is a center of learning, memory, and olfactory as well as multisensory functions processing. Another part is the central complex, a structure found along the midline of the central brain, which serves a key role in connecting many parts in the central brain and is also involved in integrating and guiding behavior and activities, particularly motor, locomotion, sensory, learning, and memory functions.43,44
9 The antennal lobes region is another part of the central brain, which is placed in the anterior area and forms the primary olfactory center in Drosophila. The lobes possess the olfactory receptor neurons that are essential for the flies to detect odor and identify food and distinguish their partners and predators.45 These lobes are connected to each other and also to the mushroom body as well as other parts of the brain by several kinds of neurons including local neurons, projection neurons, and centrifugal neurons. The final region is the suboesophageal ganglia, a region in the central brain which is associated with regulation of gustatory neuron activities.46 The optical lobes region contains about 60 000 neurons on each side and is another part of the fly brain which is responsible for vision activities.47
In this thesis, the brain tissue sections from both rat and fruit fly models have been successfully used to demonstrate as proof of principle the methods, but also to study new neuroscience. These models will be further discussed for the experimental analysis with greater details later in this thesis.
10
2. Lipids and Biological Functions of Lipids
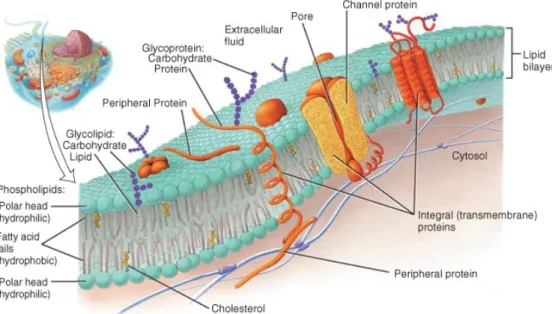
Lipids are small naturally occurring molecules in all living organisms. As they have a hydrophilic polar head group and hydrophobic nonpolar tails in their structure, all lipid molecules in the cell membrane are naturally amphipathic.48 Lipids play different critical functions in biological systems. The key function of lipids is the formation of lipid bilayers in the cell membrane (Figure 2.1). Here the lipids provide the structural integrity required for protein function as well as serving as lipid anchors to bind proteins to the cell membrane. Also, lipids are involved in signaling pathways acting as secondary messengers in signal transduction and synaptic transmission. Furthermore, lipids are well-known energy storage molecules, particularly in the form of fatty acids (FA) and triacylglycerols (TAG). Another function of lipids is to serve as vitamins and hormones.49,50
Figure 2.1 Schematic representation of the cell plasma membrane illustrating different chemical constituents containing lipids as the main structure of the membrane. Image reproduced with permission from Marieb et al. 51
2.1 Categories of lipids
Lipids differ considerably in structure and chemical properties. Different biochemical transformations and pathways can make the lipid structures more complex during their biosynthesis. Due to this level of diversity, a comprehensive classification and chemical
11 representation system is required to properly cover the broad range of lipids. Accordingly, a number of classification systems have been developed which classify lipids by different characteristics, such as polarity, solubility or degree of saturation. A comprehensive classification system for lipids was published in 2005 by Fahy et al. to establish a universal nomenclature for lipids.52 From this, biological lipids are defined as amphipathic small molecules that are originally made of two biochemical subunits: ketoacyl groups and isoprene groups (Figure 2.2). Using this approach, lipids can be classified into eight different groups: sphingolipids, saccharolipids, fatty acyls, glycerolipids, glycerophospholipids, polyketides, prenol lipids, and sterol lipids. This lipid classification includes almost all subgroups of lipids; however, only the lipid groups that are abundant in brain tissues will be discussed here.
Figure 2.2 Lipid building blocks. The LIPID MAPS classification system is based on two fundamental biosynthetic concepts “building blocks”: isoprene and ketoacyl groups. Image reproduced with permission from Fahy et al.52
2.1.1 Fatty acyls
Fatty acyl is a general name for describing fatty acids, their conjugates, and derivatives. The fatty acid as one of the most fundamental classes of biological lipids is essentially made of a terminal carboxylic acid with a long saturated or unsaturated aliphatic chain. The fatty acid structure is commonly used as a building block of complex lipids. Since they are commonly being formed from two carbon acetyl-CoA molecule extensions, most naturally occurring fatty acids are straight-chain carboxylic acids with an even number of carbon atoms. However, odd-chained and branched fatty acids have also been found, for instance in protozoa and bacteria.53 Fatty acids exist as either free fatty acid (FFA) molecules or fatty acyl esters in more complex lipid components such as phospholipids, diglycerides, and triglycerides in the body. The majority of the fatty acids found in lipids are monocarboxylic acids.54
12
2.1.2 Glycerophospholipids
The glycerophospholipids are abundant in nature and are key components of the lipid bilayer of cells. Glycerophospholipids, which are glycero-containing lipids can be considered to be glycerolipids, but due to their abundance and importance, they are placed in a separate category. Glycerophospholipids, with an amphiphilic structure, are essentially formed from 2 fatty acid tails as the nonpolar part of the lipid, connected to a polar head-group which contains a phosphate group esterified to a glycerol backbone (Figure 2.3). Depending on the polar head group structure, different subgroups with different biological functions are defined for the lipids in this category. Correspondingly, the main subclasses are phosphatidylcholine (PC), phosphatidylethanolamines (PE), phosphatidylserines (PS), phosphatidylinositols (PI), and phosphatidylglycerol (PG). Among them, the most abundant phospholipids in the brain are PE, PC and PS and the amount and distribution of these lipids vary significantly within specific brain regions.55,56
Figure 2.3 General structure of glycerophospholipids displaying the polar head group and hydrophobic tail.
2.1.2.1 Phosphatidylcholine (PC)
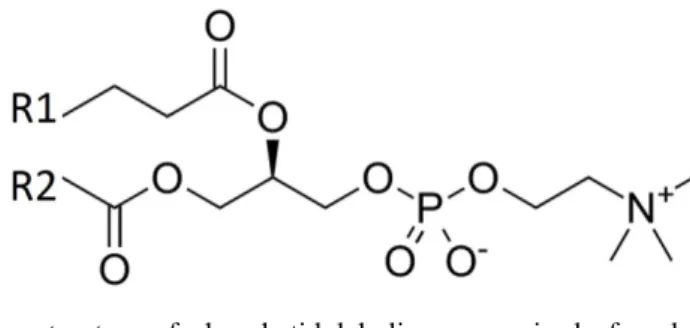
Phosphatidylcholines (PCs) (Figure 2.4) are the most abundant lipid species in the class of glycerophospholipids and incorporate choline as a head-group. They are the major constituents in the lipid bilayer of cell membranes, specifically in brain tissue. PCs with head and tail groups of approximately the same size are lamellar in (cylindrical) shape, and as such are dominantly distributed in the outer leaflet of cell membranes.57 Since the choline head-group contains nitrogen in its structure, PC molecules can be either net neutral in charge as zwitterions with a positive amine combined with a negative phosphate group, or gain a positive charge by protonation in mass spectrometry.58
13
Figure 2.4 Typical molecular structure of phosphatidylcholines comprised of a glycerophosphoric acid and a choline head group, with various kinds of fatty acids (R1 and R2 that can be saturated or unsaturated).
2.1.2.2 Phosphatidylethanolamine (PE)
Phosphatidylethanolamine (PE) (Figure 2.5) covering about 15–25% of the total lipid content in mammalian cells is the second most abundant phospholipid after PC. The main building block to form PE is ethanolamine (H2N-CH2-CH2-OH), which occurs in every cell in the
human body as the head group of PE. Owing to a small head group compared to its hydrophobic tails, PE has a conical shape causing curvature properties to the cell membrane. PE is therefore enriched in the inner leaflet of membranes and as a zwitterionic molecule is able to yield both positive and negative molecular ion species in mass spectrometry.59,60
Figure 2.5 General structural formula of phosphatidylethanolamine displaying a combination of glycerol esterified with two fatty acids and phosphate group that are linked to an ethanolamine group.
14
2.1.2.3 Phosphatidylserine (PS)
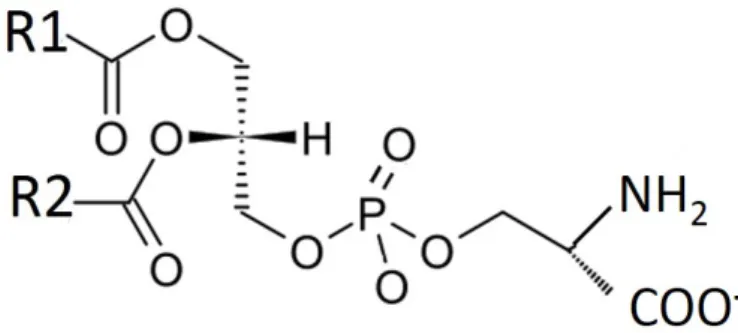
Phosphatidylserine (PS) is another lipid in the glycerophospholipid category. It consists of two fatty acids linked to an ester connection to the first and second carbon of glycerol and serine. The serine molecule is attached through a phosphate group linkage to the third carbon of the glycerol lipid (Figure 2.6). Similar to other conical shaped lipids, it is mainly distributed in the inner leaflet of membranes. However, surface-exposed PS occurs during cell death or damage since PS is transported to the outer cell membrane on cells undergoing apoptosis.61,62
Figure 2.6 General structural formulation of phosphatidylserines presenting attachment of two fatty acids to the first and second carbon of glycerol backbone and serine which is attached through a phosphate group linkage to the third carbon of the glycerol lipid.
2.1.2.4 Phosphatidylinositol (PI)
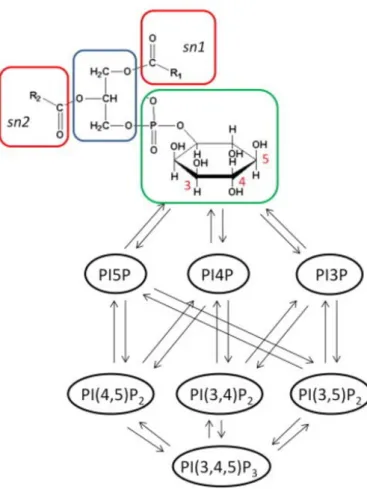
Phosphatidylinositol (PI) is formed from a glycerol backbone, with an inositol ring and a phosphate at the sn−3 position and two acyl chains esterified at the sn−1 and sn−2 positions. The inositol ring can be phosphorylated at different places in which seven unique species known as phosphoinositides (PIPns) can be generated (Figure 2.7). PIs are well known as both signaling molecules and key structural constituents of the cell membrane in various eukaryotes. They can be found in all tissues; however, they are mostly present in the brain. Since PI has several OH groups on its head-group, it can easily carry a negative charge and be detected as [M-H]- species in ToF-SIMS.63
15
Figure 2.7 The structural formula, arrangement and also the production of phosphatidylinositol. Phosphatidylinositol is formed from a glycerol backbone (blue), two acyl chains at the sn−1 and sn−2 positions (red) and an inositol headgroup (green). The hydroxyl groups can be phosphorylated at positions 3, 4 and 5, generating seven typical phosphoinositide species.Image reproduced with permission from D'Souza et al.63
2.1.2.5 Phosphatidylglycerol (PG)
Phosphatidylglycerol (PG) as the simplest glycerophospholipid consists of a glycerol molecule in which the hydrogen of one of the primary hydroxy groups has been replaced by a phosphatidyl group (Figure 2.8). PG is the second most abundant lipid species in bacterial cell membranes. Also, it occurs in plant and in mammalian cells (mainly in mitochondria) but in low abundance.64
16
Figure 2.8 General chemical structure of a phosphatidylglycerol showing a phosphatidyl group which is replaced with the hydrogen of one of the primary hydroxy groups in glycerol molecule.
2.1.3 Sphingolipids
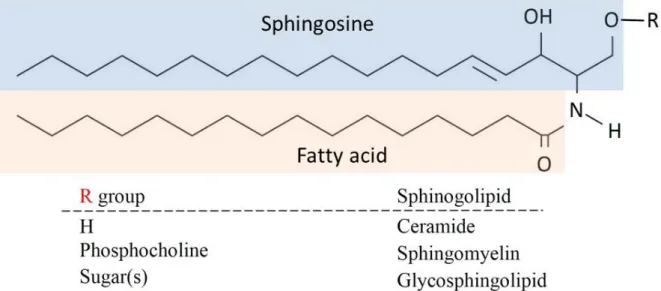
The amino group of sphingosine is acylated with long chain fatty acids and the N-acylated product is termed a ceramide, which is linked to different head groups to form various membrane lipids. Indeed, ceramide is a sphingolipid with an R group composed of only a single hydrogen atom. The R group comprising phosphocholine yields a sphingomyelin, and numbers of sugar monomers or dimers, yield cerebrosides and globosides, respectively (Figure 2.9). Contrary to the glycerophospholipids, simple sphingolipids with sufficiently amphipathic structure can freely diffuse and flip between the inner and outer leaflet of the cell membrane.65
Figure 2.9 Structural representation of sphingolipids: contains a sphingosine, a long chain aliphatic amino alcohol, long chain fatty acid and different head groups (as R) yielding major classes of sphingolipids.
17
2.1.3.1 Sphingomyelin (SM)
Sphingomyelin (SM) is the most abundant complex type of sphingolipid found in mammalian cell membranes, especially in the membranous myelin sheath, which surrounds nerve cell axons. Among the membrane phospholipids in humans, sphingomyelin is the only one not derived from glycerol. Structurally, it is the phosphodiester of ceramide and choline, which is generated by a reaction that transfers the head group of PC to ceramide. 66,67
Similar to PC, the choline head group makes it zwitterionic with no net charge; however, it is also capable to be ionized as a positively or negatively charged species by the loss of a methyl group.
2.1.3.2 Gangliosides
Gangliosides, as the most abundant lipids in the nervous system, are a varied group of lipids composed of a glycosphingolipid with one or more sialic acids linked to a sugar chain. These complex lipid species are generally characterized based on heterogeneity and diversity of the structures in their carbohydrate chains. Accordingly, 188 gangliosides with different carbohydrate structures have been identified so far. In cells, gangliosides are primarily localized in the outer leaflets of plasma membranes. The expression levels and patterns of brain gangliosides are considerably changed during brain development. For instance, simpler forms of gangliosides are present in developing brains, while more complex gangliosides are found in the adult brain.68 Because of their acidic nature, they produce a negatively charged species in mass spectrometry.
2.1.4 Sterol lipids (cholesterol)
Sterol lipids have the unit structure of a five-carbon branched chain. The most abundant lipid component from this category in the brain is cholesterol (Figure 2.10), which is an essential structural component of animal cell membranes and is necessary for providing both the structural integrity and fluidity of the cell membrane. Cholesterol is capable of freely traveling between the inner and outer leaflet of the membrane. It plays a key role in the formation of lipid rafts and is responsible for protein trafficking and signaling at the cell surface.69 In mass spectrometry, cholesterol can be ionized to [M+H-H2O]+ and to the
18
Figure 2.10 Representative structure of cholesterol (a combination of steroid and alcohol) with its polar hydroxyl group which can be esterified by a fatty acyl residue.
2.2 Biological functions of lipids
2.2.1 Lipids as the integral components of cell membranes
The plasma membrane creates the protective barrier surrounding all cells. The main constituents of the plasma membrane are lipids which provide an efficient shield against the aqueous environment owing to their hydrophobic and hydrophilic sections in their structures.48 Notably, among different lipid groups, cholesterol and glycerophospholipids are the two main lipid components in the lipid bilayer of the cell membrane. Specifically, brain tissue mainly consists of three major categories of lipids; cholesterol, glycerophospholipids (phosphatidylcholine, phosphatidylethanolamine, and phosphatidylinositol) and sphingolipids (sphingomyelin, cerebrosides, sulfatides, and gangliosides) to such an extent that brain contains 20% of the body’s total cholesterol and also 20-25% of brain’s dry weight is composed of glycerophospholipids.56,70
In the cell membrane, lipids arranged in cholesterol and sphingolipid-rich microdomains are called lipid rafts. 71 These rafts are enriched with transmembrane proteins and ion channels. Lipid rafts have also been implicated to serve as protein anchors to attach proteins to the cell membrane and to aid regulate protein functions as well. Moreover, K+ and Ca+ channels functions are affected by lipids and fatty acids such as arachidonic acid a lipid-based second messenger.49 This will be discussed in more details later in this section.
Lipid organization in the cell membrane can be associated with regulation of bioprocesses in cells such as exocytosis; the process of membrane fusion of an intracellular trafficking vesicle with the cellular membrane of the presynaptic neuron to release neurotransmitters. Lipid
19 composition and their geometry can play a regulatory role in the membrane fusion of the vesicle and the plasma membrane. In fact, glycerophospholipids based on their shape and geometry, rearrange their localization across the cell membrane during exocytosis. Such that the lamellar shaped lipids including PC and sphingomyelin are highly localized away from, whereas conically shaped lipids such as PI, PE and PS accumulate in the high curvature fusion pore site. These changes in lipid structure and distribution of various lipid compositions provide sufficient flexibility of the membrane during fusion process facilitating exocytosis.57
2.2.2. Lipids serve as an energy source
In general, fatty acids (FA) and triacylglycerols (TAG), are viewed as the main reservoirs of energy for biological systems. FAs and TAGs are efficiently reduced producing higher energy (38 kJ/g) than the other types of energy sources including carbohydrates and proteins (17kJ/g). In addition, since lipids have hydrophobic properties, they are stored in anhydrous forms which provide a highly concentrated energy source for biological reactions.54
2.2.3. Lipids as second messengers in cellular signaling
Lipids play the role of second messengers in many cellular signaling pathways via biosynthetic and metabolic reactions with different enzymes. Second messengers are generated via different complex catalytic mechanisms from different precursors in biological reactions. Also, there is in general a relation among biochemical reactions involved in this process and one single pathway can affect other related signaling pathways. Arachidonic acid (AA), a 20 carbon polyunsaturated fatty acid and one of the most important lipid-based second messengers is essentially produced via the hydrolysis of glycerophospholipids by phospholipase. AA is also generated from a serial metabolic process in which AA is produced by the hydrolysis of phosphatidylinositol 4,5-biphosphate to diacylglycerol (DAG) and subsequently, the hydrolysis of DAG by phospholipase C.56,72 AA serves as modulating of Ca2+, K+ ion channels and protein kinase C activities and also the monoamine transporters by inhibiting glutamate uptake.57,73
Diacylglycerols (DAGs), another major group of second messengers are generated by the catalytic cleavage of glycerophospholipids, mostly PI, PC, and PE. In addition, DAGs generally serve as precursors for second messengers such as PA and AA.56
20 Ceramides are metabolites, which are essentially generated from hydrolysis of sphingomyelin by sphingomyelinase. These lipid components have been implicated in several physiological cellular functions including cellular reaction to stress and injury, apoptosis, cell growth arrest, differentiation, cell senescence, cell migration and adhesion. Also, it has been shown that the ceramide level in the cells exposed to chemotherapy agents is increased and leads to the inflammation response and ultimately the cell death. Typically, the ceramide targets are a variety of biomolecules and enzymes such as ceramide-activated protein kinase (CAPK), ceramide-activated protein phosphatase (CAPP), protein kinase C, and phospholipase D. Moreover, phosphoproteins in cells can be affected by ceramides altering many biological functions of the cell.74,75
2.3 Neural membrane lipids alterations in neurological disorders
After white adipose tissue, the brain is the organ most enriched with lipids in the body.76 Therefore, it is obvious that any lipid alternation can heavily influence brain structure and function and it has been well established that many neurological diseases such as Alzheimer’s disease (AD), Parkinson’s disease (PD), multiple sclerosis, schizophrenia, ischemic stroke, anxiety, depression, and epilepsies are associated with lipid perturbations in the brain. To date, the actual cause and cascade of events in the progression of these diseases are not fully known due to the extensive complexity of the brain. Recently, the study of possible lipid alternation during these neurodegenerative disorders has been strongly focused in the hope of finding underlying pathogenic mechanisms and also treatments.56,77 An overview of some of these disorders, their symptoms and the lipid systems involved are discussed here.
Alzheimer’s disease as the most common form of dementia is a progressive brain disorder affecting the regions controlling memory and cognitive functions in the brain. In this worldwide neurodegenerative disease, a person’s memory, ability to learn, reason, communicate, and daily activities are progressively impaired. According to previous studies, one of the molecular mechanisms suggested for this disease is lipid peroxidation by which the levels of lipids such as polyunsaturated fatty acids, PE, and PI are notably reduced in different regions of AD brains. Accordingly, changes in the composition of membrane lipid lead to a dangerous reduction of signal transduction and synaptic function and also to a series of serious neural membrane defects in AD brain regions.78,79
Parkinson’s disease (PD) is another disorder, which is signified by selective degeneration of dopaminergic neurons, tremor, and rigidity. The etiology of PD remains unclear yet, lipid
21 peroxidation and oxidative stress caused by free radicals have been proposed to play a key role in the pathogenesis of PD. Recent studies in this regard demonstrated a role for oxidative stress in PD by marked increases in 8-hydroxy-2’-deoxyguanosine, a hydroxyl radical-damaged guanine nucleotide typically used to evaluate oxidative damage to DNA. A variety of markers of lipid peroxidation appeared to be notably raised in PD brain.80,81
Multiple Sclerosis (MS) is an autoimmune inflammatory attack against the myelin insulation sheath of nerve cells in the brain and the spinal cord harmfully disturbing the central nervous system and the communication between the brain and the body. Yet the reason for this neurodegeneration is not completely understood, but lipid peroxidation has evidently been believed to occur in MS.82
Schizophrenia is a genetic and chronic mental disorder affecting a person’s thinking, emotional reactions, social behaviour along with hallucinations and delusions. The mechanism of this mental illness remains one of the most puzzling, although recent studies on the neurological deficits of schizophrenia have shown that alterations in membrane lipids may be involved in schizophrenia pathophysiology. Accordingly, abnormal changes in concentration and distribution of PC, ceramides, and fatty acids have been observed in the schizophrenic brain. Also, the levels of PC and PE in cell membrane are diminished in the brain during schizophrenia. These abnormalities occurring in lipid composition of the cellular membrane possibly change the structure and function of the cell membrane and thus the function of membrane-bound proteins, availability of cell signaling molecules, and the behaviour of neurotransmitter systems. This can offer new insight into the role of lipid profiles in schizophrenia pathophysiology.82-84
Ischemic stroke occurs as a result of an obstruction of a blood vessel supplying blood to the brain by a blood clot, which then leads to the loss of neurological function and brain injury. This is marked by failure in lipid functions giving rise to lipid alteration and ultimately cell death.Recent studies have revealed that a variety of lipid disturbances appear to occur in rat brain exposed to ischemic stroke. In the ischemic brain region, the potassium ion adduct of PC exists at a lower concentration; whereas the sodium ion adduct of PC is present at higher concentration. Considerably higher levels of glysoglycerophospholipids, sphingomyelin, and DAGs are accumulated in the injured brain showing that the metabolic pathways of lipids are altered in the inflammatory cellular response.85,86
22
3. Biological Mass Spectrometry Imaging
For decades, the study of biological samples in particular tissues and cells have offered many challenges to the biologist due to their complex chemical and structural properties. So far, microscopic techniques and fluorescent labeling have been well known as the most powerful tools to image the distribution of biological molecules and to investigate the physiological processes happening within a biological system. However, these techniques basically suffer from a limitation that they do not provide direct chemical information, and they require an antibody label, probe, or stain to function. These labels might lead to a change in the chemical and physical properties of the labeled molecule thereby changing its intracellular distribution. Finally, to visualize the molecules of interest in biological systems, probes and antibodies might not always available or be too unspecific to give accurate results.
In the past few decades, mass spectrometry imaging (MSI) has evolved as a powerful label-free (although isotopic labels are sometimes used) technique for identifying, imaging and visualizing the intensity distribution of endogenous biological molecules such as peptides and lipids in the biological samples. The MSI technique provides many advantages compared to microscopy such as extremely low detection limits, parallel detection of multiple analytes in complex biological samples, and the ability to provide spatial as well as chemical information at once.87-89
3.1 Mass spectrometry: brief introduction and history
Mass spectrometry (MS) is a powerful analytical method used to elucidate the structural and chemical composition of different molecules in a sample based on measuring the mass to charge ratio (m/z) of charged particles. It is used to identify the composition of various chemical compounds. In general, MS instruments consist of three major components; ion source, mass analyzer, and detector. First, molecules of the sample are introduced into the gas phase and are ionized in the ion source. The ions produced are then subjected to the mass analyzer where they are separated and sorted based on their m/z ratio. The separated ions reach the detector and a signal is then sent to a data system which creates a mass spectrum.90,91
J. J. Thomson, a physicist who described the electron in 1897, developed the first crude ‘mass spectrograph’ by which he measured the atomic weights of elements. In this device, ions
23 created in discharge tubes were introduced into electric and magnetic fields where they travel through parabolic trajectories. Subsequently, the produced particle rays were detected on a fluorescent screen or photographic plate. A later version of his instrument was completed by Thomson’s students who built a real mass spectrometer. In this device, ions could be distributed by mass and then focused by velocity.92
In the 1940s Professor Alfred O. C. Nier designed and built some devices providing more sensitive and precise measurements of isotopes and their ratios. This was a revelation in mass spectrometry making this technique attractive for public attention. He designed a 60° sector field instrument, the so-called Nier-Johnson mass spectrometer, in which electrostatic and magnetic analyzers were combined in an exclusive combination. By further industrial development, the double-focusing magnetic sector instruments were introduced in which an electric sector was employed to correct kinetic energy spread of ions before separation in the magnetic field, in spite of the fact that this generation of mass spectrometers led to better mass accuracy, peak capacity, and resolution, those instruments were very expensive. This drawback led to developing some cheaper alternatives such as time-of-flight (ToF), quadrupole, and ion trap mass spectrometers.93
3.2 Time-of-flight mass analyzer
The time-of-flight (ToF) mass analyzer, introduced by William E. Stephens in 1946, led to a significant increase in the MS sensitivity due to a very high transmission and wide mass range.94The unique advantages of a ToF analyzer include detection of all the ions generated, high mass resolution, parallel detection and direct examination of multiple ionic species from the sample making this analyzer ideal for the analysis of complex biological samples.95 In the ToF analyzer, ions are accelerated with a high voltage into a field-free zone where they are separated by differences in their velocities. With the same kinetic energy, the velocity of an ion in the flight tube is directly proportional to its mass and inversely proportional to its charge. This relationship is described in Equation 3.1 where kinetic energy (E Kinetic) is a function of mass (m) and velocity (v), as well as a function of particle charge (q=Ze) and potential (V).95,96
𝐸𝐸 𝑘𝑘𝑘𝑘𝑘𝑘𝑘𝑘𝑘𝑘𝑘𝑘𝑐𝑐 = 𝑞𝑞𝑞𝑞𝑞𝑞 = 𝑍𝑍𝑘𝑘𝑞𝑞𝑞𝑞 =
12𝑚𝑚𝑣𝑣
2=
12
�𝑚𝑚
𝑙𝑙224 Time of flight for a specific ion can be calculated by Equation 3.2, given the length of the flight tube (
𝑙𝑙
).𝑘𝑘 = 𝑙𝑙
√2𝐸𝐸1�𝑚𝑚/𝑧𝑧
Equation 3.2
The lighter ions move faster in the flight tube and reach the detector sooner than heavier ions. Despite the fact that ions with the same mass to charge ratio should have the same flight time, the initial temporal, energetic, and spatial distributions among generated ions species can result in poor mass resolution even for ions with the same m/z ratio. As linear ToF mass analyzers were not capable of resolving these issues properly, their mass resolution is considerably reduced. However, several technological advances have been developed over the years, such as delayed extraction techniques and dual stage reflectrons to improve the resolving power of ToF mass analyzers. In the delayed extraction technique, there is a time-specific delay applied on the ions generated before they are extracted into the mass analyzer using high voltage pulses. This leads to a decrease of the variation in kinetic energy between ions with very similar m/z ratio. In the reflectron (Figure 3.1), the ions are decelerated and reflected back into the drift tube by a series of electrostatic rings at the end of the flight tube. The reflectron increases the length and distance of the flight path and also remedies the energy spread among ions with similar m/z ratios. High energy ions penetrate longer into the reflectron than lower energy ions with the same m/z ratio, thus the ions with similar m/z but different kinetic energy reach the detector at the same time leading to improvement of the mass resolution.97-99
25
3.3 Mass spectrometry imaging
Mass spectrometry imaging (MSI), a rapidly growing subfield of chemical imaging is capable of combining the molecular mass analysis and spatial information to provide visualization and localization maps for a variety of atoms and molecules on complex surfaces. Generally, in MSI techniques, ion images are produced by rastering across the surface of the sample to collect a series of mass spectra from an ordered array of spots. After the data acquisitions, ion images for the analytes of interest is mapped and visualized by a color scale which represents the intensity distribution for individual chemical species along the sample surface (Figure 3.2). In recent years more interest in MSI, particularly for biological studies, has rapidly and continuously grown leading to the development and application of secondary ion mass spectrometry (SIMS) and matrix-assisted laser desorption ionization (MALDI). SIMS allows detection of small molecules (<1000 Da) at a higher spatial resolution over a lower mass range, whereas MALDI with the ability to ionize larger molecules is well suited for detection of much broader mass range (~500 Da to >100 kDa), albeit at lower spatial resolution.These imagingtechniques will be discussed in more details later in this thesis.87
Figure 3.2 Representation of creating the ion images in MSI. The sample is analyzed in a raster array in the mass spectrometer and consequently, by collecting mass spectra for each spot and processing this array, an ion density map of a chosen m/z can be obtained across the sample in a two dimensions image. Image reproduced with permission from Greer et al.100
26
3.4 Advantages of MSI
MSI is a promising technique for sample surface analysis. Complimentary to other imaging approaches, MSI advantageously allows label-free or isotopically labeled species detection, high chemical specificity, high accuracy, and broad analyte coverage. The ability of MSI techniques in combination of the chemical specificity and spatial analysis of surfaces allows the analyst to obtain spatial localization of several different compounds, complex biomolecules and parallel detection of multiple analytes. MSI offers high sensitivity to image molecules present at very low abundance inside systems as small as cells. Current instruments are able to detect molecules in concentrations of approximately 500 attomol allowing components from a single cell to be detected.101
MSI methods provide high spatial resolution biomolecular analysis. Depending on the ionization technique used, the spatial resolution obtained varies. For instance, MALDI can be focused to the size of 10 μm in diameter,102,103 whereas ToF-SIMS routinely provides submicron spatial resolution.104,105 The new generation of mass spectrometers is capable of separating and thus detecting ions with very high mass resolution. High mass resolving power is typically used to provide spatial features which routinely are not able to be revealed with low-resolution techniques.106 The time required for analysis and imaging of sample is also considered as a crucial aspect of any imaging technique. For MSI, the image acquisition time is determined by the sample area, the desired spatial resolution, and also the repetition rate of the probe beam and generally takes minutes to quite a few hours. Due to these unique characteristics, MSI is well known as a powerful analytical tool in biological studies to measure the distribution of many classes of compounds ranging from atoms to larger intact molecules such as peptides and proteins.87,100,107
3.5 Biological sample preparation for MSI
The quality of the sample directly influences the sensitivity, reproducibility, and accuracy of the imaging experiment in MSI. Therefore sample handling and preparation is an important concern for any biological imaging study. A good sample preparation for MSI experiments needs a practical and productive procedure for routine analysis. Additionally, several important properties of samples including minimal sample contamination, sample integrity under ion bombardment, morphological preservation, and minimal redistribution of diffusible species have to be achieved in an appropriate sample preparation. Among these requirements, in particular, preserving the chemical and spatial integrity of biological samples can be
27 challenging for MSI since it has to be performed under biologically unfavourable vacuum conditions. A variety of protocols have been established for both tissue and cellular samples, the most commonly used procedures are reviewed here as below.87,108
3.5.1 Tissue preparation
MSI protocols for tissues commonly require steps in which the tissue samples are fixed, sectioned, mounted, and/or dried. Cellular samples are also fixed and then analyzed in a frozen hydrated state,108,109 which will be discussed in more detail later in the cell preparation section.
To minimize sample degradation or delocalization and also to keep the sample stable under high vacuum, fixation needs to be applied on tissue samples immediately after dissection and also on cellular samples after removal from culture media. Traditional chemical based fixation procedures, which influence the location of ions and molecules, thereby change the natural cell chemistry and should be avoided especially for lipid-based analysis.110-112 In contrast, cryofixation methods which involve plunge freezing, high-pressure freezing, and possibly subsequent freeze-drying are able to preserve the integrity of the tissue samples gaining great interest for IMS techniques. In plunge-freezing, the tissue sample is submerged in liquid propane at -185°C and subsequently transferred and stored in liquid nitrogen or in a -80 °C freezer. In high-pressure freezing, the sample is pressurized to 2000 bar in a small container and at the same time the outer surface of the container is cooled with a jet of liquid nitrogen. The freezing process in both methods is so fast that amorphous ice is formed from the water content on the surface of the specimen. This is advantageous since the formation of ice crystals leading to molecular and morphological displacement is considerably remedied in plunge-frozen samples thereby structural damage of the sample can be prevented.110,113
After freeze-fixation, tissue samples are brought to -20º C and sliced into 5-15 μm thick using a cryomicrotome. The tissue section is then thaw-mounted on a conductively coated glass or metal sample plate. Prior to MSI analysis, tissue sections are freeze-dried in which the water content of the sample is gradually sublimated and then brought to room temperature and dehydrated under vacuum conditions (mbar). Freeze-drying is an acceptable procedure for the preparation of tissue samples where fine spatial resolution is not needed.112,114
In addition to cryomicrotoming, there are other protocols widely used for surface preparation of tissue samples including freeze fracture, frozen hydrated analysis, etching by temperature, or etching with a defocused etching gun such as C60+ or low energy Ar gas cluster ion beam
28 (GCIB). These are also used for cellular samples109,115 and are discussed in cell preparation section.
3.5.2 Cell sample preparation
Different methods of plunge-freezing combined with freeze-fracturing and frozen hydration are widely used for cultured cells.116-118 In particular, frozen hydrated sample protocols for the MSI analysis of cells, first described by Chandra and coworkers, have become the gold standard for cell-based studies.119,120
In this technique, cells are cryo-fixed via the freeze plunging method, which was described above. Samples are then analyzed without drying while they are kept frozen by a liquid nitrogen cooled stage throughout the analysis. Cell morphology and spatial integrity of diffusible molecules are preserved with this method.Moreover, a significant enhancement of the molecular ion signal, especially for phospholipids, has been revealed using the frozen-hydrated sample preparation procedure due to the reduction of damage accumulation in liquid nitrogen temperatures. Also, the condensed water matrix covering the surface of the sample can act as a proton source to protonate and to enhance the signals of protonated ion species. In the freeze-fracture procedure, the samples are plunge frozen while being sandwiched onto two silicon shards which are opened in the instrument under vacuum.121 Subsequently, the fractured and fresh surface of the sample is exposed to analysis. The protocol eliminates human and external influences protecting the sample from possible environmental contamination. Furthermore, the method can also be used in subcellular studies fracturing of the inner sections of the cells is possible, although achieving a consistent, reliable and reproducible fracture plane is an issue here and this hinders the analysis.Accordingly, some alternative strategies including etching by use of a slightly elevated temperature or sputtering with cluster ion guns can be used to overcome the topographic problems observed with freeze fracture. In etching by temperature, the temperature is gradually increased to a critical point so that the top layer of condensed water is slowly sublimed revealing the biological sample below. When sputtering with a C60+ gun or Ar GCIB is used, the water overlay from the
sample is removed without damaging the subsurface. These two methods help flatten the sample surface and thereby remedy the topographic problems. With these methods, it is also possible to preserve sample morphology and keep the sample from environmental contamination, although the sample handling is complicated and time-consuming for these procedures.109,115
29
3.6 Pitfalls of MSI
Compatibility of the samples with room temperature as well as high vacuum that is usually used with MSI experiments is important. Unfortunately, some molecules are very sensitive and easily degraded at room temperature in a couple of minutes. In essence, there is the possibility of molecular diffusion in all types of sample treatments at room temperature, which negatively influences spatial resolution, data reproducibility, and the quality of the images. The sample preparation process should therefore be very fast, and not expose the samples to the air, moisture, or high temperature. There are various compounds present in biological tissue sections such as matrix ions, lipids, proteins, oligonucleotides, carbohydrates, and salts which can unfavorably impress efficiency of desorption and ionization and also inhibit the optimal detection. This phenomenon, called ion suppression, in which the ionization process is less efficient causes reduction the quality of the MSI analysis.87,122
3.6.1 Resolution and Sensitivity
In general, there is a trade-off between lateral resolution and the number of ions generated. This is considered to be the main analytical issue for analysis limitations in instrumental work at the cellular level. At high lateral resolution, there is a significant decrease in the number of available analytes to be ionized and detected. In other words, lateral resolution is increased at the cost of sensitivity. However, there have been some surface treatment methods developed to improve sensitivity which 109 will be discussed in more details later in this thesis.
In this thesis, I mainly focused on the use of two common techniques of MSI including MALDI and SIMS in biological samples studies. In the following two chapters, I will discuss these innovative analytical techniques, strengths, weaknesses, and current efforts to address the main challenges in this area.
30
4. Matrix Assisted Laser Desorption Ionization (MALDI)
MALDI is a soft ionization laser-based method applied in mass spectrometry. It has been known as one of the most powerful methods for analysis and detection of a wide range of biomolecules from several hundred to several tens of thousands of Daltons, which covers a variety of biomolecules including intact lipids, peptides, proteins, and polymers.87
4.1 Principles of MALDI
The combination of a matrix and laser desorption is the main characteristic of MALD. As illustrated in Figure 4.1, sample to be analysed is first coated with a thin homogeneous layer of a matrix, typically a low molecular weight organic acid. In this step, the matrix application on the sample surface plays a key role for the soft ionization of the analyzed biomolecules. In fact, a large amount of the proper crystallized matrix molecules is mixed with the analyte at a molar matrix to analyte ratio of 103-105:1. By vaporization of solvent, the biomolecules from the sample surface are co-crystallized with matrix and extracted which forms analyte-doped matrix crystals.87,123
The matrix crystals containing analyte are irradiated with a pulsed laser and the matrix molecules absorb the majority of the laser energy. The absorbed energy of the laser with the matrix/analyte mixture causes desorption of the analyte molecules into the gas phase. Moreover, in the gas phase the organic matrix molecules aid the ionization of analytes via some chemical and physical ionization mechanisms. These mechanisms include excited state proton transfer, gas-phase photoionization, and ion-molecule reactions. Among the known mechanisms, ion formation through proton transfer in the solid phase before desorption or in the gas-phase is the most recognized. Here, matrix serves as a proton donor or acceptor ionizing the gas analyte molecules to form molecular ions commonly in the singly charged state. Proton transfer between the matrix and the analyte yields protonated ([M+H]+) or deprotonated ([M-H]-) ions from neutral analyte molecules [M]. The resulting ions by protonation are detectable in positive ion mode and the deprotonated species can be identified in negative ion mode. Analytes can also form adducts with salts ([M+Na]+) through cation transfer. Furthermore, some multiply charged ions and a lot of fragments can be usually detected, although as MALDI is a soft ionization technique, still little fragmentation of
31 molecules occurs during ion formation. Typically as the analyte must be incorporated into the matrix crystals causing a complete separation of analyte from contaminants in the solid phase, this makes MALDI less sensitive to contaminants such as salts, buffers and detergents compared to other ionization techniques. A high concentration of contaminants such as buffers can, however, have a negative effect on the desorption and ionization steps. In order to eliminate this effect from contaminants, prior purification is typically carried out.87,91,124
Figure 4.1 Principle of MALDI ionization: the formation of ions during MALDI. Image reproduced with permission from Chughtai et al.87
4.2 Spatial resolution in MALDI imaging
Spatial resolution is governed by the distance between two pixels, and generally defines the quality of images. The commercial MALDI instruments that are currently available can provide a typical spatial resolution about 10 μm, which is the minimum achievable laser beam size in MALDI. In fact a high spatial resolution (<10 μm), which is indeed desirable for biological imaging down to cellular level, is not practically attainable.125 Therefore, the spatial resolution can be one of the major challenges in MALDI imaging for biological applications. In essence, the spatial resolution in MALDI is practically determined by the spot size of laser and the matrix crystal size. Modification of any of these two parameters can help to improve