The intention to cycle: A comparative
study of the perceptions and attitudes
of cyclists and non-cyclists
James O’H
ARE
A thesis submitted for the degree of Doctor of Philosophy
in the
School of Engineering
N
EWCASTLE
U
NIVERSITY
Abstract
This research aims to inform policy to increase utility cycling which, it has been suggested, delivers health benefits alongside reduced congestion and improved quality of life. Previous quantitative research has addressed measurable aspects of journeys (e.g. travel time and cost) for use in transport models and scheme
evaluation, while qualitative research has helped identify other important issues (such as attitudes and perceptions). However, further research was required, in
particular further investigation of differences between the attitudes of those that cycle and those that currently do not. This study addresses this research gap by i) collecting individual level responses from a large cross-sectional sample sample (n=3807) of cyclists and non-cyclists about their attitudes and perceptions while ii) addressing journeys beyond the commute and iii) combining this data with an objective measure of the cycling environment in order to increase current knowledge on factors
influencing the decision to cycle. Data were collected in two waves (September 2015 and February 2016). Descriptive analysis is used to explore the responses to
attitudinal statements while path modelling, within which the statements are grouped into theory-led constructs, helped elucidate issues influencing the intention to cycle. As the first to apply Partial Least Squares - Structural Equation Modelling using a relatively large sample to cycling specific research, this study contributes to the application of Structural Equation Modelling methods in this field. The path
modelling performed best for more frequent cyclists, identifying convenience as the most important construct for this group. Attitudes towards cycling were found to be the most important for non-cyclists. Both descriptive and path modelling analyses found issues surrounding safety while cycling on the road and personal security to be more important for female respondents. Although all groups had generally poor perceptions of the cycling environment, male cyclists were more likely to have positive perceptions with female non-cyclists most likely to have negative perceptions.
Segmentation analysis identified four classes which can be compared to Geller’s ‘Four Types of Cyclist’. However, the newly proposed cateogrisation separates out those that are ‘interested but concerned’ from ‘concerned cyclists’ highlighting that many existing cyclists may be cycling despite their concerns rather than because of their positive perceptions. This can be seen in both the results of the attitudinal and path
concern for all groups, the perceived convenience of cycling is also revealed to be important relative to other aspects and thus it is recommended that policies addressing this issue are brought forward. The issues which most affect female cyclists must be addressed to achieve the gender balance in participation levels seen in countries with high levels of cycling.
Acknowledgements
I would like to thank the Engineering and Physical Sciences Research Council
(EPSRC) and the Department for Transport (DfT) that provided funding for the PhD Studentship. I would also like to thank Dr. Neil Thorpe, Dr. Anil Namdeo and Prof. Margaret Bell for their help and supervision and the DfT staff who provided guidance across the research project – particularly Andrew Scott.
Finally, I would like to thank my friends and family for their support and putting up with me through the ups and downs. I would especially like to thank my dad and Anna, my wife. I couldn’t have done this without you.
Contents
Abstract iii Acknowledgements v 1 Introduction 1 1.1 Aim . . . 1 1.2 Benefits of Cycling . . . 1 1.3 International Context . . . 31.4 Cycling in England: historical trends . . . 5
1.4.1 UK Data Sources . . . 6
1.4.2 Trends in the 20th Century . . . 7
1.5 The Impact of Cycling Policy in the UK . . . 9
1.5.1 False Starts . . . 9
1.5.2 The National Cycling Strategy and Cycling and Walking Invest-ment Strategy . . . 10
1.5.3 Geographical Variation . . . 12
1.5.4 Social Variation . . . 13
1.5.5 Male Female Variation . . . 14
1.6 Objectives . . . 14
2 Literature Review 17 2.1 Introduction to Literature Review . . . 17
2.2 Literature search plan . . . 17
2.3 Determinants of Cycling . . . 18
2.4 The Built and Natural Environment . . . 19
2.5 Beyond the Built Environment — Individual Level Factors . . . 23
2.5.1 Journey distance . . . 24
2.5.2 Attitudes and motivations . . . 25
2.5.3 Social Environment . . . 26
2.5.4 Political environment . . . 27
2.5.5 Gender and age . . . 27
2.5.6 Fitness and mobility . . . 28
2.5.7 Family and work . . . 28
2.7.2 Theory of Planned Behaviour . . . 31
2.7.3 Responses to the Theory of Planned Behaviour . . . 32
2.7.4 Summary of analytical frameworks . . . 33
2.8 Quantifying Attitudes . . . 34
2.9 Exploring relationships between variables . . . 35
2.9.1 Regression . . . 36
2.9.2 Factor Analysis and Principal Component Analysis . . . 36
2.9.3 Importance-Satisfaction Analysis . . . 37
2.9.4 Structural Equation Modelling . . . 37
2.10 Methods; Summary and Conclusion . . . 40
3 Data Collection and Methods 43 3.1 Pilot Focus Groups . . . 43
3.1.1 Setup . . . 43
3.1.2 Focus Group Results . . . 44
3.1.3 Focus Group Discussion . . . 47
3.2 Survey Design . . . 47
3.2.1 Quantifying the Cycling Infrastructure . . . 48
3.2.2 Quantifying Cycling Frequency and Intention to Cycle . . . 51
3.2.3 Demographic Questions . . . 53
3.3 Pilot Survey . . . 53
3.3.1 Pilot Survey Launch . . . 54
3.3.2 Pilot Survey Results . . . 54
3.3.3 Lessons Learned from the Pilot . . . 55
3.4 Building and Testing the Model . . . 56
3.5 Statistical Software . . . 58
3.6 Quality Checks . . . 58
3.6.1 Data Quality . . . 58
3.6.2 Shapiro-Wilks Normality Test . . . 59
3.6.3 Representativeness . . . 60 3.7 Hypothesis Testing . . . 60 3.7.1 Mann-Whitney U Test . . . 60 3.7.2 Kruskal-Wallis Test . . . 60 3.7.3 Conover-Iman Test . . . 61 3.7.4 Chi-Squared Test . . . 61
3.7.5 Spearman’s Rank Correlation Test . . . 61
3.8 Partial Least Squares Structural Equation Modelling (PLS-SEM) . . . 61
3.8.1 Partial Least Squares - Multigroup Analysis (PLS-MGA) . . . 61
3.8.2 Response Based Unit Segmentation (REBUS) . . . 62
3.9 Validity Tests . . . 63
4 Respondent Characteristics 67 4.1 Introduction to Respondent Characteristics . . . 67
4.2 The Main Survey . . . 68
4.2.1 Attitudinal Statements . . . 68
4.2.2 Statement Development . . . 68
4.2.3 Data Collection Waves . . . 70
4.2.4 The Population and Sampling . . . 70
4.3 Data processing and analysis . . . 74
4.3.1 Normality tests . . . 74
4.3.2 Socio-economic Group . . . 75
4.3.3 Place of Residence . . . 76
4.3.4 Cycling Behaviour . . . 79
4.3.5 Gender, age and ethnicity . . . 84
4.4 Further respondent characteristics . . . 86
4.4.1 Mobility . . . 86
4.4.2 Physical activity . . . 87
4.4.3 Bicycle ownership . . . 88
4.4.4 Car ownership . . . 89
4.4.5 Travel Behaviour . . . 90
4.4.6 Employment Status and Job Type . . . 92
4.4.7 Commute . . . 94
4.5 Summary and Discussion . . . 95
5 Analysis of Attitudinal Statements 97 5.1 Introduction . . . 97
5.2 Intention to Cycle . . . 97
5.2.1 Leisure and Utility Cyclists . . . 100
5.2.2 Stages of Change among Non-Cyclists . . . 100
5.3 Perception of the Environment . . . 101
5.3.1 Overall Perceptions of Journey Quality . . . 102 5.3.2 Perceptions about specific elements of the cycling environment . 112
5.4 Soft Factors . . . 126
5.4.1 Attitudes towards Cycling . . . 126
5.4.2 Convenience of Cycling . . . 130
5.4.3 Subjective Norm . . . 133
5.4.4 Perceived Behavioural Control . . . 136
5.4.5 Attitudes Towards Cars . . . 138
5.4.6 Working and the Workplace . . . 139
5.5 Summary of findings from attitudinal analysis . . . 141
6 PLS-SEM Development and Analysis 145 6.1 Analysis Approach . . . 145
6.1.1 Theory-led Approach . . . 146
6.2 Model development . . . 146
6.2.1 Attitudes Towards Cycling . . . 148
6.2.2 Perceived Behavioural Control . . . 151
6.2.3 Subjective Norms . . . 152
6.2.4 Safety . . . 153
6.2.5 Coherence and Directness . . . 155
6.2.6 Comfort and Attractiveness . . . 157
6.2.7 Journey Quality . . . 160
6.3 Improving Model Performance . . . 161
6.3.1 Iteration Two . . . 163
6.3.2 Iteration Three . . . 165
6.3.3 Iteration Four . . . 167
6.3.4 Iteration Five and Iteration Six . . . 169
6.4 Analysis of the final model . . . 171
6.4.1 Analysis of Upper and Lower Band Models . . . 175
6.4.2 REBUS Analysis . . . 177
6.4.3 Sub-group analysis . . . 182
6.4.4 Gender comparison . . . 183
6.4.5 Age Comparison . . . 183
6.5 Conclusion . . . 184
7 Discussion and Conclusion 187 7.1 Findings from Attitudinal Analysis Results . . . 188
7.2 Findings from PLS-SEM Results . . . 189
7.2.1 PLS-SEM and CB-SEM . . . 191
7.3 Bringing the strands of analysis together . . . 194
7.3.1 Safety . . . 194
7.3.2 Subjective Norm . . . 195
7.4 Conclusion . . . 196
7.5 Policy recommendations . . . 198
7.6 Recommendations for further research . . . 199
A Questionnaire for Main Survey as Appendix 201
List of Figures
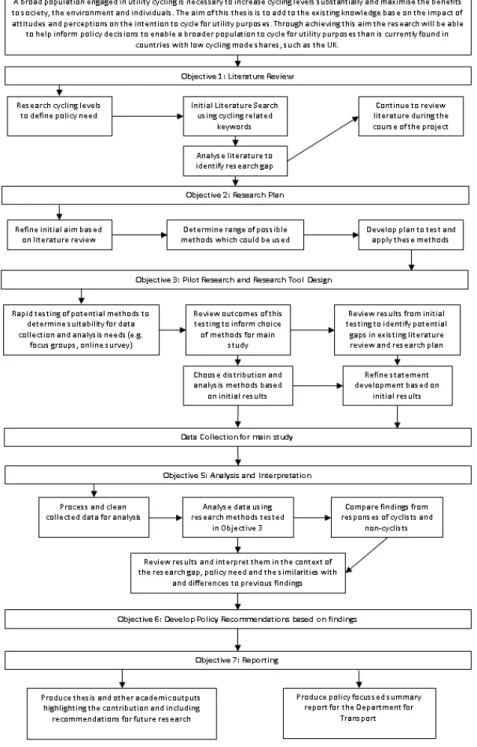
1.1 Flow chart showing research stages based on objectives . . . 15 3.1 Summary of the Iteration Process used to Develop the Final Model . . . 57 4.1 Correlation coefficients for measures of cycling - Wave 1 (September) . . 80 4.2 Correlation coefficients for measures of cycling - Wave 2 (February) . . . 81 4.3 Correlation coefficients for measures of cycling - Mainly leisure . . . 82 4.4 Correlation coefficients for measures of cycling - mainly utility . . . 83 5.1 Confidence a journey in the local area would be safe - by cycling level . 103 5.2 Confidence a journey in the local area would be safe for 11-16 year old
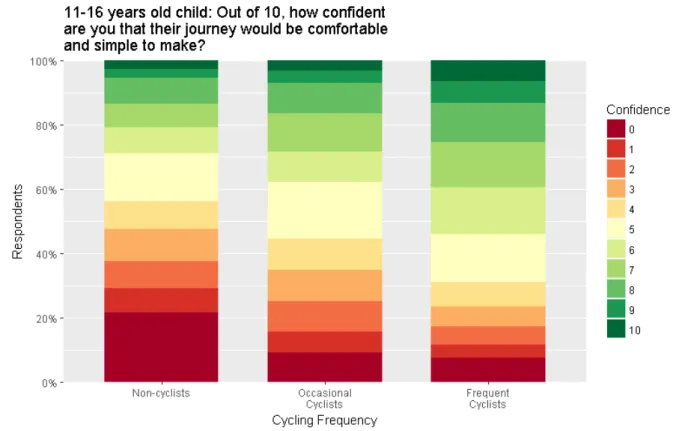
child - by cycling level . . . 104 5.3 Confidence a journey in the local area would be comfortable and simple
to make - by cycling level . . . 108 5.4 Confidence a journey in the local area would be comfortable and simple
for 11-16 year old child - by cycling level . . . 109 5.5 Pattern of Responses for Statements Relating to Safety (full data set) . . 113 5.6 Pattern of Responses for Statements Relating to Coherence and
Direct-ness (full data set) . . . 118 5.7 Pattern of Responses for Statements Relating to Comfort and
Attractive-ness (full data set) . . . 122 5.8 Pattern of Responses for Statements Relating to Attitudes Towards
Cy-cling (full data set) . . . 128 5.9 Pattern of Responses for Statements Relating to Convenience of Cycling
(full data set) . . . 132 5.10 Pattern of Responses for Statements Relating to Subjective Norms (full
dataset) . . . 135 5.11 Pattern of Responses for Statements Relating to Subjective Norms
(Sec-ond Wave Only) . . . 136 5.12 Pattern of Responses for Statements Relating to Perceived Behavioural
Control (full dataset) . . . 137 5.13 Pattern of Responses for Statements Relating to Attitudes Towards Cars
6.1 Circle of Correlations - All Attitudes Statements . . . 149
6.2 Circle of Correlations Chart: All Convenience Statements . . . 150
6.3 Circle of Correlations Chart. All Perceived Behavioural Statements . . . 152
6.4 Circle of Correlations - All Subjective Norms Statements . . . 153
6.5 Circle of Correlations - All Safety Statements . . . 154
6.6 Circle of Correlations - Safety Statements (S48 removed) . . . 155
6.7 Circle of Correlations - All Coherence and Directness Statements . . . 156
6.8 Circle of Correlations - All Comfort and Attractiveness Statements . . . 158
6.9 Circle of Correlations - Comfort Statements Only . . . 159
6.10 Circle of Correlations - All Journey Quality Statements . . . 160
6.11 Summary of the Iteration Process used to Develop the Final Model . . . 161
6.12 Path Diagram for final model based on combined dataset of Upper and Lower Band used for model development . . . 172
6.13 Importance-Satisfaction Matrix for Upper Band Respondents Based on Final Model . . . 176
6.14 Importance-Satisfaction Matrix for Lower Band Respondents based on Final Model . . . 177
List of Tables
1.1 Bicycle Mode Share – All Journeys . . . 3
1.2 Fatality rates and non-fatal injury rates in the Netherlands, Denmark, Germany, the UK and the USA (2004–2005) Expressed relative to Nether-lands figures . . . 4
1.3 Implied mode share from trip based UK targets included in 1996 Na-tional Cycling Strategy . . . 11
1.4 Local Authority districts with 10% or more commuting journeys made by bike in both 1981 and 2011 Census . . . 12
2.1 Summary of advantages and disadvantages of frameworks and meth-ods considered within the literature review . . . 41
2.2 Summary of advantages and disadvantages of methods for exploring relationships between variables . . . 42
3.1 Summary of Validity Tests applied to test the performance of the refined model . . . 66
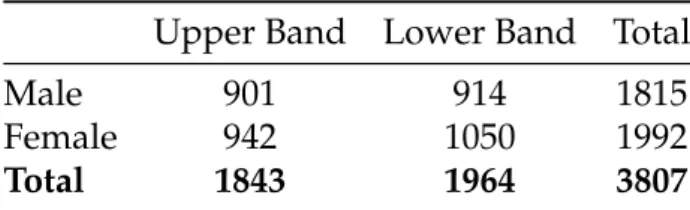
4.1 Number of completed responses before data cleaning by data collection waves for Upper and Lower band . . . 70
4.2 Survey statements used with all respondents . . . 73
4.3 Questions relating to respondents’ perceptions of safety for themselves and for a hypothetical child . . . 73
4.4 Additional survey statements used only with respondents who were in work and who had a fixed workplace . . . 74
4.5 Additional survey statements used only with respondents who had driven within the past year . . . 74
4.6 Example normality test output for the responses to Statement S1 . . . 75
4.7 Expected and actual respondent numbers by Government Region for the complete dataset . . . 78
4.8 Respondents grouped by urban/rural area type (Greater London grouped separately) . . . 79
4.9 Number of responses by gender for Upper and Lower band . . . 84
4.10 Summary Statistics for Gender Representation . . . 85
4.14 Proportion of respondents which reported mobility issues which restricted
their use of different transport modes . . . 87
4.15 Activity level classification . . . 88
4.16 Bicycle Ownership among all respondents . . . 89
4.17 Car ownership among More Frequent Cyclists (Upper Band) and Less Frequent Cyclists (Lower Band) . . . 89
4.18 Frequency of travel mode for Upper and Lower Band respondents . . . 91
4.19 Respondent Employment Status . . . 92
4.20 Respondent Employment Type (% corrected for valid responses from individuals in employment) based selection from eight options indicated. 93 4.21 Respondent employment classification based on the National Statistics Socio-economic classification (NS-SEC) . . . 94
4.22 Regular Commute Distance as Reported by Respondents . . . 94
5.1 Responses to Intention to Cycle . . . 99
5.2 Confidence a journey in the local area would be safe - by cycling level . 103 5.3 Confidence a journey in the local area would be safe for 11-16 year old child - by cycling level . . . 104
5.4 Summary statistics for perception of safety questions . . . 106
5.5 Confidence a journey in the local area would be comfortable and simple to make - by cycling level . . . 107
5.6 Confidence a journey in the local area would be comfortable and simple for 11-16 year old child - by cycling level . . . 108
5.7 Summary statistics for ‘comfortable and simple’ questions . . . 109
5.8 Summary statistics for perception of the environment – by cycling level and gender . . . 111
5.9 Responses to statements relating to ’safety’ . . . 112
5.10 Responses to statements relating to ’coherence and directness’ . . . 117
5.11 Responses to statements relating to ’attractiveness and comfort’ . . . 121
5.12 Responses to statements relating to ’attitudes towards cycling’ . . . 127
5.13 Responses to statements relating to ’convenience of cycling’ . . . 131
5.14 Responses to statements relating to ’subjective norms’ (full dataset) . . . 134
5.15 Responses to statements relating to ’subjective norms’ (Second Wave Only)135 5.16 Responses to statements Relating to ’perceived behavioural control’ . . . 137
5.18 Responses to statements relating to ’working and the workplace’ . . . . 140
6.1 Validity Tests for the First Iteration of the Model . . . 162
6.2 Validity Tests for Second Iteration of the Model . . . 164
6.3 Validity Tests for the Third Iteration of the Model . . . 166
6.4 Validity Tests for the Fourth Iteration of the Model . . . 168
6.5 Validity Tests for the Fifth Iteration of the Model . . . 169
6.6 Structural model summary for final model . . . 172
6.7 Summary of path coefficients and comparison of Upper and Lower Band Models . . . 173
6.8 Summary of retained indicators in final model . . . 174
6.9 Goodness of Fit and number of respondents for each class . . . 179
6.10 Average Variance Explained values for each construct by class . . . 179
6.11 Path Coefficients for each class from REBUS Analysis . . . 180
List of Abbreviations
ANOVA Analysis of Variance
AVE Average Variance Explained
CB-SEM Covariance Based - Structural Equation Modelling
DfT Department for Transport
ESOMAR European Society for Opinion and Market Researching
EU European Union
GHG Greenhouse Gas
GLS-SEM Generalised Least Squares - Structural Equation Modelling
GoF Goodness of Fit
GPPAQ General Practitioner Physical Activity Questionnaire
HEAT Health Economic Assessment Tool
HGV Heavy Goods Vehicle
IP Internet Protocol
ISA Importance-Satisfaction Analysis
LCDS London Cycle Design Standards
LSOA lower super output areas
MAMIL Middle-aged man in Lycra
NCS National Cycling Strategy
NS-SEC National Statistics Socio-economic Classification
NTS National Travel Survey
ONS Office for National Statistics
pct The Propensity to Cycle tool
PLS Partial Least Squares
REBUS Response Based Unit Segmentation
SEM Structural Equation Modelling
TfL Transport for London
TPB Theory of Planned Behaviour
TRID Transport Research Integrated Database
UK United Kingdom of Great Britain and Northern Ireland
USA United States of America
WebTAG Transport Appraisal Guidance
Chapter 1. Introduction
1.1 Aim
A broad population engaged in utility cycling is necessary to increase cycling levels substantially and maximise the benefits to society, the environment and individuals. The aim of this thesis is to add to the existing knowledge base on the impact of attitudes and perceptions on the intention to cycle for utility purposes. Through achieving this aim the research will be able to help inform policy decisions to enable a broader population to cycle for utility purposes than is currently found in countries with low cycling mode shares, such as the UK.
Alongside the production of this thesis, this research was also required to produce results which could inform a policy document for the Department for
Transport (DfT). The research described in this thesis was carried out independently and recommendations of the author do not constitute a policy decision by the DfT.
1.2 Benefits of Cycling
In the 2008 Climate Change Act the UK committed to reduce its Greenhouse Gas (GHG) emissions by 80% from a 1990 baseline by 2050 (Great Britain, 2008). Motorised road transport accounted for 20% of all domestic GHG emissions in 2009, this has increased as a proportion of overall emissions as other sectors have reduced their emissions levels (Statistics, 2010).
Air pollution presents a further environmental challenge with motorised transport contributing to air quality problems, particularly in city centre areas (Giles-Corti et al., 2016). While developments in the efficiency of combustion engines, pushed forwards through the European Union (EU) ‘Euro’ regulation scheme (European Environment Agency, 2013) and the development of electric cars (Bilotkacha and Mills, 2013) which do not produce vehicle-level emissions, can help to mitigate the issue, a range of solutions is needed to tackle these joint challenges. Modal shift from car to
non-motorised modes for utility journeys, such as commuting journeys or ‘trips to the shop’, is an essential element of the UK Government’s policy to meet this challenges
as stated in the Department for Transport’s Door to Door strategy (Department for Transport, 2013b).
Alongside the environmental benefits, utility cycling provides an opportunity to integrate physical activity into everyday life. Modelling by Woodcock, Givoni and Morgan (2013) has shown that increasing the level of cycling in the UK would benefit individuals, through increased longevity of life and also that the burden on the NHS would be lessened through the reduction of cardio-vascular and other diseases, such as some cancers which are linked to physical inactivity. The World Health
Organisation’s Health Economic Assessment Tool (HEAT) is intended to facilitate estimating the economic value of reduced mortality that results from walking or cycling. For example, it has been used to calculate that significant health and
economic benefits would accrue from the construction of a new cycleway (Deenihan and Caulfield, 2014).
While there are significant health benefits which can be gained from cycling it is important to acknowledge the risks. Cyclists have a relatively high risk of being killed or seriously injured per kilometre travelled in comparison to car drivers (Department for Transport, 2014a). Also, partly due to the increased rate of breathing, cyclists can be exposed to high levels of air pollution (Hartog et al., 2010). Several studies have attempted to balance the benefits against the risks from a health perspective and have concluded that the benefits outweigh the risks in most situations and that short
journeys are always beneficial except where pollution levels are extremely high (Hartog et al., 2010; Oja et al., 2011).
If programmes to increase the levels of cycling also achieve modal shift away from cars in an equitable manner, these benefits could be seen alongside reduced
congestion, improved air quality and increased mobility for those that do not have access to a car (Jones and Lucas, 2012).
In city centres where the space available to cater for current or increased levels of motor traffic and parking is limited, cycling also provides a space-efficient mode of transport. Examples of this can be seen in London where cycling levels have
increased in recent years (Aldred and Dales, 2017; Lam, 2017).
While evidence for the many benefits of increasing the proportion of journeys is constantly developing many of the key arguments are long established (Department of Transport, 1996; Department for Transport, 1999). Despite this in many developed countries cycling levels have not recovered from the post-war decline associated with the increased ownership and use of private cars (Aldred, 2010).
1.3. International Context
As the extent of the health and environmental issues becomes clear interest in cycling at a policy level has increased in recent years. It is important that policy makers and transport planners have the right evidence to ensure that the policies implemented do not repeat the mistakes of the past and enable the development of physical and social environments which enable a growth in cycling across the population, realising the potential benefits for individuals and at a societal level.
1.3 International Context
A study conducted in the United States of America (USA) and Canada by Pucher, Buehler and Seinen (2011), using data from the National Personal Transportation Survey, found a similar pattern to that described by Goodman (2013) in the United Kingdom of Great Britain and Northern Ireland (UK) census data (see Section 1.5.3, with a ‘bicycling renaissance’ having occurred in the 2000s, but again finding that the increases had been limited to a cluster of cities and towns. This study also found that the gender gap in cycling levels had actually grown where cycling mode share had increased.
The histories of Anglophone western countries such as the UK and the USA sit in contrast to the recreation of cycling cultures which has been seen in countries in continental North-western Europe such as Denmark, Germany and the Netherlands. Cycling mode share for these countries is shown in Table 1.1, with Great Britain and the USA included for comparison. The data used are from the mid-2000s and were compiled for the European Parliament.
Country Bicycle Mode Share (%)
The Netherlands 26
Denmark 19
Germany 10
Great Britain 2
USA 1
TABLE1.1: Bicycle Mode Share – All Journeys (TRT and European Parlia-ment’s Committee on Transport and Tourism, 2010)
Similar to the UK, these European countries all experienced decreases in the level of cycling in the post-war period as the transport policies moved towards the promotion of the private car, however in the 1970s the policy shifted, particularly in the
‘stop de kindermoord’ campaign in response to the death of children in road collisions and the formation of the Dutch Cyclists Union (Fietsersbond). This was supported by, and influenced, a change in transport policy moving away from catering for the car at the expense of other modes and towards developing safe and convenient bicycle infrastructure in towns and cities. Through these measures the decline in cycling levels was halted and reversed (Welleman, Ministry of Transport Public Works and Water Management and Concorde Vertalingen BV, 1999; Stoffers, 2012).
While there are variations in the level of cycling within these countries, in general the level of cycling is higher than all but a few places within the UK. The cycling
population is much more diverse, with equality between genders and high levels of cycling within older age groups (Pucher and Buehler, 2008). A key indicator of the success of the cycling policies is the safety of cycling, with incidents/km cycled providing the most appropriate and comparable measure. By this measure the
Denmark, Netherlands and Germany are generally much safer than the UK or USA as shown in Table 1.2. Cyclists Killed (per 1x10⁸km Cycled) Cyclists Injured (per 1x10⁷km Cycled) Netherlands 1.0 1.0 Denmark 1.4 1.2 Germany 1.5 3.4 UK 3.3 4.3 USA 5.3 26.8
TABLE 1.2: Fatality rates and non-fatal injury rates in the Netherlands, Denmark, Germany, the UK and the USA (2004–2005) Expressed relative
to Netherlands figures (Adapted from (Pucher and Buehler, 2008))
Pucher and Buehler (2008) summarise the importance of safety and the segregated cycling infrastructure and changes to road design which have created safe
environments in their influential work - Making Cycling Irresistible, Lessons from The Netherlands, Denmark and Germany.
"The most important approach to making cycling safe and convenient in Dutch, Danish and German cities is the provision of separate cycling facilities along heavily travelled roads and at intersections, combined with extensive traffic calming of residential neighbourhoods. Safe and relatively stress-free cycling routes bare especially important for children, the
1.4. Cycling in England: historical trends
disability. Providing such separate facilities to connect practical, utilitarian origins and destinations also promotes cycling for work, school and
shopping trips, as opposed to the mainly recreational cycling in the USA, where most separate cycling facilities are along urban parks, rivers and lakes or in rural areas." Pucher and Buehler (2008, p. 53)
Harms, Bertolini and Brömmelstroet (2015) addressed a knowledge gap in the history of the Netherlands as a cycling nation by trying to assess the relative importance of the infrastructure measures described above alongside other factors such as
demographics, land use, cycle education and governance. This study uses data collected from a survey of civil servants responsible for coordinating cycle policy and volunteers from the Dutch Cyclists’ Union (Fietsersbond). Despite the limitations of the data, which rely on the perceptions of a small number of respondents who may not be objective about their cities, this study does offer some insight on the question. The respondents were asked about their perceptions of their city’s hardware
(infrastructure), software (education) and orgware (organisation and implementation) and this information was combined with demographic and spatial data about the cities using a Rough Set Approach. This study, found that a combination of cycling infrastructure, steps to reduce the attractiveness of car use and strong leadership and organisational structures was important in cities which had higher levels of cycling. Additionally, this study found links between educating children about the benefits of cycling and providing child cycle training and a high perception of safety and citizen participation in policy. The provision of cycle education programmes for adults was associated with a good perception of cycling conditions. The paper also notes the difficulty of generalising the findings, especially on the importance of educating adults, to other locations which do not have an established cycle culture and practice. This is particularly relevant to the UK as ‘smarter measures’ such as cycle training for adults have become increasingly popular since a change in emphasis in the early 2000s (Golbuff and Aldred, 2012).
1.4 Cycling in England: historical trends
In order to set the background for this research on barriers and attractors for current cyclists and non-cyclists it is useful to place the current UK cycling landscape in an historical context.
1.4.1 UK Data Sources
There are a number of data sources that provide useful historical data on cycling. The three most commonly used are the National Travel Survey (Department for Transport, 2016c), the Local Area Walking and Cycling statistics (Department for Transport, 2016b), and the Census data on the method of travel to work(Office for National Statistics, 2014).
Census: This is carried out every 10 years (each year ending with a 1). The data are held by the Office of National Statistics. The census provides an excellent resource which includes a question on usual method of travel to work. It provides high geographical and demographic resolution, with excellent population coverage, including for hard to reach groups. However, it is only an occasional snapshot of behaviour, with a low frequency of collection and it does not include cycling as part of a journey.
National Travel Survey (Department for Transport, 2016c): This provides comparable data on how and why people travel. Data are available from 1995/7 onwards on an annual basis. This survey allows a comparison of cycling levels since the launch of the National Cycling Strategy in 1996 (Department of Transport, 1996). The survey is carried out by Department for Transport.
Local Area Walking and Cycling Statistics (Department for Transport, 2016b):
Published out by the Department for Transport on an annual basis.
Active People Survey (Sport England, 2016): Carried out on behalf of Sport England it is designed to capture general participation in sport.
Other useful data sources includeTransport Statistics Great Britainheld by
Department for Transport (Department for Transport, 2016d) and theNational Cycle Network Annual Usage Estimate(Sustrans, 2014a) carried out by Sustrans.
Because of the unrivalled coverage, the census is a particularly important source. However, as with each source there are some problems with using census data. It is only collected every 10 years Office for National Statistics, 2011a and, with the last Census taking place in 2011, the most recent data available is 7 years old at the time of writing. However, as the question used in the questionnaire is “How do you usually travel to work?” and only the mode used for the longest distance is recorded for mixed mode journeys, it does not include people that cycle occasionally or for only part of their commute.
1.4. Cycling in England: historical trends
A more philosophical criticism of relying the Census data, when discussing levels of cycling, is that it may encourage a narrow focus on commuting while ignoring current and potential cycling journeys made for other purposes. The focus on the commute in transport planning has been criticised as commuting makes up a smaller proportion of trips made by younger people, older people and women (Department for
Transport, 2016c, Table 0611). Women are more likely to make journeys with children or chained trips (Aldred, Woodcock and Goodman, 2015) which may be more difficult to make by bike compared to ‘unencumbered’ journeys.
While it is important to acknowledge its weaknesses, the Census data provides a level of detail and historical reach which is hard to replicate using other sources. Several investigations have been conducted using Census data to explore changes in
commuting levels by bike over time (Parkin, 2003; Goodman, 2013).
As there is not one overall measure it is necessary to use different sources and so to refer to different measures of the level of cycling throughout this section. For instance, the Census data refers the usual main mode of travel for a commuting journey while the most comparable measure in the Active People survey (Sport England, 2016) is referred to as total participation time. Where possible, comparable measures are used when discussing a particular issue.
1.4.2 Trends in the 20th Century
Cycling currently accounts for 2% of all journeys in England, according to the 2015 National Travel Survey (Department for Transport, 2016c). This is a low level compared to the pre-motorway era, with levels peaking in 1949 when 37% of all journeys were made by bike (Horton, Rosen and Cox, 2007). From 1950 the level of cycling dropped steeply in the 1950s through to the mid-1970s before the decline stopped in the mid-1970s when the average distance cycled per person was around 20% of the 1950 level (Department for Transport, 2017). Following the steep decline there have been some periods of growth and other periods of a shallower decline, but the overall level of cycling has remained similar since the mid-1970s.
The National Travel Survey (Department for Transport, 2016c) allows a comparison of cycling levels since the launch of the National Cycling Strategy in 1996 (Department of Transport, 1996) which set targets the number of cycling trips to be doubled by 2002 and doubled again by 2012. Reviewing the National Travel Survey data shows that these targets were not reached, with the number of cycling trips per person down
8% since 1995/7 (see Section 1.5.2). This fall sits alongside an overall drop in the number of trips made by any mode (Department for Transport, 2016c).
An alternative measure of the level of cycling available from the National Travel Survey is distance, and there has been an increase of 26% in the distance cycled per person since 1995/7, indicating that there has been some increase in this measure since the National Cycling Strategy was released.
Indeed, while these figures suggest that there hasn’t been a significant increase in the level of cycling nationally there have been more noticeable increases in some parts of the population. Due to the size of the dataset, the Census method of travel to work data is a useful source when looking at long term trends in cycling if the aim is to compare population groups or locations. Despite the limitations of Census data, a comparison of the National Travel Survey and Census data found that there was a 0.77 correlation between the proportion of adults that choose cycling as their usual commute mode (from Census data) and the modal share of cycling as a proportion of total travel time (from National Travel Survey (NTS) data), despite commuting
accounting for only 31% of the cycling travel time reported (Goodman, 2013). Parkin (2003) used Census data from 1971 to 2001 to look at long term trends in the proportion of commuting journeys made by bike at a national level and identify patterns at a regional and district level. In this paper, Parkin concludes that there was a decline in the level of cycling to work in the 1980s, but finds no significant difference in the level of cycling between 1991 and 2001. This is interpreted as suggesting that the decline has stopped, with 2.9% of journeys to work made by bike in 2001.
Cambridge is identified as a district which has had consistently high levels of cycling, with slight growth from 1971-2001. At the same time, other districts with greater than 6% cycle mode share in 2001, such as York, Oxford and Hull, had generally seen small declines in cycling mode share since 1971.
In the same paper, Parkin (2003) notes the issues with Census data described earlier and so uses other datasets to supplement the Census data. Using estimates of the total distance cycled (DfT Transport Statistics), Sustrans and data on personal levels of cycling from the National Travel Survey, Parkin notes a contrasting pattern in which the estimated distance cycled is reported to have increased but the average level of cycling per person has decreased. While Parkin makes clear that monitoring changes could partly explain the increase in the estimate of the total distance between 1993 and 2002, it is not clear whether population growth has been considered in this comparison.
1.5. The Impact of Cycling Policy in the UK
Looking at the most recent Census data from 2011, it appears that the levelling off described by Parkin appears to have continued between the 2001 and 2011, with the proportion of working residents cycling to work reported as 2.8% in 2011 (Office for National Statistics, 2014). In a similar fashion to Parkin’s 2003 paper, Goodman (2013) conducted a detailed comparison of bike commuting using the most recent census data available at that time. In addition to the national and regional comparisons conducted by Parkin the more recent Goodman paper also used data from the Indices of Multiple Deprivation to characterise socio-economic patterning in cycling levels. In summary, these studies suggest that though there is uncertainty due to the
difficulty of consistently measuring cycling participation, the overall level of cycling has not changed noticeably at a national level since the decline in cycling levels during the 1980s.
1.5 The Impact of Cycling Policy in the UK
The study of UK cycling levels in a historical and international context shows that it cannot be taken for granted that interventions to increase cycling levels will lead to balanced cycling growth across the population, but also highlights that in countries with higher levels of cycling rates are more equal across age and gender as discussed in Section 1.3. This reinforces the importance of understanding the needs of different demographic groups to ensure that interventions to ensure that cycling interventions do not simply reinforce existing privileges without benefiting those that may benefit most from the health benefits and accessibility which cycling has the potential to provide.
1.5.1 False Starts
Golbuff and Aldred (2012) provide a historic and thematic overview of cycling policy in the UK, focussing on the post motorway period from the 1970s and finishing with an overview of the 2010 coalition Government’s early statements and actions around cycling policy. This review reveals several ’false starts’ during this period within which ambitious targets were set for increased levels of cycling but not reached despite apparent initial enthusiasm.
In their analysis of how cycling policy and actions developed Golbuff and Aldred (2012) suggest that the reason that these targets were not met is due a mismatch
between the intent to increase cycling levels and the implementation of policy to achieve this aim. From the ’false starts’ of the 1970s through to the 2000s, a repeated theme is that the ‘spend per head’ set out in the spending commitments is below the level required to meet the ambitious targets. They also draw attention to a lack of central leadership required to prioritise sustainable modes and to reduce private car usage. On the other hand, there is some optimism in the evolution of cycling as mainstream within UK policy through the establishment of the National Cycle Network and Cycling Strategies, alongside a shift in focus towards the cost
effectiveness and health benefits of cycling. Further optimism can be found in the link between areas which have increased their spend per head through short-term
schemes, such as the Cycling Demonstration towns (Cycling England, 2009), or longer term investment in the case of London (Transport for London, 2013) and an increase in cycling mode share.
1.5.2 The National Cycling Strategy and Cycling and Walking Investment Strategy Published 20 years apart, the 1996 National Cycling Strategy (NCS) (Department of Transport, 1996) and the 2016 Cycling and Walking Investment Strategy (Department for Transport, 2016a) are two of the most significant points in the integration of cycling into UK transport policy. The 1996 Cycling Strategy followed the creation of the National Cycle Network in 1995 (Golbuff and Aldred, 2012) and set out core strategies backed up by specific outputs linked to increasing cycle usage. The first Cycling and Walking Investment Strategy was released in 2016 following the integration of cycling into the Infrastructure bill for the first time and set out the vision for cycling policy in light of the increasing devolution of powers away from Westminster (Department for Transport, 2016a). The core target of the NCS was to double the number of cycle trips by 2002 and to double it again by 2012 (Department of Transport, 1996). Assuming these trips replaced trips by other modes, this would have resulted in a cycle mode share of between 7.6% and 8.3% in 2012, depending on whether trips is defined as per person or total cycle trips accounting for population change.
A paper considering these targets, published in 1997, found that segregated
infrastructure would have to be deployed on a ‘massive scale’ in order to achieve this target (Wardman, Hatfield and Page, 1997, p.132). The finding was based on a stated preference study which indicated that unsegregated infrastructure would not lead to sufficient change in mode choice. The study concluded that this infrastructure would have to be combined with significant restrictions on car use and other measures to
1.5. The Impact of Cycling Policy in the UK
1996 2012 (actual)
2012
(projected, per person)
2012
(projected, total trip)
Trips per person 20 16 80 71.8
Mode Share (%) 1.7 1.7 8.3 7.6
TABLE 1.3: Implied mode share from trip based UK targets included in 1996 National Cycling Strategy - calculated using data from ONS
popula-tion estimates, NCS and NTS data.
achieve the targets (Wardman, Hatfield and Page, 1997). These targets were not met with the number of cycle trips per person per year actually falling slightly from 20 to 16 (Department for Transport, 2013c).
A review of local cycle strategies found that local authorities had been slow to adopt the aims and best practice put forward in the NCS (Lumsdon and Tolley, 2001). The authors concluded that, given the importance of orgware (organisational structures and commitment from leadership) found in the Dutch context and the need for significant changes to meet the targets, this lack of leadership at a local level,
combined with the low level of funding provided given the changes needed made it very difficult for the ambitious targets to be met.
The 2016 Cycling and Walking Investment Strategy resets the aim of doubling the number of walking and cycling trips, with a new target date of 2025 (Department for Transport, 2016a). This medium term aim is supplemented by a longer term ambition to make cycling and walking the ‘natural choice’ for short trips by 2040. The updated target now refers to stages rather than whole trips, meaning it is difficult to establish the resultant modal share due to the amount of confounding variables, such as changes in the overall number of trips and changes in population. However, taking central population estimates the proportion of trip stages made by bike could be expected to be between 2.6% and 3.0% depending if the target is achieved, compared to 1.5% from the 2013 baseline (values calculated from data obtained in (ONS, NTS, Transport Statistics). Through achieving this target it would also be expected that the mode share for commuting journeys would be expected to double from 3% to 6%. As described by Lovelace et al. (2016, p. 12) this change is ‘substantial in relative terms’ but the level would remain ‘low compared with countries such as the Netherlands and Denmark’.
The Propensity to Cycle Tool models which commuting journeys could be moved to bike trips under different scenarios (Lovelace et al., 2016). Exploring different
scenarios using the tool highlights that many urban areas will have to have cycling levels of over 10% alongside smaller increases in rural areas for this national target to be met. The tool could help local planners translate national targets into local
aspirations, an issue which is likely to become increasingly important alongside increasing devolution.
1.5.3 Geographical Variation
Evidence suggests that though some increases in cycling levels have occurred
between the 2001 Census and 2011 Census they were not geographically widespread or evenly distributed across society, with Central London seeing the strongest growth (Goodman, 2013). Goodman (2013) had already identified Hackney as the district with the highest proportional growth between 1991 and 2001, but reported that the growth in that district to 2011 was even steeper, at 8.5 percentage points. Interestingly, many of the other districts with high levels of cycling which had seen a slight fall between 1971 and 2001 showed a slight increase between 2001 and 2011. Large increases were seen in inner London, meaning that London (2001: 2.3% 2011:3.9%) overtook East of England (3.9% 2011:3.4%) as the region with the highest cycling mode share (Office for National Statistics, 2014). However, these localised increases have not led to a national increase as cycling levels remained level or decreased in other areas of the country. It is important to understand why cycling is increasing in some areas and not others to determine future policy decisions and evaluate past choices to determine whether policy may have unintentionally helped to help the already privileged rather than helping to rebalance existing inequalities.
In order to highlight the areas which have the highest consistent levels of cycling figures for 1981 to 2011 for those districts where 10% or more of cycling journeys were made by bike in 2011 are shown in Table 1.4.
Local Authority 1981 (%) 2011 (%) Percentage Point Change
Cambridge 27.6 29.0 1.4
Oxford 20.3 17.1 -3.2
York 21.0 11.2 -9.8
Gosport 14.7 10.7 -4.0
TABLE1.4: Local Authority districts with 10% or more commuting jour-neys made by bike in both 1981 and 2011 Census – adapted from (Parkin,
1.5. The Impact of Cycling Policy in the UK
1.5.4 Social Variation
Nationally between the 2001 and 2011 censuses the proportion of working residents cycling to work remained at 2.8% (Office for National Statistics, 2014). Goodman’s 2013 socio-demographic analysis showed that cycling to work has historically been more common in less affluent areas, however she argues that this is now inverted in England’s highest-cycling areas (Cambridge, Oxford and Hackney) (Goodman, 2013). In this analysis, cyclists were more likely to live within less deprived areas of the local authority. This finding reflects a wider trend in which cycling has moved from being a poor person’s form of transport to one that is increasingly a symbol of middle class lifestyles. The extent to which this can reflect gentrification of poor areas has been discussed both in the UK and internationally (Aldred and Jungnickel, 2014; Hoffmann and Lugo, 2014). Goodman’s socio-demographic analysis showed that cycling to work has historically been more common in less affluent areas, however she argues that this is now inverted in England’s highest-cycling areas (Cambridge, Oxford and Hackney) (Goodman, 2013). In this analysis, cyclists were more likely to live within less deprived areas of the local authority. This finding reflects a wider trend in which cycling has moved from being a poor person’s form of transport to one that is
increasingly a symbol of middle class lifestyles. The extent to which this can reflect gentrification of poor areas has been discussed both in the UK and internationally (Aldred and Jungnickel, 2014; Hoffmann and Lugo, 2014).
The pattern of cycling having increased in already privileged groups is borne out in research which has been conducted to examine the potential for cycling in London. Transport for London (TfL) found that increases in the number of cycling trips in London during the 2000s was largely due to existing cyclists cycling more often rather than an increase in the number of cyclists, with the majority of frequent cyclists being within the 25-44 white male cohort and on a higher than average income (Transport for London, 2011). TfL research into the potential for cycling in London found that there was further potential for an increase in cycling levels within this demographic group, but also found that there was significant potential for growth to create modal shift across the population (Transport for London, 2010). Encouraging new cyclists is particularly important as groups with lower levels of cycling are also less likely to meet physical activity guidelines and suffer from social issues such as poor access to services (Long et al., 2009).
1.5.5 Male Female Variation
A further study of the Census method of travel to work data was conducted by Aldred, Woodcock and Goodman (2015) who reviewed proportion of commuting trips made by bicycle and also compared data for 2001 and 2011. This analysis found that, in Local Authorities where cycling mode share had increased during the 2000s, the gender gap had not reduced, with men still being twice as likely to cycle to work as women. The same study also found that there was a decreased representation of older cyclists in the cohort. This suggests that, while the numbers of female and older cyclists are increasing, the rate of increase is not quicker, and in some cases may even be slower, than the rate of increase for white males.
1.6 Objectives
The aim of this thesis is as stated in Section 1.1. In order to achieve this aim, the objectives of the project are to:
1. Review the existing literature and refine the aim to address research gaps within the available cycling literature relating to barriers and attractors to broader participation in utility cycling.
2. Develop a research plan based on the identified research gap which can add to the body of existing knowledge and provide outputs which are useful in informing policy.
3. Carry out exploratory and pilot research to refine the tools and methods
ensuring that the chosen methods are appropriate and suitable for achieving the research aim.
4. Analyse and interpret the data obtained through the research in line with the research plan and taking account of the similarities and differences compared to previous research and ensuring that the views of those that currently do not cycle are considered.
5. Reflect on the findings of the research considering their implication for both research and policy.
6. Present policy and future research recommendations relating to the impact of perceptions and attitudes on cycling behaviour based on the outcome of the analysis
1.6. Objectives
Figure 1.1 shows how the aim and objectives of for this research fit together within the overall project structure.
Chapter 2. Literature Review
2.1 Introduction to Literature Review
This literature review is split into the following sections: Sections 2.3, 2.4 and 2.5, address Objective 1 as set out in Section 1.6 The findings are summarised in Section 2.6 where the initial aims and objectives are re-focussed based on that summary. Sections 2.7 and 2.8 address potential methods and frameworks which can be applied to the identified gap while Section 2.9 evaluates various a range of multivariate
statistical techniques that may be applied to this research Section 2.10 summarises the research gap and lays out a research plan, further refining the aims and objectives initially set out in Section 1.6.
2.2 Literature search plan
This research project aims to improve our knowledge of the most important barriers and attractors to utility cycling. The literature review was conducted for two
purposes:
1. To determine what research had been conducted into the attractors and barriers to utility cycling,
2. To investigate the research gap within this area and establish both the focus and range of methods to be considered for the research.
The literature search was conducted in three stages:
1. An initial literature search was conducted at the start of the project in October 2013. This literature review was conducted through searching relevant online databases (e.g. Google Scholar, Science Direct, Web of science, Transport Research Integrated Database (TRID)) for keywords relating to cycling.
2. The initial literature review was supplemented across the course of the project through subscription to relevant journals and smaller scale searches on specific topics which arose and identification of relevant citations within papers.
3. Later in the project, in June 2016, a follow-up search was conducted. The initial search terms were reused, alongside additional terms which had been identified through a meta-analysis of the bibliography to identify the keywords which were most frequently used within the papers which had been identified as relevant to the research in terms of the methods used and the relevance of the findings. This meta-analysis was then used to supplement the original search terms.
The follow-up search and the reporting of the literature have been conducted
following the recommendations of Avni et al. (2015) which covers steps to define the scope, databases and search terms and reviewing the findings from a literature search. EndNote X7 for Windows was used to manage the bibliography throughout the project.
2.3 Determinants of Cycling
When looking at the current UK cycling levels in an historic and international context (as set out in Chapter 1) it becomes clear that there are many factors which have shaped the transport landscape we see today, such as government policy, public pressure for change and the implementation of infrastructure schemes such as those which aim to make cycling safer and more convenient while reducing the
attractiveness of the car (Pooley, Horton et al., 2013) and those which make the car a more attractive mode (Bonham, Johnson and Burton, 2015). However, beyond this overview it is important to understand the impact of the various aspects of the policy environment, physical environment and social environment which influence people’s actions alongside the importance of their individual capabilities, perceptions and attitudes.
Previous research suggests that a wide set of factors influence the intention of
individuals to cycle, and that the importance of these factors in the decision-making process can vary significantly across demographic sub-groups, most notably defined by gender (Heinen, van Wee and Maat, 2010). In order to ensure a balanced growth in cycling, it is important to consider and understand the needs of different population groups when planning interventions, whether these be through hard measures (engineering interventions, such as the installation of cycle lanes) which generally target ‘Hard Factors’ or soft measures (such as promotions or cycle training) which may also tackle ‘Soft Factors’.
2.4. The Built and Natural Environment
Hard Factors are defined as measurable characteristics such as travel time, cost and effort which are governed by the physical environment (such as route surface quality and segregation from motor traffic). Soft Factors are defined as the personal and environmental factors governed by the wider context within which the decision to cycle is made (such as attitudes compatibility with working life and the support of family and friends) (Heinen, van Wee and Maat, 2010).
2.4 The Built and Natural Environment
There is a growing body of literature which recognises that safe cycling environments and supportive cultures are valued highly, particularly by female and older cyclists (Heesch, Sahlqvist and Garrard, 2012; Sahlqvist and Heesch, 2012; Aldred, Elliott et al., 2016). These messages are repeated in recent UK design guidance, such as the Sustrans Design Manual (Sustrans, 2014b) and London Cycling Design Standards (Transport for London, 2014). It has been suggested that in countries such as the Netherlands, Denmark and Germany, investment to develop cycling networks and cultures has made cycling safe, convenient and widely accessible, which in turn has made cycling a mainstream transport mode with high levels of cycling and less variation by age, gender and income level than in Great Britain (Pucher and Buehler, 2008).
Hard Factors are often associated with the perception of safety and journey quality and have been found to influence the level of cycling in an area; it has been suggested that Hard Factors seem to have a particular influence on those groups which cycle less within the UK (as described in Section 1.5).
Design guidance documents in the UK and abroad have attempted to group these Hard Factors under sub-categories which help to summarise the most important aspects. Initially based on the Dutch CROW (CROW, 2007) guidance, the common features also included within the London Cycle Design Standards (LCDS) are
‘coherence’, ‘directness’, ‘safety’, ‘comfort’, and ‘attractiveness’. An additional factor ‘adaptability’, which is included within the LCDS (Transport for London, 2014), is not relevant in this context as it is included to encourage designers to think about how cycling infrastructure can be changed to reflect changes, such as increased demand, rather than reflecting an issue that would affect the quality for a cyclist.
1. The importance of the presence of cycling infrastructure
2. The importance of a person’s perceptions of that infrastructure and the associated perception of cycling safety (Ma and Dill, 2016).
Many studies in this area also examine elements of the physical environment which are not related directly to cycling infrastructure; for instance the built environment is studied in terms of the density of population and average travel distances to
workplaces or other destinations (Handy, Xing and Buehler, 2010). The natural environment is also often considered with studies examining the impact of the
weather (Dill and Carr, 2003) and topography (Majumdar and Mitra, 2015) on cycling levels. Again, as with cycling infrastructure, these physical elements can also relate to perceptions that these conditions can make it easy or difficult to cycle. Within the approach which looks directly at the influence of infrastructure there are three main methods for establishing the impact of infrastructure on cycling modal share and road choice at a population level.
1. Comparative Studies: A common method of establishing the importance of the presence of cycling infrastructure is to compare the length or density of cycle networks across multiple locations and determine whether this measure correlates with the level of cycling in these locations. However, there are limitations to this method as there are many other elements which may confound the situation and thus it is difficult to isolate the impact of the infrastructure.
2. Reviews Best Practice:The impact of confounding factors on studies which consider relative density leads some researchers to choose a second method which looks to acknowledge this issue and instead compares best practice, exploring common themes in successful areas.
3. Longitudinal (or Pre/Post) Studies: An alternative to both approaches is to study an individual route or area before and after the implementation of infrastructure improvements. This method also has limitations, as it is hard to account for issues such as displacement from other routes and the importance of neighbourhood networks.
Examples of each of these methods are reviewed below.
While the studies referred to above suggest that some elements of the built
environment have a strong influence on mode choice (Schoner, Cao and Levinson, 2015) state that the methods used could underestimate the impact of personal
2.4. The Built and Natural Environment
characteristics. This study found that self-selection is an important factor. This study suggests that bike lanes act as magnets, encouraging those predisposed to cycle for attitudinal reasons to live in areas with good cycling infrastructure rather than encouraging non-cyclists to change their behaviour. This research used an ordered probit Heckman selection model to deal with the issue of cycling being a rare activity within the study area Minneapolis. As with Piatkowski and Marshall (2015) this study found that different factors were significant in participation and frequency models. The conclusion that bicycle lanes act as magnets rather that catalysts is based on bivariate correlation tests not shown within the paper which suggest that the attitudinal influence is stronger among those who have recently moved home. While this may suggest, as stated, that those attitudes precede location choice, this does not account for the issue that travel behaviour is more likely to change based upon a life event such as a change of residential or work location which may lead to a mismatch between previous underlying attitudes and practical options (Bohte, Maat and van Wee, 2009) meaning that those who have recently moved house may be more likely to considering their transport choices.
Buehler and Pucher (2011) investigated the association between the length of bicycle lanes and paths on one hand and the level bicycle commuting on the other across 90 of the 100 largest cities in the USA. Incorporating other data this study found that cities with safer cycling, lower car ownership, more students, less urban sprawl, and higher petrol prices had higher levels of cycle commuting. Consistent with (Dill and Carr, 2003) they also found that higher density of cycling infrastructure was
associated with higher levels of cycling.
A study conducted in India identified similar factors to those found in European and American based studies described elsewhere within this review. Physical factors and safety related concerns were found to be important in influencing the choice to cycle (Majumdar and Mitra, 2015). This study also compared the views of experts and users’ perceptions finding that route topography was perceived to be less important to users than experts. The authors highlight that this shows the importance of comparative studies such as this in situations where users are not involved in transport planning and note that the area the study was carried out is relatively flat limiting the users’ consideration of steep hills.
When looking for examples of best practice it is common to look to Denmark and the Netherlands for the answer (Pucher and Buehler, 2008). However, it is also important to look at less developed cycling cultures such as cities in the USA and elsewhere in
Europe which have seen increases in cycle mode share in recent years. Several reviews have attempted to do this both in the academic arena and in industry to inform design guidelines. A non-peer reviewed report commissioned by Transport for London and conducted by Urban Movement and Phil Jones Associates visited case study areas across the UK, Scandinavia, Western Europe, New Zealand and the USA to examine best practice and identify common techniques and common
conditions (Urban Movement & Phil Jones Associates and Transport for London, 2014). They divide the common techniques into 5 areas: ‘Links’, ‘Junctions + Crossings’, ‘Network + Traffic Management’, ‘Interaction with Other Users’ and ‘Miscellaneous’. Based on these five areas, the document provides design guidance emphasising the importance of safe, dedicated space for cyclists within a network which is easy to navigate. The document also found that a common condition in cities which had been successful in promoting cycling was strong political leadership, which helped create a movement to promote cycling as part of an integrated approach to reducing car use. The report acknowledges the ongoing challenge and that the need to use simple and cheap methods, but insists that adequate provision of cycling infrastructure is a prerequisite for higher levels of cycling and that this requires the will to make significant changes to the streetscape. This has also been found in other documents on design guidance and best practice from countries with developed cycling cultures (Ligtermoet, 2006; CROW, 2007; Meggs et al., 2012; City of
Copenhagen, 2014) and has more recently been adopted in cycling guidance in the UK (Sustrans, 2014b; Transport for London, 2014). While these themes around the physical infrastructure and governance emerge when comparing cities which have been successful in promoting cycling, a more critical approach is required to identify the effectiveness of policy actions. A meta-analysis entitled ‘Infrastructure, programs, and policies to increase bicycling: An international review’ (Pucher, Dill and Handy, 2010) warns of the potential for bias in the use of non-peer reviewed work on the effectiveness of interventions and comments on the lack of studies which have an adequate study design to allow the impact of individual interventions and policies (or a combination thereof) to be robustly measured. Despite these caveats, the authors also conclude that cycling interventions are most successful as a part of an integrated package. They also emphasise the importance of measures to discourage or restrict car use. As already noted (section 1.3) an earlier review for which Pucher was also the lead author concluded that the most important policy measure was the
implementation of protected cycle routes on heavily trafficked roads and protection at junctions (Pucher and Buehler, 2008).
2.5. Beyond the Built Environment — Individual Level Factors
The issue of interventions to promote cycling has also been systematically reviewed by (Yang et al., 2010) who concluded that a combination of promotional activities and infrastructure interventions have the potential to increase cycling by modest amounts. The authors called for further controlled evaluative studies incorporating more
precise measures and identified areas without an established cycling culture as a priority. A systematic review of the impact of the environment on cycling found that further research on the distributional impact of cycling infrastructure was required the socio-demographic distribution of the effects on physical activity from policies promoting the construction of cycle lanes.
Other studies have used ‘pre-post’ evaluation to examine the impact of the
installation of specific pieces of new cycling infrastructure on cycling levels in that area. Some studies look just at the usage of that infrastructure while others attempt to establish the effect across a wider network. It can be difficult to account for trip
displacement (Goodman, Sahlqvist and Ogilvie, 2014; Sustrans, 2017) and establish the true effect across the network (Goodman, Panter et al., 2013). If these issues can be addressed it is a very powerful tool, acting as a ‘natural experiment’ and allowing the changes in cycling level to be directly attributed to the presence of new infrastructure. A series of studies of the iConnect programme in the UK found that bridges which provided new, safe walking and cycling links between communities were effective in increasing cycling levels (Ogilvie, Bull, Powell et al., 2011; Ogilvie, Bull, Cooper et al., 2012; Goodman, Sahlqvist and Ogilvie, 2014) though in many cases the majority of usage was for leisure, rather than utility purposes (Goodman, Sahlqvist, Ogilvie and IConnect Consortium, 2013). However, by necessity, the focus of these studies is very narrow, limiting the scope for the inclusion of broader influences.
2.5 Beyond the Built Environment — Individual Level Factors
The above sections show how population level studies have been used to study the links between built environment factors and higher levels of cycling. Most studies which look to explore differences between individuals or groups regarding
perceptions of the cycling environment tend to be more bounded in their
geographical or investigative scope in order to produce clear results about their area of focus than is possible with other methods such as the reviews of best practice. Due to this, their ability to generalise findings regarding a range of factors across wider populations can be more limited. Most studies consider either a range of route