population sex ratio. The explanations proposed by researchers include sex differentials in mortality, sex-selective abortion, and sex-selective underenumer-ation. None of these explanations has yet been generally accepted.
In this paper, I attempt to reconstruct indirectly the sex ratio of the Indian population from 1971 to 1996, basing my estimates on mortality and age-structure data from the Sample Registration System (SRS). The reconstruction of the trend in the sex ratio is prompted by two concerns. One is about the quality of the Indian census data in relation to sex structure. The extent of sex-specific underenumeration has been debated in India, particularly in the last two decades during which the population sex ratio has varied erratically. With this reconstruction, which uses an indirect approach, I aim at determining the reliability of these trends and the magnitude of the errors in the census-based estimates of sex ratio. This builds on a study of the Indian sex ratio by Griffiths et al. (2000), which did not investigate the contribution of sex-selective underenumeration to the recent trend in the population sex ratio. In particular, they did not question the rise in the population sex ratio after 1981, although this increase is the major issue at stake in the recent debate about the sex ratio.
The second concern of this paper is more substantive. It is to question the use of the population sex ratio, a use common in India and other parts of Asia, as an index of change in discrimination against females in a population. The results of the reconstruction show that, in any given year, the sex ratio of populations with little or no international migration and a constant sex ratio at birth is an average of past sex differentials in
I N T RO D U C T I O N
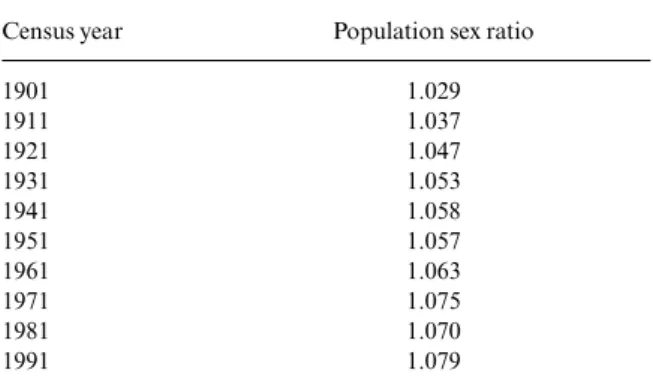
The sex ratio of the population of India (males/ females), as reported in censuses, has risen almost continuously since the beginning of the twentieth century. It was 1.029 (102.9 males per 100 females) in the 1901 census, and had increased to 1.075 by 1971. For the first time in the century, a decrease in the sex ratio was recorded in 1981, by which date it had declined marginally to 1.070. By 1991, however, the sex ratio had risen again, to reach 1.079, the highest value ever recorded (Registrar General 1992). (I use here the conventional definition of the population sex ratio. In the Indian literature the sex ratio is often defined as the female/male ratio and the debate is thus about declining sex ratios.)
Sex ratios in India are singularly high compared with most large human populations (Coale 1991). This has been attributed to the unusually high mortality of Indian females relative to their male counterparts. The excess mortality of females is believed to result from ‘discrimination against females’, a term commonly used in the Indian demographic literature to describe a set of practices that includes less favourable access to food and health care for females (Das Gupta 1987; Kundu and Sahu 1991). High sex ratios in India are taken as an indicator of the inferior position that women occupy in Indian society (Mayer 1999).
Following the results of the 1991 census, particu-larly in the columns of the Indian journal Economic and Political Weekly, there has been intense debate among demographers about recent increases in the
The dynamics of the population sex ratio in India,
1971–96
M I C H E L G U I L LOT
Abstract.This paper reconstructs the trend in the population sex ratio in India between 1971 and 1996 from available information on changes in sex differentials in mortality in the country since the beginning of the century. It is estimated that, although the mortality of females relative to that of males in India has improved since 1968, the population sex ratio increased between 1971 and 1981, stayed constant between 1981 and 1991, and started to decrease only after 1991. This implies that the recorded decrease and increase in the periods 1971–81 and 1981–91 respectively were both spurious and were the results of undercounts of females in 1971 and 1991. Another implication of this finding is that, owing to the lagged effect of past mortality on current trends in the population sex ratio, this ratio is a bad proxy for use in the study of changes in differential mortality by sex.
Printed in Great Britain
Submitted: May 2001
mortality. As such, it gives a broad idea of a country’s level of discrimination against females. However, I further show that, because of the lagged effect of past mortality on current trends in the sex ratio,changesin the sex ratio should not be taken as an index of changes in period mortality differentials by sex. Conversely, changes in period mortality by sex should not be used to draw conclusions about trends in the population sex ratio.
Recently, Griffiths et al. (2000) have presented simulations showing that persistent excess mortality of females can, over the long term, produce an increase in excess female the sex ratio of the population of India even when the excess mortality of females is falling. But they did not show the particular demographic conditions under which this phenomenon occurs. It is shown below that the apparent inconsistency, between an increase in the sex ratio despite the decline in excess female mortality, arises from the diverging evolution of mortality within cohorts and periods following a reversal in sex differentials in mortality. It does not arise from other demographic factors that are often cited, such as the demographic transition or popula-tion momentum (Mayer 1999; Griffiths et al. 2000).
There are large regional differences in the sex ratio in India (Kumar et al. 1997), especially between Northern and Southern states, with the former traditionally having higher ratios than the latter (Dyson and Moore 1983; Agnihotri 2000). Nevertheless, the focus of this paper is on trends at the national level. This is because the national trend has been the main issue at stake in discussions of the sex ratio in India and, as such, deserves particular attention. Also, the reconstruction of the sex ratio by state would be confounded by internal migration, for which no reliable data exist.
T H E D E B AT E A B O U T T H E S E X R AT I O I N I N D I A
According to the census, the population of India was already predominantly male at the beginning of the century, with a sex ratio of about 1.029 in 1901 (Table 1). One explanation often cited at that time was an undercount of females. At the end of the nineteenth century, the British authorities were already doubtful about the excess of males in the Indian population and were attributing it to concealment of females in censuses (Kanitkar 1991, p.18). This explanation, if valid, would imply that the increase in the sex ratio during the twentieth century was a result of a worsening over time in the undercount of females in the census.
The debate was influenced by a comprehensive study of the sex ratio in India from 1901 to 1961 by
Visaria (1972). Visaria considered the different possible explanations for the high sex ratio in India and concluded, convincingly, that it was due to the unusually high mortality faced by females relative to males. His conclusions have since been confirmed by the publication of reliable life tables for India, which show that, in the early 1970s, the life expectancy of females was 1.5 years lower than that of males (Registrar General 1984). Detailed mortality data from Khanna (India), Matlab (Bangladesh) and Sri Lanka also confirm the excess mortality of females in various parts of South Asia. It is now acknowledged that, although the recorded Indian sex ratio is probably biased to a certain extent by sex-selective underenumeration, the predominance of males in India’s population and the upward trend during the twentieth century are real and reflect excess mortality of females in the subcontinent.
This study focuses on recent trends in the sex ratio. As we can see from Table 1, the trend in the sex ratio became erratic after 1971. It was particularly high in 1971, when it reached a value of 1.075. This represents an increase of 1.2 per cent between 1961 and 1971, which was much larger than the increase of 0.5 per cent recorded between 1951 and 1961.
Between 1971 and 1981, however, a substantial decrease was recorded. This decrease was regarded with optimism by the Indian census bureau. Census officials commented: ‘[I]t would seem that the tendency for the sex ratio to deteriorate has been halted. (...) One of the conclusions that one could (...) come to is that probably maternal and child programmes are yielding dividends’ (Padmanabha 1981, p.6). Governmental efforts to improve literacy of females and to control sex-biased practices such as dowry deaths were also credited with helping to explain the decrease in the sex ratio. It was generally believed that 1981 was the beginning of an era in Table 1. Population sex ratio (M/F) in censuses, India, 1901–91
Census year Population sex ratio
1901 1.029 1911 1.037 1921 1.047 1931 1.053 1941 1.058 1951 1.057 1961 1.063 1971 1.075 1981 1.070 1991 1.079
which discrimination against females would decrease (Kundu and Sahu 1991).
After this enthusiasm, the increase in the sex ratio between 1981 and 1991 came as a shock, and threw doubt on the idea that discrimination had decreased. After the publication of the 1991 census results, it began to seem that, despite programmes directed towards the welfare of women, the expected improvement in their mortality had not been achieved (Mazumdar 1991).
Kundu and Sahu (1991) argued that the increase in the sex ratio was real and that it was due in part to the increasingly common practice of sex-selective abortion. Other demographers argued strongly against this hypothesis. Rajan et al. (1991) found little evidence of an increased sex ratio at birth in India during the decade and attributed the increase in the population sex ratio to the poor quality of the 1991 census. They suggested that sex-selective abortion had been advanced as an explanation owing to a reluctance to admit that the census enumeration had been poorly conducted. Srinivasan (1994) also rejected the hypothesis of an increased sex ratio at birth in India, arguing that there had been a large-scale underenumeration of females in the 1991 census. The same conclusion was reached by Dyson (1994), who contended that the recorded population growth rate had decreased too fast between 1981 and 1991 to be consistent with the fertility and mortality trends observed in the SRS data during the decade. He also noted that, when overall coverage was low in India, it seemed to be lower for females than for males. Indeed, the two censuses (1941 and 1971) for which a particularly high sex ratio was recorded were of particularly poor quality.
The debate about trends in the sex ratio since 1971 usually concerns the 1971 and 1991 sex ratios relative to that of 1981. It is widely acknowledged that the 1981 census was managed better than those in 1971 and 1991 (Dyson 1994). The 1971 census had to be entirely rescheduled at the last minute because its timing conflicted with that of an election. Instead of being conducted at the end of February, as usual, it was conducted at the end of March, which is the peak of the harvesting season in several states in India (Dyson 1981). Soon after the 1971 census, Visaria (1971) argued that post-enumeration checks and discrepancies between census counts and projected counts indicated a large undercount. Others have also argued that, relative to 1961, the undercount was particularly large in 1971 (Preston et al. 1979; Mukerji 1982).
The 1981 census results were greeted with some dismay because they suggested that population growth rate during the 1971–81 decade had been as
high as the rate during the 1961–71 decade, despite evidence of substantial fertility decline in many states (Dyson 1981). One explanation for this is that the 1981 census count was better than that in 1971, resulting in inflation of the growth rate. Consequently, some demographers have argued that the decrease in the sex ratio between 1971 and 1981 might have been due simply to a better coverage of both males and females in 1981, and thus needed to be interpreted with great caution.
The conduct of the 1991 census may have been influenced negatively by the explosive political and social climate that prevailed in many parts of the country at that time. One source of turmoil was the issue of quotas of jobs and seats in colleges on the basis of caste. Massive processions organized by Hindu fundamentalists were also a source of unrest at the time of the census (Srinivasan 1994). As in 1971, the lower overall quality of the 1991 census was confirmed by post-enumeration checks (Dyson 1994). The reconstruction of the sex ratio in this paper accepts the conclusion that the estimate of the sex ratio for 1981 is more reliable than the estimates for 1971 and 1991, and focuses on the trend in the ratio during the period 1971–96 relative to the level recorded in the 1981 census.
In spite of the intense controversy, most demographers agreed that the increase in the sex ratio after 1981 could not have been due to changes in sex differentials in mortality. Although some researchers have expressed concern that the increase in the sex ratio may reflect an increase in the mortality of females relative to males after 1981 (Sudha and Rajan 2001), there exists a body of evidence suggesting that mortality improved faster for females than for males during the 1980s (Kundu and Sahu 1991). In consequence, it was concluded that the effect of sex differentials in mortality had been to reduce the sex ratio during the period, and that explanations for its increase had to be found elsewhere. This paper shows that, in fact, these conclusions were incorrect.
The hypothesis that mortality trends during the 1980s reduced the population sex ratio has been supported by various attempts to estimate the true change in the sex ratio after 1981. Most of these attempts are based on demographic projections. Since the 1981 census counts are believed to be of acceptable quality, and independent estimates of age-specific mortality and fertility are available from the SRS for the 1981–91 period, it is simple to project the 1981 population to 1991 and examine the resulting population sex ratio in 1991. These projections all support the conclusion that the true sex ratio decreased after 1981. For example, the
Standing Committee of Experts on Population Projections estimated that the true sex ratio in 1991 was 1.062 (Srinivasan 1991). In a similar exercise, Pathak and Ram (1991) estimated that the sex ratio in 1991 was between 1.063 and 1.066.
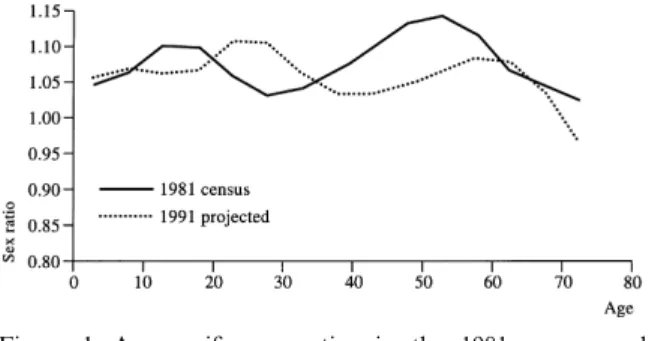
It is argued here that, because this procedure is highly sensitive to sex-specific misreporting of age in the baseline age and sex distribution, it is hazardous to apply it to Indian census data, which are sub-stantially affected by age-misreporting (Bhat 1995). Figure 1 presents age-specific sex ratios recorded in the 1981 census. The fact that they vary in an erratic way is a sign of the low quality of the 1981 census age-sex distribution. Such ratios cannot vary substantially from one age group to the next in very large populations like India’s where international migration plays a negligible role in population dynamics. Indeed, changes in age-specific sex ratios reflect changes in sex differentials in cohort mortality. Unless a war dramatically affects sex differentials in mortality for specific cohorts, the differentials vary slowly across cohorts and follow a smooth trend, even when sex differentials in period mortality vary in different directions.
These peaks and troughs in age-specific sex ratios can be due either to sex-selective undercounts or to age-misreporting. Since overall counts of males and females in India were relatively accurate in 1981, the principal source of error in the reported age-specific sex ratios must be different patterns of age-misreporting by sex.
The erratic age-specific sex ratios in 1981 impose significant problems for attempts to project the overall population sex ratio to 1991. Projecting males and females separately and examining the resulting population sex ratio is equivalent to projecting the age-specific sex ratios in 1981 to 1991 using intercensal estimates of sex differentials in mortality. As shown in Figure 1, the peaks and
troughs recorded in 1981 are shifted by 10 years of age when projected to 1991. Reflecting the pattern of peaks and troughs in 1981, the age-specific sex ratios can increase or decrease between 1981 and 1991, depending on the age groups under consideration.
The overall sex ratio of a population is the average of age-specific sex ratios, weighted by the age structure of the female population (see equa-tion 1 below). Similarly, changes in the populaequa-tion sex ratio are a function of both changes in age-specific sex ratios and changes in the age structure of the female population. The decrease in the sex ratio after 1981 arises because projected decreases in age-specific sex ratios outweigh the projected increases. In particular, the large decrease in the sex ratio between ages 10 and 20 has a large influence on the overall projected change in the sex ratio because this age group has a large weight in the population. Very large decreases are also observed at ages 35–60. Even though the proportion of people in this age range is smaller, it influences the overall projected decrease. These large decreases are somewhat attenuated by increases in projected age-specific sex ratios at ages 20–35.
It is clearly hazardous to reach conclusions about the trend in the sex ratio from such projections. In fact, this projection procedure assumes not only that the recorded overall population sex ratio is accurate, but also that the age-specific sex ratios in the baseline population are accurate. This is often a major problem. Even if only small errors exist in the age distributions of males and females, the resulting age-specific sex ratios can be highly biased if net age-misreporting occurs in different directions for the two sexes. For example, assume that the true sex ratio in the age group 15–19 is 1.060. If the number of males is inflated by 2 per cent and the number of females deflated by 2 per cent as a result of age misreporting, the observed age-specific sex ratio will be 1.103. The error would be 1.103/1.060 = 1.041, i.e., more than 4 per cent.
The analysis presented below avoids the use of recorded age-specific data from the census. In fact, it avoids all census data as far as possible in order to provide an independent check on the trend in the sex ratio. I base my reconstruction of the trend principally on evidence on levels and trends in sex differentials in mortality in India.
R E C O N S T RU C T I O N O F T H E T R E N D I N T H E S E X R AT I O
There has been some debate in India lately about the recent trend in the sex ratio at birth. Some demographers have argued that it rose significantly Figure 1. Age-specific sex ratios in the 1981 census and
projected to 1991, India.
Source: Census of India 1981.
Note: Age-specific sex ratios are projected using abridged life tables based on the Sample Registration System for 1981–85 and 1986–90.
during the 1980s, and that this was in part the reason for the overall increase in the sex ratio of the Indian population after 1981 (Kundu and Sahu 1991; Raju and Premi 1992).
While sex-preselection has been used in some parts of India, evidence that it has had an effect on the overall sex ratio at birth in the country is scarce. Because the SRS does not normally publish data on the sex ratio at birth, most information is based on hospital records. Studies based on these, including a study conducted by the Registrar General, have reported sex ratios at birth that are much higher than the traditional value of 105 male births per 100 female births (Raju and Premi 1992). It is dangerous to generalize these results because women who have access to hospital services for their delivery also tend to have easier access to sex preselection. Several studies suggest that the procedure did not become common until the 1990s and that it was prevalent only in large metropolitan areas and among wealthier and more educated classes (Visaria 1991, Gangadharan 1991). The only representative data available on the sex ratio at birth comes from the National Family and Health Survey (NFHS), but these data do not support the finding of an increase in the ratio before 1991 (IIPS 1995, pp. 324–25). (Recent data from the NFHS show that there has been an increase in the sex ratio at birth between NFHS-1 (1992–93) and NFHS-2 (1998–99), but the actual reason for the increase (more omissions of female births in NFHS-2 or a wider practice of sex-selective abortion) is still unclear (Retherford and Mishra 2001).)
In the absence of solid evidence to the contrary, the analysis presented below assumes that the sex ratio at birth in India remained 1.05 until 1996. In fact simulations indicate that the overall sex ratio up to 1996 is not very sensitive to increases in the sex ratio at birth during the 1980s; because such increases can affect only the youngest age groups in 1991 and 1996, they have a limited impact on the overall sex ratio of the population (Guillot 2000, pp.144–47).
The population of India is so large that even significant international migration flows are small in relation to it, which means that international migration is not a substantial source of demo-graphic change in the country. This paper makes the common assumption that, when studying the country as a whole, India can be analyzed as a closed population.
Assuming that the sex ratio at birth is constant and that the population is closed to migration, the population sex ratio at time tcan be estimated with the following identity:
(1)
where
SR(·,t) = sex ratio of the population at time t, cF(x,t) = proportionate age structure of the female
population at time t,
SR(x,t) = age-specific sex ratio at time t, SR(0) = sex ratio at birth,
pcM(x,t–x) and p c
F(x,t–x) = male and female
probability of surviving from birth to age x in the cohort born at time t–x(i.e., aged xat time t).
This equation is derived simply by developing an expression for SR(x,t), the age-specific sex ratio at age xand time t, in terms of the sex ratio at birth and the ratio of male to female cohort survivorship. Since SR(x,t) = M(x,t)/F(x,t), i.e., the ratio of males to females at age xand time t, we can replace M(x,t) in the equation for the overall sex ratio by F(x,t)·SR(x,t), which produces equation (1).
It follows that, if the sex ratio at birth is known, the sex ratio of the population at time t can be estimated from two factors: (i) the ratio of male to female survivorship for the different cohorts surviving to time t, which is an index of sex differentials in mortality, and (ii) the age structure of the female population at time t, which is used to weight the cohort survivorship ratios. This equality implies that, if one can provide independent estimates of these two factors, the sex ratio of a population can be reconstructed without reference to census counts of males and females.
It is important to note that the ratio
is a function of the absolute difference between age-specific death rates of males and females in each cohort during their whole life course:
(2) where µM(a,t–x+a) and µF(a,t–x+a) are the
age-specific death rates of males and females at age a and at time t–x+a(i.e., at age afor the cohort born at time t–x).
Equation (2) implies that, for instance, the ratio at age x= 65 and at time t= 1991 is a function of the absolute difference between the
p x t x p x t x cM cF ( , – ) ( , – ) p x t x p x t x a t x a a t x a da c M cF M x F ( , – ) ( , – ) exp – [ ( , – ) – ( , – )] = + +
∫
µ µ0 p x t x p x t x cM c F ( , – ) ( , – ) SR t c x t SR x t dx SR c x t p x t x p x t x dx F F c M cF (, ) ( , ) ( , ) ( ) ( , ) ( , – ) ( , – ) ⋅ = = ∞ ∞∫
∫
⋅
⋅
⋅
0 0 0mortality rates of males and females at age 0 in 1926, at age 5 in 1931, and so on. This means that to reconstruct the sex ratio at the end of the twentieth century, the mortality information required for the oldest cohorts stretches back to the beginning of the century.
Note that, while most studies of sex differentials in mortality focus on the ratio of male to female death rates, when analysing the population sex structure, it is the absolute difference between the death rates of males and females that matters, as shown in equation (2). If this difference remains constant while the overall level of mortality varies, survivorship ratios would change from year to year. The male/female ratios of age-specific death rates would vary, however. It is misleading to draw conclusions about trends in the sex ratio from an analysis of sex differentials in mortality in relative terms.
The SRS provides demographic information for India that is independent of the census. It is a dual-record system covering a representative sample of households for which local enumerators keep track of vital events. In addition, sample households are visited twice a year by an independent investigator in order to update the baseline information on the population at risk and to provide an independent check on births and deaths recorded by the enumerator. The SRS has published independent estimates of the relative age distribution of the Indian population and estimates of age-specific mortality and fertility rates for each year since 1971. The SRS data are not free of errors. Since it is based on a sample, some sampling variability exists, particularly at the state level (Bhat and Navaneetham 1991). Other errors are related to age-misreporting. In the SRS, ages of household members are calculated from the age reported in the initial survey. In the case of children born after the initial enumeration, age is calculated from date of birth. Ages at death are also based on earlier reports. While this procedure substantially improves the quality of age reports, it also carries forward the errors present in the baseline survey (Bhat 1995). Finally, errors related to under-reporting of deaths have also been detected (Bhat et al. 1984; Bhat 1987, 2001).
In spite of these limitations, it is acknowledged that the SRS provides information that has dramatically improved knowledge of mortality and fertility trends in India. Importantly, the quality of the SRS data is far better than that of the census. In fact, the SRS data are often used as a yardstick to detect age-misreporting (Bhat 1995) and underenumeration (Bhat 1998) in the census.
The reconstruction presented below uses the SRS age distributions to provide the weights needed in equation (1). It appears, however, that the choice of age distribution does not have a large impact on the final estimates of the sex ratio (Guillot 2000, pp.140–42). In reality, the ratio of male to female cohort survivorship varies little between age groups. Thus small differences in the proportion of females in different age groups have a small impact on the overall sex ratio of the population. (It is important to note that the procedure is not sensitive to errors in age distributions, because it uses age structures for only one sex. This contrasts with projection procedures described earlier, which are sensitive to differential age-misreporting by sex.)
E V I D E N C E O N S E X D I F F E R E N T I A L S I N M O RTA L I T Y
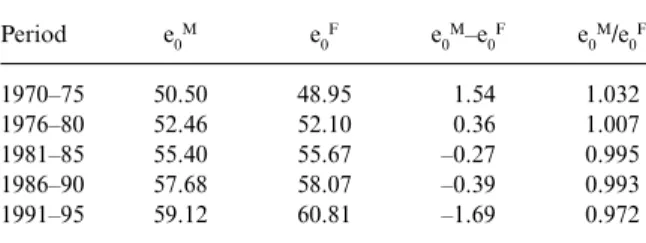
The SRS data also provide information for reconstructing cohort survivorship ratios. Table 2 shows SRS estimates of the trend in life expectancy at birth in India. Major changes in sex differentials in mortality have occurred during the period. While life expectancies have increased substantially for both males and females, females have gained more years than males. In the period 1970–75, males outlived females by about 1.5 years. The situation has now changed and females have outlived males since the early 1980s. The life expectancy of females has also improved faster in relative terms, as indicated by the declining ratio of their life expectancies during the period.
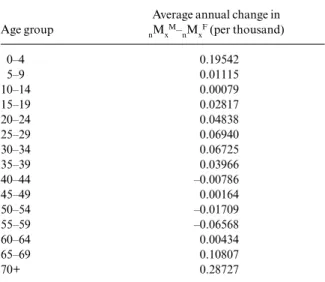
Figure 2 shows the absolute difference between girls and boys in the under-five mortality rate from 1971 to 1996. Despite year-to-year fluctuations, it is clear that the mortality rate under age five has fallen faster for girls than for boys. Data for other age groups show a similar trend (Table 3). The only age groups for which nMxM–
nMx
Fdecreased during the
period were 40–44, 50–54 and 55–59, but the declines were small in relative terms.
Table 2. Life expectancy at birth (e0) by sex, India, Sample
Registration System (SRS) Period e0M e 0F e0M–e0F e0M/e0F 1970–75 50.50 48.95 1.54 1.032 1976–80 52.46 52.10 0.36 1.007 1981–85 55.40 55.67 –0.27 0.995 1986–90 57.68 58.07 –0.39 0.993 1991–95 59.12 60.81 –1.69 0.972
Source: Registrar General 1984, 1986, 1990, 1994.
Note: The values for the 1991–95 period are estimated from the 1993 age-specific death rates of males and females.
This increase in nMxM– nMx
Fdoes not imply that the
death rates of males in 1996 were higher than those of females at all ages. At all ages below 30, the age-specific death rates of females remained higher than those of males. But the increase in nMxM–
nMx F
implies that, at these ages, the relative excess in female mortality was shrinking. After age 30, the death rates of males were higher than those of female in 1996, and the increase in nMxM–
nMx F
implies that men’s disadvantage had increased for these age groups.
A combination of sampling errors, year-to-year variability, and reporting errors probably accounts for the noise present in the data, but the upward
trend is striking and can be summarized by a linear trend in nMxM–
nMx
Fduring the period.
Evidence of a narrowing sex differential in mortality since 1971 at the national level has been often reported in the Indian literature (Dyson 1987; Bhat 1998), and it has been argued that this trend implies a continuing decrease in the sex ratio after 1981. For example, Srinivasan (1991) argued that ‘[d]emographically in a situation where the expecta-tion of life of females is rising faster than that of males, the sex ratio of the population (...) has to [decrease]’ (Srinivasan 1991, p.5). (The original text specifies ‘increase’, but the author defines the sex ratio as the female/male ratio.) Although not formulated in these terms, such reasoning is based implicitly on stationary population inferences. The sex ratio of a stationary population is simply the ratio of male to female life expectancies, multiplied by the sex ratio at birth. Therefore, a decreasing e0M/e
0
Fratio implies a decrease in the sex ratio of
the ‘stationary equivalent’ population.
Figure 3 reconstructs survivorship ratios in the ‘stationary equivalent’ population in 1971, 1981, 1991 and 1996 implied by the SRS period life tables (艎xM/艎
x
F). According to these life tables, the
survivorship ratios in the ‘stationary equivalent’ population decreased at all ages after 1971.
It can be misleading to make inferences from stationary population analysis when rates are changing. As equation (2) shows, the survivorship ratios in cohorts for a given year are not only a function of sex differences in mortality in that specific year. The ratios are also a function of mortality in earlier years. To understand how mortality change affected the population sex ratio of India after 1971, it is necessary to have information about sex differentials in mortality before 1971.
Unfortunately, in contrast to the wealth of mortality data for periods after 1971, there is a paucity of data for periods before 1971. Before the creation of the SRS, mortality estimates for India Figure 2. Absolute difference between boys’ and girls’ under-five
death rates, 5M0M– 5M0
F, India, Sample Registration System,
1971–96, per thousand.
Source: Annual life tables based on the Sample Registration System.
Note: The dotted line corresponds to the linear trend in the recorded data.
Table 3. Average annual change in the difference between age-specific death rates of males and females (nMxM–
nMx F), India,
1971–96, SRS
Average annual change in Age group nMxM– nMx F(per thousand) 0–4 0.19542 5–9 0.01115 10–14 0.00079 15–19 0.02817 20–24 0.04838 25–29 0.06940 30–34 0.06725 35–39 0.03966 40–44 –0.00786 45–49 0.00164 50–54 –0.01709 55–59 –0.06568 60–64 0.00434 65–69 0.10807 70+ 0.28727
Note: Regressed from SRS annual age-specific death rates.
Figure 3. Period survivorship ratios (艎xM/艎
xF), India, life tables
based on the Sample Registration System.
were based almost entirely on age distributions provided by the census, and are therefore not completely independent of it. However, even if we have no precise estimates of mortality before 1971, there is evidence about the probable direction of the trend in sex differentials.
The secular increase in the population sex ratio itself provides clues about earlier trends in sex differentials in mortality. It seems unlikely that the secular increase was the result of a gradual deterioration in the enumeration of females relative to that of males in India (Visaria 1972). Similarly, migration or changes in the sex ratio at birth are implausible explanations. The most plausible explanation is that the secular increase was a consequence of a continuous increase in the mortality of females relative to that of males from the beginning of the century.
It is sometimes argued that the sex ratio of the Indian population increased during the twentieth century in part because of improvements in the overall level of mortality (Dyson 1987; Drèze and Sen 1995), independently of changes in sex differentials in mortality. It is true that a decline in the level of mortality typically produces a change in the absolute difference between the age-specific death rates of males and females and thus can have an impact on survivorship ratios even if the ratioof the rates stays constant. But this ‘mortality decline’ effect does not always result in sex ratio increases. As a general rule, it tends to minimize deviations from equilibrium, i.e., it tends to increase population sex ratios that are unusually low, and to decrease sex ratios that are unusually high. In India, because the death rates of males have been typically lower than those of females at ages below 30, an overall mortality decline without change in the ratio of male/female mortality would have tended to decrease the population sex ratio. Thus if mortality decline itself did not contribute to the increase in the recorded sex ratio, the explanation must be
found in an increase in the excess mortality of females – both absolute and relative. (At older ages, when the mortality of males exceeds that of females, a reduction in the overall level of mortality could have the effect of increasing the sex ratio. But this effect is negligible for two reasons: (i) The sex ratio at older ages is also affected by mortality at younger ages, when its dominant effect is to decrease the ratios, and (ii) The proportion of people at ages below 30 (when only the narrowing effect is operating) is much larger than the proportion of people at older ages.)
The view taken here of the trend in sex differentials in mortality has been supported by various mortality estimates for the pre-1971 period. While these estimates do not provide us with an independent check of the long-term increase in the sex ratio, since they are almost all derived from the census, they do show how plausible increases in the recorded sex ratio coincided with differential improvements in male and female mortality.
Table 4 presents official estimates of life expectancy at birth for males and females since the beginning of the century. These estimates should not be taken at face value, but rather as a broad indication of the direction of the trend.
They suggest that, at the beginning of the century, females outlived males, as is the case in most populations. During the century, however, females progressively lost their advantage as the life expectancy at birth of males improved more rapidly during successive intercensal periods. The faster improvement in the life expectancy of males until the 1960s applied to both absolute and relative gains.
These intercensal mortality estimates are biased by such factors as changes in census coverage, age misreporting, and migration. In order to improve them, Bhat (1998) undertook a reconstruction of mortality trends for the pre-1971 period. He first compared SRS data and census-derived mortality Table 4. Estimates of life expectancy at birth (e0), males and females, India, 1901–70
Official estimates Bhat’s estimates
Period e0M e 0 F e 0 M–e 0 F e 0 M/e 0 F e 0 M e 0 F e 0 M–e 0 F e 0 M/e 0 F 1901–1910 22.6 23.3 –0.7 0.970 1911–1920 19.4 20.9 –1.5 0.928 1921–1930 26.9 26.6 0.3 1.011 1931–1940 32.1 31.4 0.7 1.022 30.9 31.1 –0.2 0.9936 1941–1950 32.5 31.7 0.8 1.025 31.4 30.9 0.5 1.0162 1951–1960 41.9 40.6 1.3 1.032 37.3 35.9 1.4 1.0390 1961–1970 46.4 44.7 1.7 1.038 43.6 41.9 1.7 1.0406
estimates for the post-1971 period in order to better understand problems associated with census-based estimation of mortality, and then combined various procedures to provide estimates for the pre-1971 period. His estimates are also presented in Table 4. Although these estimates are somewhat different from the official ones, the pattern conveyed by both series is essentially identical. Compared with the official estimates, Bhat’s results suggest a more favourable trend in the mortality of females relative to that of males. According to him, the date at which the e0for males exceeded that for females was about 20 years after the cross-over date implied by official estimates. However, he then estimated a faster deterioration until the 1960s. Both series suggest a peak in the ratio during the 1961–70 decade, and support the view that the secular increase in India’s population sex ratio has been due to differential improvements in the mortality of males and females. While the mortality of both declined during the period, the mortality of males declined faster, producing a widening of the mortality gap between the sexes and increasing sex ratios.
Rather than changes in e0M/e 0
F, it is changes in nMx
M– nMx
F before 1971 that really matter when
considering the population sex ratio. Bhat (1998) provides estimates of e5and under-five mortality by sex. From these estimates and the use of model life tables above age five, it is possible to examine the implied trend in nMxM–
nMx
Fby five-year age group.
Not surprisingly, greater improvements in the e0for males before 1971 coincided with a decrease in
nMx M–
nMx
F. This contrasts with the increase
recorded in the SRS after 1971 and implies a reversal in nMxM–
nMx
F, which necessarily occurred
before 1971.
It might seem tempting to use these rates directly to reconstruct cohort survivorship ratios, but mortality estimates for the pre-1971 period are too uncertain to be used directly in the estimation procedure. Also, since these estimates are principally derived from the census, there would be a risk of circularity if they were used to provide estimates of the population sex ratio. For the pre-1971 period, I retain only the broad conclusion that there has been a reversal in nMxM–
nMx F. (The
reversal is not apparent in some age groups above age 40, for which the SRS estimated a decrease in
nMx M–
nMx
Fafter 1971. At these ages, it appears that nMx
M– nMx
Fwas also decreasing before 1971 (as in
the other age groups), so no reversal is observed.) An alternative strategy is required to determine levels of the differentials for the pre-1971 period and thus reconstruct cohort survivorship ratios.
We saw earlier that the 1981 census is of better quality than those of 1971 and 1991, and it seems reasonable to assume that the recorded sex ratio in 1981 is closer to the true value than either the 1971 or the 1991 recorded sex ratios. Making that assumption considerably reduces uncertainty about mortality before 1971. Given the levels and trends in sex differentials in mortality for the post-1971 period, there are few possibilities for the levels of sex differentials in mortality before 1971 to yield the sex ratio recorded in 1981.
This additional constraint suggests the following strategy. Assuming that the difference between males and females in age-specific mortality rates varied in a symmetrical way (i.e., a decrease and then an increase in nMxM–
nMx
F), I determine the
date at which this difference must have been reversed to produce the sex ratio recorded in the 1981 census. Using that date for the peak in the excess mortality of females, the implied cohort survivorship ratios in 1971, 1981, 1991 and 1996 can be determined using equation (2).
For cohorts born after 1971, the survivorship ratios in 1981 can be derived simply from the post-1971 trend in sex differentials in mortality. For older cohorts, however, the survivorship ratios in 1981 also depend on the trend in sex differentials in mortality before 1971 and thus on the date at which the excess mortality of females peaked. The assumption is that the absolute difference between males and females in age-specific death rates varied in a symmetrical way around a peak date, P:
∆µ(a, 1981–x+a) =∆µ(a, 1981) + ba(P–1981) + ba|P–(1981–x+a)|, where ∆µ(a,t) = µM(a,t) – µF(a,t) and where b
ais the
average annual change in ∆µ(a,t) recorded in the SRS after 1971 (from Table 3). (At ages 40–44, 50–54 and 55–59, I simply extrapolate the decrease recorded in the SRS: ∆µ(a, 1981–x+a) = ∆µ(a, 1981) +ba(a–x). At these ages, no reversal in ∆µ(a,t) occurred as ∆µ(a,t) continued decreasing after 1971. Note that, for these ages, the SRS trend does not need to be extrapolated long before 1971).
The peak date P is estimated through a trial-and-error process. Combining the resulting series of cohort survivorship ratios with the SRS-based age structure for females in 1981 and a sex ratio at birth of 1.05 in equation (1) produces an estimate for the population sex ratio in 1981. For example, a peak date of 1956 produces a sex ratio for 1981 of 1.0892, which is above the sex ratio of 1.0702 recorded in 1981. For more recent peak dates, the resulting 1981 sex ratio decreases monotonically. Thus only one possible peak date exists for which
the resulting sex ratio in 1981 matches the recorded sex ratio. This procedure indicates that the peak in the excess mortality of females occurred in 1968. It is reassuring that this date broadly corresponds with both the official mortality estimates and those made by Bhat, which imply that the excess mortality of females (measured by e0M/e
0
F) peaked
during the 1960–69 decade. (Sensitivity analysis shows that the assumption of symmetry around the peak date is not a problem. Given the two constraints of having a peak date before 1971 and matching the recorded 1981 sex ratio, there is little choice about the variation in the pre-peak rate of decline in nMxM–
nMx
F, and these choices do not
affect significantly the conclusions regarding estimated levels and trends in the population sex ratio (Guillot 2000, pp.142–47).)
Once the date of the peak in the excess mortality of females has been identified, cohort survivorship ratios from 1971 to 1996 can be easily inferred. Relative to 1981, changes in cohort survivorship ratios between 1971 and 1996 are determined entirely by mortality rates during the period 1971–96, for which we have relatively reliable SRS-based estimates.
R E S U LT S
The estimated cohort survivorship ratios for 1971, 1981, 1991 and 1996 are shown in Figure 4. Clearly, changes in cohort survivorship ratios differ from the changes in period (stationary) survivorship ratios presented in Figure 3. Whereas stationary survivorship ratios declined at every age, cohort ratios decreased or increased, depending on the age group under consideration. At younger ages, cohort ratios have decreased since 1971, as one could guess from the trend in nMxM–
nMx
Fin the SRS life tables.
(Below age 10, cohort survivorship ratios are not fundamentally different from the corresponding stationary survivorship ratios.) However, this is not true for older cohorts, which experienced both deterioration and improvement in the relative mortality of females. According to these estimates, survivorship ratios above age 40 have increased since 1971 because, for these older cohorts, improve-ments in the relative mortality of females after 1968 were insufficient to compensate for the deterioration that these successive cohorts experienced before 1968.
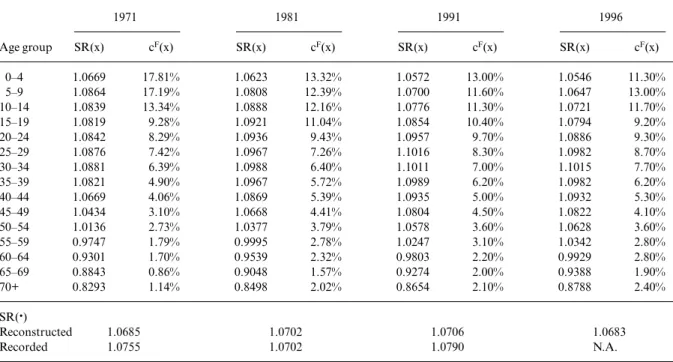
Finally, we can examine the trend in the overall sex ratio of India since 1971 implied by these cohort survivorship ratios and the corresponding SRS-based age structures for females. Table 5 presents estimates of age-specific sex ratios (which correspond
to the cohort survivorship ratios multiplied by a sex ratio at birth of 1.05), the corresponding SRS age structures for females, and the resulting overall population sex ratio in 1971, 1981, 1991 and 1996. (For the last age group (70+), the cohort survivorship ratios, and thus the age-specific sex ratios, cannot be calculated with the available information. I therefore derived SR(70+) by assuming that changes in age-specific sex ratios above age 60 increased exponentially with age. The value for SR(70+) has a minor impact on the overall sex ratio.) The results are shown in Figure 5.
According to these estimates, the sex ratio in 1971 was significantly lower than the sex ratio recorded for the 1971 census. As a result, the reconstructed population sex ratio appears to have marginally increased during the 1971–81 period, instead of achieving the large decreaserecorded in the census. The sex ratio remained practically constant at the 1981 value until 1991. Only after 1991 did the relative improvement in female survivorship start to translate into a decrease in the overall sex ratio of the population. It follows that there was a lag of about 23 years between the reversal in the relative survivorship of females and the reversal in the population sex ratio. SRS-based life tables record improvements in the relative survivorship of females since 1971, but this did not immediately translate into a decrease in the population sex ratio. This is because there was a momentum in the earlier increase in the population sex ratio. This apparent inconsistency between the improvement in the relative survivorship of females and the increase in the population sex ratio between 1971 and 1991 is due to the earlier increase in the mortality of females relative to males, an increase which remained imprinted on the survivorship of older cohorts after 1971.
According to this reconstruction, a substantial decrease in the population sex ratio should be expected from the 2001 census. Preliminary results from this census indicate a sex ratio of 1.0717 Figure 4. Cohort survivorship ratios, pcM(x, t–x)/p
c F(x, t–x),
with a 1968 peak date in excess mortality of females, India, 1971–91.
(Banthia 2001, Dyson 2001). Although it is too early to interpret this figure fully, the similarity of this result with that recorded in 1981 may confirm that, owing to the reversal in sex differentials in mortality, the propensity of India’s population sex ratio to increase has been halted.
D I S C U S S I O N
The first implication of this reconstruction refers to levels of a sex-specific undercount in the 1971 and 1991 censuses. The results alone do not allow us to conclude whether the discrepancy between recorded and reconstructed sex ratios is due to an undercount of females, double-counting of males, or some combination of both. However, the post-enumeration checks tell us that females were more likely to be missed than males (Dyson 1994). The NFHS in 1992–93 also showed that females were more likely than males to be missed because they go
to visit their natal home for childbirth and festivities (personal communication from Mari Bhat). In order to provide a broad picture of the undercount of females, one can assume that males were enumerated correctly and apply these estimates of the population sex ratio to them. The results are presented in Table 6.
Although the absolute number of females missed by the census substantially increased in 1991 relative to 1971, the proportion of females omitted did not increase very much. This is an important point. Some researchers have argued that the undercount of females cannot explain the increase in sex ratio, because it would imply record levels of underenumeration of females (Rajan et al. 1991, 1992). The analysis presented here suggests that the apparent increase in the sex ratio between 1981 and 1991 could be explained entirely by moderate levels of the underenumeration of females.
Various estimates exist of the undercount of females in 1991, based on projections of the 1981 census. They range from 3.7 to 5.7 million females not counted in 1991 (a relative undercount of 0.9 per cent to 1.4 per cent). They are high because they are based on a projected decrease in the sex ratio after 1981. My estimates, based on the conclusion that the sex ratio stayed constant between 1981 and 1991, suggest that the relative undercount of females in 1991 was lower than any of the projection-based estimates.
Another important implication of this recon-struction concerns the relationship between changes Table 5. Estimated age-specific sex ratios and population sex ratios, India, 1971–1996
1971 1981 1991 1996 Age group SR(x) cF(x) SR(x) cF(x) SR(x) cF(x) SR(x) cF(x) 0–4 1.0669 17.81% 1.0623 13.32% 1.0572 13.00% 1.0546 11.30% 5–9 1.0864 17.19% 1.0808 12.39% 1.0700 11.60% 1.0647 13.00% 10–14 1.0839 13.34% 1.0888 12.16% 1.0776 11.30% 1.0721 11.70% 15–19 1.0819 9.28% 1.0921 11.04% 1.0854 10.40% 1.0794 9.20% 20–24 1.0842 8.29% 1.0936 9.43% 1.0957 9.70% 1.0886 9.30% 25–29 1.0876 7.42% 1.0967 7.26% 1.1016 8.30% 1.0982 8.70% 30–34 1.0881 6.39% 1.0988 6.40% 1.1011 7.00% 1.1015 7.70% 35–39 1.0821 4.90% 1.0967 5.72% 1.0989 6.20% 1.0982 6.20% 40–44 1.0669 4.06% 1.0869 5.39% 1.0935 5.00% 1.0932 5.30% 45–49 1.0434 3.10% 1.0668 4.41% 1.0804 4.50% 1.0822 4.10% 50–54 1.0136 2.73% 1.0377 3.79% 1.0578 3.60% 1.0628 3.60% 55–59 0.9747 1.79% 0.9995 2.78% 1.0247 3.10% 1.0342 2.80% 60–64 0.9301 1.70% 0.9539 2.32% 0.9803 2.20% 0.9929 2.80% 65–69 0.8843 0.86% 0.9048 1.57% 0.9274 2.00% 0.9388 1.90% 70+ 0.8293 1.14% 0.8498 2.02% 0.8654 2.10% 0.8788 2.40% SR(·) Reconstructed 1.0685 1.0702 1.0706 1.0683 Recorded 1.0755 1.0702 1.0790 N.A.
Figure 5. Recorded and reconstructed population sex ratio, India, 1901–96.
in the sex ratio, changes in sex differentials in mortality, and changes in discrimination against females. This analysis shows that, even if the population sex ratio is accurately recorded, it is a bad proxy for changes in sex differentials in mortality. In India, the effect on the sex ratio of declining excess mortality of females after 1971 is confounded by earlier trends in sex differentials in mortality. Another possible confounding factor (although less important here) is change in the population age structure, which also affects the overall sex ratio independently of sex differentials in mortality. Thus, a moderate increase followed by no increase in the sex ratio has coincided with significant reductions in the excess mortality of females. Although a long-term increase in the sex ratio must reflect a relative worsening of the mortality of females, a short-term increase or decrease in the overall population sex ratio does not allow the analyst to reach conclusions about changes in their relative mortality. This problem exists in addition to issues of data quality, which appear to have been the major cause of the erratic trend in the sex ratio in India since 1971. Another problem for the interpretation of the population sex ratio is that it is affected by changes in the absolute difference in death rates between males and females, whereas a more appropriate index of discrimination against females may be the relative difference between these rates. In the context of overall mortality decline, these two measures do not necessarily vary in the same direction.
This present study also shows that changes in age-specific sex ratios, such as juvenile sex ratios (Das Gupta and Bhat 1997), in Indian censuses must be interpreted with caution. In addition to changes in differential census coverage of males and females, which appear to have been quite substantial between 1981 and 1991, age-specific sex ratios can be highly distorted by differential age misreporting by sex. In 1981, recorded juvenile sex ratios were too low because of greater age exaggeration for males (Guillot 2000, pp. 154–55). Thus juvenile sex
ratios rose between 1981 and 1991 in part because of better reporting of age owing to rising levels of education and the increasing prevalence of birth registration.
Conversely, independent estimates of changes in period sex differentials in mortality do not allow one to draw conclusions about ‘real’ trends in the sex ratio and about the quality of census estimates. To make inferences about the direction of the effect during a particular period, evidence for earlier trends in sex differentials in mortality is needed. In the case of India, data on mortality trends between 1971 and 1996 are insufficient to reach conclusions about the likely trend of the sex ratio during the period.
It is important to note that the population sex ratio can be estimated in an algebraic way from evidence on the ‘proximate determinants’ of the sex ratio. The appropriate way to understand the dynamics of the population sex ratio is to study these proximate determinants and combine them in an exact equation such as equation (1). It is misleading to predict the population sex ratio by combining proximate determinants in a non-exact way (for example by regressing the sex ratio on e0 for males and females), or by including indirect factors, such as the literacy of females, the causal impact of which on the sex ratio is uncertain (Mayer 1999). When they exist, demographic identities should be preferred over inexact associations.
N O T E S
Michel Guillot is at the Center for Demography and Ecology, University of Wisconsin-Madison, 1180 Observatory Drive, Madison, WI 53706 USA. Email: [email protected].
This research was supported in part by a grant from the Population Council and a David E. Bell fellowship at the Harvard Center for Population and Development Studies. I am grateful to Samuel Preston, Herbert Smith, Etienne van de Walle, Mari Bhat, Subrata Lahiri and anonymous reviewers for comments and suggestions. An earlier version of this article was presented at the Population and Health Seminar Series of the Harvard School of Public Health, December 2000 and at a symposium organized by the International Institute for Population Sciences, Mumbai, January 2002.
Table 6. Estimates of the undercount of females in censuses, India, 1971–91
Recorded Recorded Absolute
male female Recorded Reconstructed Implied undercount Relative population population population population females of females undercount Year (thousands) (thousands) sex ratio sex ratio (thousands) (thousands) of females
1971 284,049 264,110 1.0755 1.0685 265,839 1,729 0.65%
1981 343,930 321,357 1.0702 1.0702 321,357 0 0.00%
1991 435,208 403,360 1.0790 1.0706 406,509 3,149 0.77%
Source: Census of India 1971, 1981 and 1991. The census total for 1981 excludes data for Assam, and the census total for 1991 excludes data for Jammu and Kashmir.
R E F E R E N C E S
Agnihotri, Satish B. 2000. Sex Ratio Patterns in the Indian Population: A Fresh Exploration. New Delhi: Sage.
Banthia, J. K. 2001.Provisional Population Totals, Series 1, Paper 1 of 2001. Delhi: Controller of Publications.
Bhat, Mari P. N. 1987. Mortality in India: Levels, Trends and Patterns. Unpublished Ph.D. dissertation. Ann Arbor, Michigan: University Microfilms.
Bhat, Mari P. N. 1995. “Age misreporting and its impact on adult mortality estimates in South Asia”,Demography India24(1): 59–80.
Bhat, Mari P. N. 1998. “Demographic estimates for post-independence India: a new integration”, Demography India27(1): 23–57.
Bhat, Mari P. N. 2001. Generalised Growth-Balance Method as an Integrated Procedure for Evaluation of Completeness of Censuses and Registration Systems: A Case Study of India, 1971–91. Manuscript. Delhi: Institute of Economic Growth. Bhat, Mari P. N. and K. Navaneetham. 1991. “Recent trends in
age-specific mortality in India”, Journal of Institute of Economic Research26(1–2): 49–69.
Bhat, Mari P. N., S. H. Preston and T. Dyson. 1984.Vital Rates in India, 1961–1981. Committee on Population and Demography Report No.24. Washington, D.C.: National Academy Press. Census of India. 1971.Series 1. India. Part II–C(ii).Social and
Cultural Tables. New Delhi: Office of the Registrar General. Census of India. 1981.Series 1. India. Part IV–A. Social and
Cultural Tables. New Delhi: Office of the Registrar General. Census of India. 1991.Series 1. India. Part IV A – C Series.
Social and Cultural Tables. New Delhi: Office of the Registrar General.
Coale, Ansley J. 1991. “Excess female mortality and the balance of the sexes in the population: an estimate of the number of “missing females””,Population and Development Review 17(3): 35–51.
Das Gupta, Monica. 1987. “Selective discrimination against female children in rural Punjab, India”, Population and Development Review13(1): 77–100.
Das Gupta, M. and M. Bhat. 1997. ‘Fertility decline and increased manifestation of sex bias in India’, Population Studies51(3): 307–15.
Drèze, Jean and A. Sen. 1995.India: Economic Development and Social Opportunity. Delhi; New York: Oxford University Press Dyson, Tim. 1981. “Preliminary demography of 1981 Census”,
Economic and Political Weekly16(33): 1349–56.
Dyson, Tim. 1987. “Excess female mortality in India: uncertain evidence on a narrowing differential”, Journal of Family Welfare28(2): 350–81.
Dyson, Tim. 1994. “On the demography of the 1991 census”,
Economic and Political Weekly29(51–52): 3,235–9.
Dyson, Tim and M. Moore. 1983. “On kinship structure, female autonomy, and demographic behavior in India”,Population and Development Review9(1): 35–60.
Dyson, Tim. 2001. “The preliminary demography of the 2001 census of India”,Population and Development Review27(2): 341–356.
Gangadharan, S. 1991. “Second sex or subordinate sex?”The Economic Times, April 18.
Griffiths, Paula, Zoë Matthews, and Andrew Hinde. 2000. “Understanding the sex ratio in India: a simulation approach”,Demography37(4): 477–88.
Guillot, Michel. 2000. The Dynamics of the Population Sex Ratio. Unpublished Ph.D. Dissertation. Ann Arbor, Michigan: University Microfilms.
International Institute for Population Sciences (IIPS). 1995.
National Family Health Survey (MCH and family planning): India 1992–93. Bombay: IIPS.
Kanitkar, T. 1991. “The sex ratio in India: a topic of speculation and research”,Journal of Family Welfare37(3): 18–22. Kumar, N., S. Raju, P. J. Atkins and J. G. Townsend. 1997.
“Where angels fear to tread? Mapping women and men in India”,Environment and PlanningA 29(12): 2207–15.
Kundu, Amitbah and Madesh K. Sahu. 1991. “Variation in the sex ratio: development implications”, Economic and Development Weekly26(41): 2341–42.
Mayer, Peter. 1999. “India’s falling sex ratios”,Population and Development Review25(2): 323–43.
Mazumdar, V. 1991. “Declining sex ratio – a view from the women’s movement”,Frontline, May 11–24.
Mukerji, S. 1982. “Under-enumeration in Indian censuses: impact on inter-censal population growth, 1901–81”,
Economic and Political Weekly17(46–47): 1870–5.
Padmanabha, P. 1981. “The decisive decades: a note on the provisional results of the 1981 census of India”,Yojana25(9): 4–9.
Padmanabha, P. 1982. “Mortality in India: a note on trends and implications”, Economic and Political Weekly 17(32): 1285–90.
Pathak, K. B. and F. Ram. 1991. “Dynamics of population change in India: lessons from the 1991 Census”,Journal of Family Welfare37(3): 52–61.
Preston, S. H., N. Chen and J. Hobcraft. 1979. Preliminary Report on Application of Techniques for Estimating Death Registration Completeness to Data from the Indian Sample Registration System. Paper presented to a meeting of the India Panel, Committee on Population and Demography, U.S. National Academy of Sciences.
Rajan, S. Irudaya, U. S. Mishra and K. Navaneetham. 1991. “Decline in sex ratio: an alternative explanation revisited”,
Economic and Political Weekly26(51): 2963–64.
Rajan, S. Irudaya, U. S. Mishra and K. Navaneetham. 1992. “Decline in sex ratio – alternative explanation revisited”,
Economic and Political Weekly27(46): 2505–08.
Raju, Saraswati and Mahendra K. Premi. 1992. “Decline in sex ratio: alternative explanation re-examined”, Economic and Political Weekly27(17): 911–12.
Registrar General. 1992.1991 Census of India: Paper-2 of 1992. New Delhi: Office of the Registrar General.
Registrar General. 1984. SRS-based Abridged Life Tables:
1970–75. New Delhi: Office of the Registrar General. Registrar General. 1986. SRS-based Abridged Life Tables:
1976–80. New Delhi: Office of the Registrar General. Registrar General. 1990.SRS-based Life Tables: 1981–85. New
Delhi: Office of the Registrar General.
Registrar General. 1994.SRS-based Life Tables: 1986–90. New Delhi: Office of the Registrar General.
Retherford, Robert D. and Vinod K. Mishra. 2001. Comparison of Fertility Trends Estimated from India’s Sample Registration System and India’s First and Second National Family Health Surveys. Paper presented at the 2001 meetings of the Population Association of America, Washington, DC. Sinha, U.P. 1983. “Trend of female mortality in India in relation
to male mortality”,Journal of Family Welfare30(1): 54–61. Srinivasan, K. 1991. “The demographic scenario revealed by
the 1991 census figures”,The Journal of Family Welfare37(3): 3–9.
Srinivasan, K. 1994. “Sex Ratios: what they hide and what they reveal”,Economic and Political Weekly29(51–52): 3233–34. Sudha, S. and S. Irudaya Rajan. 2001. Female Demographic
Disadvantage in India 1981–1991: District Level Patterns in Estimated Sex Ratios at Birth and Sex Ratios of Child Mortality. Paper presented at the 2001 meetings of the Population Association of America, Washington, DC. Visaria, Pravin M. 1971. “Provisional population totals of the
1971 census: some questions and research issues”,Economic and Political Weekly6(29): 1459–65.
Visaria, Pravin M. 1972.The sex ratio of the population of India. Monograph no. 10. New Delhi: Office of the Registrar General.
Visaria, Pravin M. 1991. “Overall stability in growth, not demographic inertia”,The Economic Times, April 18.