UKWIR NATIONAL MAINS FAILURE DATABASE
Author: Steve MacKellar, Bodycote PDL, Manchester, UK
ABSTRACT
In 2002 UK Water Industry Research Ltd commissioned Bodycote PDL to collate and maintain a database of all water main failures in the UK and develop a protocol for data collection of failure information. Despite the huge disparity in the data formats from each company this has been achieved and maintenance of the database is ongoing. The database now contains around 500,000 mains failure records covering over 95% of the UK companies for the period around 1995 onwards. The database includes mains lengths for each material and diameter to allow the generation of the proper comparisons of failure rates. Whilst analysis of the database trends does not form a significant part of the work, interesting seasonal observations on failure patterns for asbestos cement, PVC and PE compared to Cast Iron can be seen.
A case study of how one UK water utility was able to use the National Mains Failure Database to demonstrate to the industry regulator that it had a specific problem with old (pre 1985) PVC pipelines and plan for a replacement strategy is described.
UKWIR – NATIONAL MAINS FAILURE DATABASE
1. INTRODUCTION
This paper describes the creation of the UK Water Industry Research Ltd (UKWIR) National Mains Failure Database (NMFD). The paper focuses mainly on the technical aspects of data collection, processing, validation and storage and the challenges faced in providing this valuable resource. However, some observations on asset stock and failure trends are provided as well as a brief case study regarding PVC.
The UK (England, Wales, Scotland, Northern Ireland) currently comprises twenty-three1
principal water supply companies. Twenty-one companies, those in England and Wales, are public limited companies (plc’s) most of whom are listed on the stock exchange, and all of whom are accountable to the Office of Water Services (OFWAT) the Government Regulator. Two companies, those in Scotland and Northern Ireland are publicly owned and controlled by the regional governmental bodies. All are members of UKWIR, a national organisation that facilitates research projects of common interest to their members.
1 The number depends on whether one counts OFWAT regulatory reporting entities or the parent companies owning
The UK water industry repairs approximately 70,000 mains every year. This number excludes customer service pipe repairs (which amount to a similar, if not greater number) and repairs due to damage by third parties. However, it does include repairs arising from active leakage control (ALC) surveys designed to find leaks, as well as repairs arising from reports made by customers and the general public.
In 2002 as the UK water industry started the 2 year build up to the 5 year periodic review of prices, UKWIR commissioned Bodycote PDL to expand their previous failure database work (presented at a seminar in Warwick in 1999) into a nationwide exercise of collating failures from all UK companies into a standard format. With the support of the UKWIR members, the project has been a tremendous success with contributions having been received from all except 2 of the UK companies.
2. NATIONAL MAINS FAILURE DATABASE (NMFD) DESIGN CONCEPT
The NMFD comprises a single table of all the known mains failures from all the water companies presented in identical format and standardised into material groups, diameter groupings, dates, ground surface use and failure modes.
To allow for failure rates to be determined a table of assets (aggregated by diameter, age and material) was recognised as being essential but as no more than a denominator in analysis of the failures. However in the early days, the NMFD was definitely not seen as a national asset register of mains. This concept has come much later.
Anyone wanting access to the NMFD should contact UKWIR directly.
2.1 Confidentiality
In order to preserve the anonymity of data within the NMFD it was agreed by the steering group that no spatial information would be retained other than District Meter Area (DMA) references where these were supplied. Similarly all references to companies were removed.
2.2 Simplicity
From the outset it was envisaged that the NMFD would be used by asset managers, regulatory staff and operational staff for comparisons with other companies. Thus early decisions were based around the intended users being NON-IT based hence the database was presented in standard MS Access tables. This also enabled the costs to be contained.
It was also decided to hold all data in ‘understandable’ form, i.e. not coded or held as relationship linked tables. This was to enable non experienced users to be certain they were viewing the right data and to perform their own research and investigation using the powerful proprietary tool of “pivot tables” and “pivot charts” readily available in MS Excel.
At the outset it was recognised that due to the need to preserve confidentiality, coupled with the disparate years of failure data provided by each company, it would be difficult to provide the raw information that would allow users to calculate failure rate themselves. To address this issue
“standard reports”, within the NMFD, were developed which presented the failure rates for the most common queries.
2.3 Widest possible coverage
Whilst it was evident from data provided that some companies had a wealth of apparently robust information, others struggled to provide any at all. An initial sweep of all the data provided to Bodycote PDL, allowed the objective selection of the most promising fields to be included in the NMFD. This allowed data from all companies to be processed and incorporated (although some companies were excluded later for other reasons).
One of the measures of success of this project has been the universal support and willing participation of virtually the whole water industry. Of the 23 companies, data has now been received from all except 2.
2.4 Robustness of data
Considerable effort has been put into the database in trying to standardise the plethora of formats for each data field, to eliminate erroneous information and to ensure that the number of failures for a given company in a given year is consistent with those reported to OFWAT – otherwise the computation of failure rate will be misleading. This area of data cleansing is the one that has taken the most time in the process.
2.5 Focus on failures
This heading is here is to clarify that in the original concept of the NMFD, the inclusion of the mains lengths was seen as simply a means of determining failure rate. Thus the database structure and output was not overly concerned at the level of aggregation or the loss of spatial data. In fact these factors allowed a high degree of compaction of the datasets, such that they were readily manageable and easy to query.
With the advent now of deterioration modelling and its data hungry demands, it has become apparent that the asset stock information will play an equally important role to the failure information. The plans to address this are set out towards the end of this paper.
3. DATABASE STRUCTURE AND PROCESS METHODOLOGY
For the current NMFD the data structure is extremely simple, namely two tables.
For completeness of understanding however, the process of how these tables were derived is included here. This has significance as it explains why the existing structure is inadequate for the probable ongoing uses of the NMFD.
The process involved in the import, checking, validation and transformation of each company’s data was lengthy and involved the following steps:
a. Request data from company
b. Check contents of fields supplied
d. Convert to Access database e. Strip out surplus data
f. Convert field types to correct “type” (e.g. dates)
g. Create “update” fields to hold transformed data
h. Determine range of values in each field
i. Determine validity and how to proceed – refer back to company if necessary
j. Amend database as necessary
k. Create lookup conversion table for each field
l. Populate “transformed” data fields
m. Consolidate data - create summary mains lengths by DMA, Year, Surface
n. Anonymise records
3.1 Data validation
There are four principal levels of validation of the data.
3.1.1 Import routine validation
The first check was that the data could be “read” and interpreted into a standard field format for later interpretation. This was particularly important with date and text fields. Fewer problems were generally encountered with numeric fields. There was a particularly wide variation in the formats of date fields and these had to be interpreted and transformed. Some companies only used a two digit field for the year which causes problems now that records span three centuries.
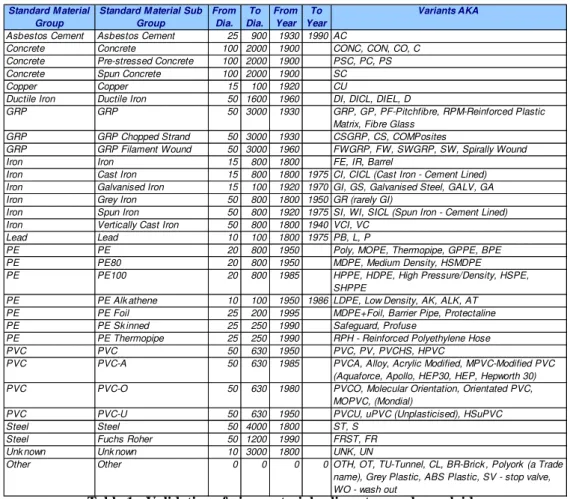
3.1.2 Check against the Standards library
The second validation of material classification against age and diameter was carried out by reference to the pipe library developed specifically for this project. Table 1, below, shows the “acceptable” ranges assumed for diameters and years laid for various materials. The validation, rightly or wrongly, assumed the “material” field was correct and set as “unknown” any conflicting “diameter” or “year laid” information. It should be noted that 95% of records passed these rules without correction for most companies.
3.1.3 Check for completeness of failure records
The third level of checking is a “completeness” check at the macro level where the total number of reported failures in any given year(s) is compared to that reported to OFWAT. A tolerance of +/- 10% is allowed.
If the discrepancy is greater than this, then the records are still included in the table of mains failures, since they are valid records in all other respects, but that year of failure data is excluded from the failure rate calculations for that company.
3.1.4 Check for completeness of assets lengths
This check ensures that the length of “live” water mains is within 5% of the declared asset stock to OFWAT in the June Return for the appropriate year. If it is not, then liaison with the company continues until the matter is resolved.
Standard M aterial Group
Standard M aterial Sub Group From Dia. To Dia. From Year To Year Variants AKA
Asbestos Cement Asbestos Cement 25 900 1930 1990 AC
Concrete Concrete 100 2000 1900 CONC, CON, CO, C
Concrete Pre-stressed Concrete 100 2000 1900 PSC, PC, PS
Concrete Spun Concrete 100 2000 1900 SC
Copper Copper 15 100 1920 CU
Ductile Iron Ductile Iron 50 1600 1960 DI, DICL, DIEL, D
GRP GRP 50 3000 1930 GRP, GP, PF-Pitchfibre, RPM-Reinforced Plastic
Matrix, Fibre Glass
GRP GRP Chopped Strand 50 3000 1930 CSGRP, CS, COMPosites
GRP GRP Filament Wound 50 3000 1960 FWGRP, FW, SWGRP, SW, Spirally Wound
Iron Iron 15 800 1800 FE, IR, Barrel
Iron Cast Iron 15 800 1800 1975 CI, CICL (Cast Iron - Cement Lined)
Iron Galvanised Iron 15 100 1920 1970 GI, GS, Galvanised Steel, GALV, GA
Iron Grey Iron 50 800 1800 1950 GR (rarely GI)
Iron Spun Iron 50 800 1920 1975 SI, WI, SICL (Spun Iron - Cement Lined)
Iron Vertically Cast Iron 50 800 1800 1940 VCI, VC
Lead Lead 10 100 1800 1975 PB, L, P
PE PE 20 800 1950 Poly, MOPE, Thermopipe, GPPE, BPE
PE PE80 20 800 1950 MDPE, Medium Density, HSMDPE
PE PE100 20 800 1985 HPPE, HDPE, High Pressure/Density, HSPE,
SHPPE
PE PE Alk athene 10 100 1950 1986 LDPE, Low Density, AK, ALK, AT
PE PE Foil 25 200 1995 MDPE+Foil, Barrier Pipe, Protectaline
PE PE Sk inned 25 250 1990 Safeguard, Profuse
PE PE Thermopipe 25 250 1990 RPH - Reinforced Polyethylene Hose
PVC PVC 50 630 1950 PVC, PV, PVCHS, HPVC
PVC PVC-A 50 630 1985 PVCA, Alloy, Acrylic Modified, MPVC-Modified PVC
(Aquaforce, Apollo, HEP30, HEP, Hepworth 30)
PVC PVC-O 50 630 1980 PVCO, Molecular Orientation, Orientated PVC,
MOPVC, (Mondial)
PVC PVC-U 50 630 1950 PVCU, uPVC (Unplasticised), HSuPVC
Steel Steel 50 4000 1800 ST, S
Steel Fuchs Roher 50 1200 1990 FRST, FR
Unk nown Unk nown 10 3000 1800 UNK, UN
Other Other 0 0 0 0 OTH, OT, TU-Tunnel, CL, BR-Brick , Polyork (a Trade
name), Grey Plastic, ABS Plastic, SV - stop valve, WO - wash out
Table 1 : Validation of pipe materials, diameters and year laid
3.2 Limitation of checks on failure type and location
No attempt has been made to correct, or otherwise alter, doubtful or erroneous looking failure types that appear for various materials. This is partly due to there being no easy rules by which to determine which part of the record is at fault.
The protocol sets out the range of probable failure mechanisms for each material. However it has been left to the water companies to amend their own records in this regard, should they so wish. It is hoped some time in the future, that a rule based validation across a number of fields for each record might be developed that would reduce the number of misleading entries.
It is understood that it is common for mains failures to occur in the same vicinity as recent failures. It is believed this is due to the ground being disturbed and additional stresses being put on a main during repair. Thus, in the database it is not uncommon to see records appearing to show the same main failing at the same location in the same month. Since the NMFD does not hold the day of failure, only the month, these records can appear to be duplicates in the database. This may occasionally be the case (if received as such from the water companies) but is more often a repeat failure as described. For this reason there has been no attempt to look for or correct “duplicate” entries.
3.3 Pipe library
A significant piece of work in its own right is the creation of the pipe library which is included on each NMFD CD-ROM. This is a list of all known pipes that have been manufactured or supplied into the UK. For each pipe, the library lists the standard (BS, WIS, ISO, CEN) to which it is made, the years of probable manufacture, the diameter (nominal, internal and external), the wall thickness, the pipe class and the nominal pressure rating.
The library is a reference document in its own right. It has been used to validate the material, diameter and age consistency for pipes in the NMFD. However, it could equally be used to populate missing data within GIS systems, which in turn provide essential information when using GIS to create hydraulic models.
From this library Table 1 was generated. The full library can be found on the NMFD CD-ROM.
3.4 Data consolidation
Burst records were not consolidated but an individual record provided for each failure. Asset records were consolidated based on Diameter group, Year installed, Material. This process enabled the size of the mains database to be reduced by some 90%.
The data fields held on the master database for mains assets are: material, diameter band, date of installation and soil surface use. The failure records contain the same data fields plus failure type and date of failure/repair.
4. PROTOCOL FOR DATA COLLECTION
Further information on best practice recommendations can be found in the Protocol Documenti,
however two issues are worth repeating here for emphasis:
a. Field reporting
Accurate field reporting of failures requires data collection by personnel trained to recognise all the various failure mechanisms. This is easy to say but difficult to accomplish. The repair gang (or their supervisor) is often responsible for collecting the failure data and training this large group of people to a sufficiently competent level is daunting. An alternative is to provide specialist staff to gather the failure data. However, to be effective, these personnel would need to attend every failure and be on call day and night, thus probably making the cost prohibitive. A technology based approach suggests a hand held data capture system that incorporates an “expert system” to prompt and validate user responses in some detail about the failure. Ideally such a system would also record date, time, GPS location and link through to the GIS system to pick up pipe attributes which could be verified or corrected ‘on-line’. Such a system is not known to exist at present.
b. Separation of the “failure type” field.
Without exception, all companies have been trying to combine multiple pieces of information in a field entitled “failure type” or “failure mode” or similar. The strong recommendation is to separate this out into three separate fields:-
a. Exact failure location. e.g. pipe wall or joint between ferrule and main or joint between tapping tee and service pipe.
b. Exact nature of failure (often needs specialist training to determine properly) e.g. EF collar leak path along weld interface, EF collar pulled out, circumferential split.
c. Probable cause (even more training/experience required to diagnose reliably)
e.g. over pressurisation, EF misalignment, corrosion, point load.
The above lists are not meant to be exhaustive. Many additional entries may be necessary in each list and it may be sensible to group these into similar headings to aid analysis. Similarly, it would be wise to allow for several “causes” within the data capture process as seldom is the reason for failure clear cut.
5. THE DATA
The database is vast containing c. 480,000 failure records and information on approximately 350,000 km water mains. The limited space in this paper permits only a few glimpses.
The following figures, drawn from the mains dataset, illustrate the wide variation in material making up the asset stock for different companies in the UK.
Figure 1 UK Average materials for water mains Figure 2 Company A - High PE stock
Figure 3 Company B - High PVC stock Figure 4 Company D - No plastic!
This ability to now readily compare and contrast the asset stock of different companies has enabled companies to have confidence of where unique circumstances prevail and to see how different material choices and relining and replacement strategies over the past 25 years have resulted in very different challenges. For the first time companies can clearly see how they differ from one another in terms of asset stock.
0% 5% 10% 15% 20% 25% 30% 35% 40% 45% 50% Sum of New_Length 0% 5% 10% 15% 20% 25% 30% 35% Sum of New_Length 0% 10% 20% 30% 40% 50% 60% Sum of New_Length 0% 10% 20% 30% 40% 50% 60% 70% 80% Sum of New_Length Asbestos Cement Ductile Iron Iron PE PVC New_MaterialGroup
With respect to failures, Figure 5 UK water main failure rates below shows the average failure
rates for different materials in the recent past. Note: any movements are as likely to be due to
different companies contributing in each year as to material trends. Use of the data to generate deterioration models is part of ongoing research commissioned by UKWIR on behalf of the industry. It is anticipated that the results of this work will be available in the summer of 2007.
UKWIR Water Mains National Failure Database
0 5 10 15 20 25 30 35 40 1995 1996 1997 1998 1999 2000 2001 2002 2003 Average Year F a il u re s p e r 1 0 0 k m p e r y e a r Iron Asbestos Cement PVC Ductile Iron PE © Bodycote PDL
Figure 5 UK water main failure rates 6. CASE STUDY ON PVC
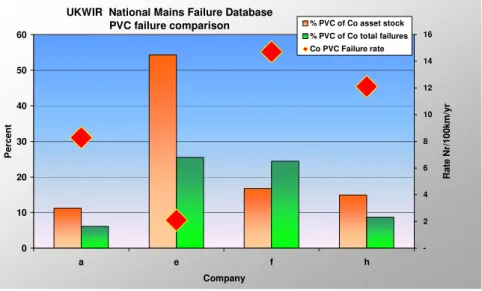
As a simple illustration of the use that can be made of the NMFD the following graph (Figure 6) formed part of a study into PVC problems faced by one UK water company.
UKWIR National Mains Failure Database PVC failure comparison 0 10 20 30 40 50 60 a e f h Company P e rc e n t -2 4 6 8 10 12 14 16 R a te N r/ 1 0 0 k m /y r % PVC of Co asset stock % PVC of Co total failures Co PVC Failure rate
Figure 6 shows how 4 companies have very different experiences of PVC as a material. Company “a” is around the UK average. Company “e” has a dominant PVC stock in terms of asset stock and has no significant problems with it. Company “f” however, has a modest PVC stock which is causing a hugely disproportionate amount of failures. Company “h” is somewhere between these extremes.
On the basis of this analysis (but given in far greater detail) Company “f” was able to secure additional funding from the UK Regulator on the grounds that it had a unique and serious problem with it PVC pipe stock.
7. THE FUTURE
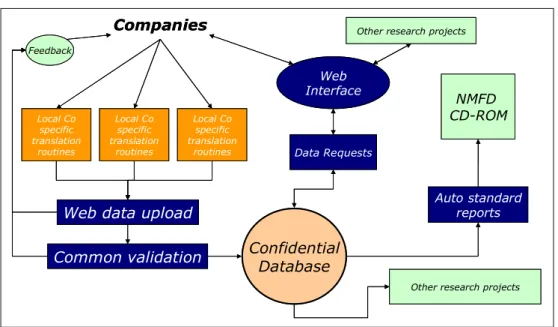
The plans for the next phase of the NMFD are currently under discussion but it is hoped that it will include a hugely extended confidential dataset to feed into other research. The concept is shown diagrammatically in Figure 7. This confidential dataset would include:-
• Spatial information
• Details of whether a failure record is a result of reported burst or ALC effort
• All other data fields previously removed
• Web access
• Bespoke company translation algorithms
• Automatic validation routine
• Climate and soil data
Web Interface Local Co specific translation routines Confidential Database Web data upload
Local Co specific translation routines Local Co specific translation
routines Data Requests
NMFD CD-ROM
Auto standard reports
Common validation
Other research projects Other research projects
Feedback Companies Web Interface Local Co specific translation routines Confidential Database Web data upload
Local Co specific translation routines Local Co specific translation
routines Data Requests
NMFD CD-ROM
Auto standard reports
Common validation
Other research projects Other research projects
Feedback
Companies
Figure 7 One possible future for the NMFD
The target for phase 3 is to have data from all UK companies up to the end of 2006 processed and available by mid December 2007.
It is hoped that the data capture by companies will be greatly improved since the provision of a protocol for the recording of mains failures.
8. CONCLUSIONS
• The UKWIR National Mains Failure Database has resulted in co-operation of all the UK
water companies in the sharing of data in an unprecedented manner. Assurance of confidentiality is thought to be the key to this success.
• The database currently comprises 480,000 failure records and 350,000 km of water mains.
• Whilst far from error free, the data represents an enormous step forward in the provision
of a robust dataset to aid the understanding of buried infrastructure assets and their failure.
• Several companies have already used the data to support their asset management business
plans put before the Regulator, OFWAT. At least one was successful in justifying price rises to fund additional mains renovation expenditure.
• The database has already provided the catalyst for at least two water companies to invest
substantially in data cleansing and more robust data collection.
• The largest challenge is in the collection of accurate information from the field at the time
a repair is carried out. Some form of “expert system” on a hand held device may be the answer.
• Continuous improvement is now envisaged through provision of more data fields, a
confidential master database and automation routines for translation and validation.
Acknowledgements
The author would like to thank UKWIR for their kind permission to publish this paper.
References
i
UKWIR Nationally agreed failure data and analysis methodology for water mains RG/05/A: Volume 2: Protocol for the capture and reporting of data on mains failures