2010 Australasian Road Safety Research, Policing and Education Conference 1
Different approaches to measuring specific deterrence: Some examples from speeding offender management
Watson, B.; Siskind, V.; Fleiter, J.J.; and Watson, A. Centre for Accident Research and Road Safety-Queensland
Email: [email protected]
Abstract
Traffic law enforcement sanctions can impact on road user behaviour through both general and specific deterrence mechanisms. General deterrence is typically measured in terms of community-wide changes in offending behaviour, while specific deterrence is measured by re-offence or recidivism rates. However, recidivism can be conceptualised in a number of different ways. This paper compares and contrasts different measures of recidivism within the context of managing speeding offenders with regard to absolute and marginal specific deterrent effects. As part of a larger study evaluating the effects of penalty increases in 2003 on speeding offenders in Queensland, the research team considered four definitions of recidivism across two cohorts of drivers detected for speeding prior to (2001) and after (2003) the speeding penalty changes: 1) the proportion of offenders who re-offended in the follow up period; 2) the overall frequency of re-offending in the follow up period; 3) the length of delay to re-offence among those who re-offended; and 4) the average number of re-offences during the follow up period among those who re-offended. Any reduction in speeding will have road safety benefits, however, the ways in which a ‘reduction’ is determined deserves greater methodological attention and has implications for countermeasure evaluation more generally. Overall, results suggested evidence of an absolute deterrent effect of penalty changes in that there were significant reductions in the proportion of drivers who re-offended and the overall frequency of re-offending, consistent with prediction. However, there was no evidence of a marginal specific deterrent effect among those who re-offended. Contrary to prediction, there was a significant reduction in the length of time to re-offence and no significant change in average number of offences committed. Speed camera and radar data were analysed to explore whether the changes in re-offence patterns may have been influenced by changes in speed enforcement activity. This analysis indicated that the speed enforcement operational hours increased by 43% from the pre to post-penalty change period, suggesting that the reduction in offences observed in the follow-up period was not due to an enforcement effect. Limitations regarding the use of routinely-collected data, as well as issues of exposure, enforcement levels and public education accompanying penalty changes are discussed and areas for future research are outlined.
Keywords
Speeding, recidivism, evaluation, road safety, re-offence, repeat offenders
Introduction
Evaluating the effectiveness of road safety countermeasures is a vital step in developing safer systems for road users. The success of countermeasures is typically assessed in a variety of ways including reductions in crashes, fatalities, injuries, and/or reductions in specific risky behaviours. Traffic law enforcement, an integral component of road safety strategies, aims to reduce road trauma by deterring road users from committing illegal road behaviours via the threat of detection and punishment (i.e., general deterrence) and through the punishment of those who are detected (i.e., specific deterrence). The effects of enforcement can be measured in a range of ways. For instance, a general deterrent effect is commonly measured in terms of community-wide changes in offending behaviour [for an example relating to drink driving, see 1]. A specific deterrent effect is typically assessed by measuring changes in re-offence or recidivism rates, as this form of deterrence relates only to those people who have already been apprehended and punished at least once for the behaviour in question. In other words, establishing whether a specific deterrent effect has been achieved or not entails assessing the subsequent behaviour of offenders.
However, recidivism can be conceptualised in a number of different ways. Furthermore, each of these ways reflects a different measure of re-offence, and each, therefore, has the potential to provide a different outcome for assessing countermeasure effectiveness. In the road safety literature, the term ‘recidivist’ is most commonly used when referring to drivers with multiple drink driving convictions and is often used interchangeably with the terms ‘repeat offender’, ‘persistent offender’, ‘habitual offender’ and ‘hard core offender’ to identify a person who commits an offence more than once [2,3,4]. These terms are often used in a general sense to describe anyone who re-offends and, on occasion, are used to identify people who have been apprehended for offences of a particular magnitude (e.g., a drink driving offender with a Blood Alcohol Concentration above a
2010 Australasian Road Safety Research, Policing and Education Conference 2 specified level who has been apprehended more than once). However, these terms can denote different types of
repeat offenders. For instance, to use a speeding-related example, drivers who unintentionally commit a low-range speeding offence twice within a given time period can be described as repeat offenders because they have committed the same offence more than once. Arguably, however, these drivers are different to those who persistently, intentionally and excessively exceed speed limits. This latter type of driver might more appropriately be termed a ‘persistent’ or ‘hard core’ speeding offender. While the literature provides us with examples of this issue as it relates to drink driving, it is relatively silent with respect to speeding recidivists and more research is needed in this area [5, 6]. Indeed, we know very little about the characteristics, motivations, and intentions of different types of speeding drivers, yet such a distinction can be important for the development, delivery and evaluation of offender management interventions [7, 8].
At the broadest level, road safety penalties and sanctions aim to eliminate risky/illegal road use altogether via the process of absolute deterrence, whereby offenders are deterred from ever re-offending [9]. Realistically, however, some offenders may not be deterred at all while others are only partly deterred (i.e., the illegal behaviour becomes suppressed but not eliminated altogether). This partial deterrence of illegal behaviour is generally referred to as the marginal deterrent effect of a penalty or sanction [10, 11]. In this regard, it can be argued that any reduction in speeding among offenders will have road safety benefits [12]. Hence, the way in which a ‘reduction’ is determined deserves greater methodological attention and has broader implications for countermeasure evaluation more generally.
Consistent with this argument, determining the net safety benefit of any penalty change on offender behaviour would require measuring both its absolute and marginal specific deterrent effects. Hence, in this paper we propose four measures of recidivism to illustrate a range of ways that the specific deterrent impact of a speeding penalty change in Queensland can be considered: 1) the proportion of offenders who re-offend in a given follow up period (absolute specific deterrent effect); 2) the overall frequency of re-offending during the follow up period (the net absolute and marginal specific deterrent effect); 3) the length of delay to re-offence (marginal specific deterrent effect among re-offenders ); and 4) the average number of re-offences (another measure of the marginal specific deterrent effect among re-offenders ). It is acknowledged that there are many factors that can influence driver behaviour beyond a mere penalty change. Many of these factors, as they relate to the current research, are canvassed later in this paper (e.g., changes in enforcement and public education activities). The data presented in this paper are intended to illustrate issues for consideration when attempting to assess changes in recidivism, rather than providing definitive answers to the question of whether penalty changes deterred future offending.
Of the four proposed recidivism measures, it can be argued that the largest road safety benefit will be gained from the absolute specific deterrent effect of the change in penalties. Thus, the first measure of recidivism that we propose assesses whether there has been an overall reduction in the proportion of re-offenders in the follow up period. If increased penalties resulted in fewer people re-offending, then the overall absolute specific deterrent effect of the penalties can be considered high. If, however, there is no reduction in the proportion of people who re-offend (or the proportion of recidivists remains relatively large), it is still valuable to examine other changes in offending behaviour because each of these measures offer some road safety benefits. The second proposed measure of recidivism (the overall frequency of re-offending) can be assessed in a number of ways and has the potential to capture both absolute and marginal specific deterrent effects because it can be considered across all offenders, only some of whom re-offended in the follow up periods. For the current analysis, this second measure of recidivism was assessed by comparing the average number of r e-offences within both cohorts.
As noted above, there is also value in assessing whether there has been a reduction in the target behaviour among those who did re-offend. Therefore, the third and fourth proposed measures of recidivism assess the marginal specific deterrent effect of the penalty changes because they consider only those offenders who re-offended in the follow up period. Such reductions can be assessed in a number of ways. For the purpose of this paper, we selected two measures that examine the length of delay to re-offence and the average number of offences committed. The first of these examines whether there was a longer time to re-offence while the second measure assesses whether fewer offences, on average, were committed over time. Drivers taking longer to commit a subsequent offence, and/or committing fewer offences are still contributing to a reduction of the target behaviour, and, therefore, the impact of speeding on overall safety levels.
Before discussing the specific details of the current project and analyses conducted for this paper, it is important to note that a repeat offender is someone who, by definition, performs the target behaviour more than once. However, engaging in illegal behaviour and being detected are not synonymous. When dealing with data from official records, such as the speeding offence data used for the current study, one is only able to draw
2010 Australasian Road Safety Research, Policing and Education Conference 3 conclusions about offences that are detected, rather than illegal behaviour overall. Thus, in the current paper, the
term offender is used only to denote drivers who were detected speeding. Project background
In an attempt to address the prevalence of speeding in Queensland, changes were made to the penalties and sanctions associated with speeding offences in 2003 [13]. Increases in monetary penalties for all speeding offences were introduced, along with automatic loss of licence for high-speed offences1. From the data presented in Tables 1 and 2 it can be seen that three main changes occurred to the speeding penalty regim e: 1) the number of offence categories was increased from 4 to 5, effectively narrowing the range of speeds covered by a number of the categories; 2) the monetary fines for all offences were increased, with the largest increases for high-range offences; and 3) automatic licence suspension and an 8 demerit point penalty was introduced for the highest offence category2. At the time, the announcement of these increases in the severity of penalties was justified on the grounds of deterring speeding behaviour. In this regard, however, while many evaluations o f speed enforcement and education programs have been conducted both in Australia and around the world, less attention has been given internationally to assessing the effectiveness of speeding sanctions. Indeed, there is a need to evaluate such measures, particularly because there is little firm evidence from the road safety literature that more severe penalties, in isolation, are effective in reducing offending behaviour and related negative outcomes [14, 15, 16].
Table 1. Speeding offences and penalties in Queensland prior to 17 April 2003
Offence Fine Demerit points
<15 km/hour over speed limit $90 1
15-29 km/hour over speed limit $135 3
30-44 km/hour over speed limit $180 4
>44 km/hour over speed limit $255 6
Table 2. Speeding offences and penalties in Queensland from 17 April, 2003
Offence Fine Demerit points
<13 km/hour over speed limit $100 1
13-20 km/hour over speed limit $150 3
21-29 km/hour over speed limit $250 4
30-40 km/hour over speed limit $300 6
>40 km/hour over speed limit $700 8 + 6 months suspension
The data used for the analyses in this paper form part of a larger dataset that is being used to: profile speeding offenders in Queensland [17]; investigate links between speeding offences, other risky driving behaviours, and criminal history; and evaluate the effect of penalty changes on speeding in Queensland. The current paper uses data collected two years prior and subsequent to the April 2003 penalty changes in order to examine changes in speeding offence patterns among two cohorts of drivers. Specifically, this study describes the application of four measures of recidivism to the speeding offences recorded for the two offender cohorts in order to compare different recidivism outcomes. In line with these measures, and in keeping with the stated intention of reducing speeding by increasing the severity of associated penalties, we propose the following hypotheses:
Hypothesis 1: There will be a reduction in the proportion of speeding offenders who re-offend after the introduction of more severe penalties.
1
Licence suspension for the accumulation of demerit points in Queensland differs according to the type of licence held. For Open licence holders, licence suspension arises from the accumulation of 12 or more demerit points in a continuous three-year period. For Provisional and Learner licence holders, licence suspension applies to the accumulation of 4 or more demerit points in a twelve-month period . At the time of the penalty change examined in this study , double demerit points for high-range speeding offences was not applicable in Queensland but was subsequently introduced on 12 April, 200 6. The introduction of this sanction does not correspond with cohorts examined in this study. 2
It is noteworthy that the penalty changes may have differentially affected licence suspensions which, in turn, may have had an impact on deterring speeding and on the proportion of unlicensed offenders. For instance, prior to the penalty change, driving at speeds of between 30 to 44 km/hour above the posted limit attracted four demerit points. After the penalty change, however, lower speeds (21 and 29 km/hour above the limit) attracted the same demerit penalty. The effect of the altered penalty regime on the potential for licence suspension was not investigated in the current study.
2010 Australasian Road Safety Research, Policing and Education Conference 4 Hypothesis 2:There will be a reduction in the overall frequency of re-offending after the introduction of more
severe penalties.
Hypothesis 3: Among those who re-offend, there will be a longer delay to re-offence after the introduction of more severe penalties.
Hypothesis 4: Among those who re-offend, there will be a reduction in the average number of re-offences committed after the introduction of more severe penalties.
Method
Traffic offence data for two cohorts of speeding offenders were provided to the research team by Queensland Transport from the Transport, Registration and Integrated Licensing System (TRAILS). The two cohorts consisted of driver/riders who committed a speeding offence in May 2001 and drivers/riders who committed a speeding offence in May 2003. Records for two years after these dates were included in the analyses reported in this paper. The first recorded offence in the month was regarded as the index offence. Data obtained included details of this index offence as well as subsequent speeding offences. Offenders who held an interstate or international driver’s licence throughout the period were excluded from analyses because their demographic, licensing and offences histories were unknown. After these exclusions, there were 46,681 drivers/riders in the 2001 cohort and 42,180 drivers/riders in the 2003 cohort.
Differences between the cohorts in the proportion of individuals re-offending in the first and second year were examined using Chi -Square tests for independence. The delay to re-offence and average number of offences were compared using Analysis of Variance (ANOVA). Due to the large sample size, a more stringent alpha of 0.001 was set and effect sizes were calculated. For the Chi-Square analyses, the Phi correlation co-efficient (), was calculated and for the ANOVA, eta squared (2) was calculated in order to provide an estimate of effect size to give a clearer idea of the meaningfulness of any statistical significance found. As suggested by Aron and Aron [18], a and 2value of around 0.10 are considered to be a small effect size, around 0.30 moderate, and around 0.50 or more, a large effect size.
As discussed earlier, the four proposed measures of recidivism are calculated in different ways. For the fi rst measure of recidivism, calculations were based on all offenders in the sample and assessed whether there was a reduction in the proportion of offenders who re-offended within the two year follow up period across both cohorts of drivers. For the second measure, we assessed the average number of offences that were committed by all offenders within the two year follow up period across both cohorts of drivers. However, for the third and fourth measures of recidivism (length of time to re-offence and average number of re-offences), we used data relating only to those drivers who had actually committed a subsequent speeding offence in the follow up period. To summarise, for the first and second measures of recidivism, calculations were based on all offenders in each cohort, while only those who recorded a re-offence were included in calculations for the two remaining measures of recidivism. The fi rst two measures thus focus on the reduction or otherwise in the overall proportion of offenders and offending behaviour within the two cohorts, while the second two measures focus on changes in offending behaviour among only the re-offenders in the cohorts.
Results
Offence records for both offender cohorts (2001 pre-penalty change cohort and 2003 post -penalty change cohort) were examined and compared across the four proposed measures of recidivism.
Recidivism Measure 1: Proportion of offenders who re-offended in the follow up period
This first measure of recidivism examined the overall amount of re-offending by considering the proportion of speeding offenders who re-offended in a two year period before and after the penalty changes and included a comparison of the proportion of offenders who had re-offended by the end of the first and second year of each time period. As can be seen from Table 3, in both cohorts, one third of offenders had committed at least one additional speeding offence within 12 months of their index offence and that this proportion increased by the end of the second year. There was only a trivial decrease in the proportion of drivers detected re-offending by the end of the first year across cohorts. However, by the end of the second year, the percentage of drivers re-offending reduced significantly in the 2003 (post-penalty change) cohort [2(1) = 94.49, p < 0.001; = 0.03]. This result provides support for Hypothesis 1 in that there was a statistically significant reduction in the proportion of speeding offenders who re-offended after the introduction of more severe penalties. While the effect size of this result was small, there was an appreciable reduction of approximately 20% in the proportion
2010 Australasian Road Safety Research, Policing and Education Conference 5 of drivers who re-offended at the end of a two year period. Despite this reduction, however, it is noteworthy that
almost half of the post-penalty change cohort (45.1%) had re-offended by the end of the second year after their index offence. This outcome demonstrates the need to examine potential changes in the behaviour of those who did re-offend to identify any marginal road safety benefits. This is examined further in relation to measures 3 and 4.
Table 3. Proportion of offenders detected re-offending at two time points across both cohorts
Proportion of 2001 offenders who re-offended
Proportion of 2003 offenders who re-offended
Significance
At the end of Year 1 33.3% 33.2% ns
At the end of Year 2 55.7% 45.1% (p< .001, = .03)
Recidivism Measure 2: Overall frequency of offending
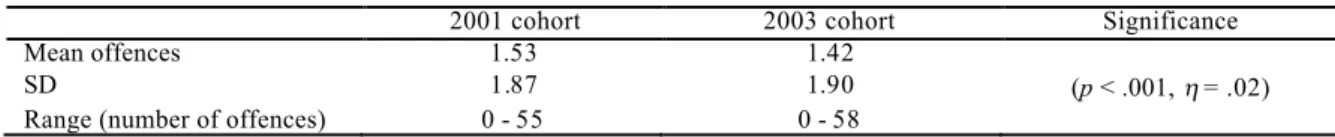
As explained earlier, another way of examining changes in the amount of o ffending that reflects both the absolute and marginal deterrent impacts of the penalty changes is to examine whether any changes occurred in the average number of offences committed in the two follow-up periods. As can be seen from Table 4, there was a statistically significant difference between the pre- and post-penalty change periods in terms of the average number of offences committed [F(1, 88860) = 41.2, p < 0.001]. This result indicates that, on average, drivers committed fewer speeding offences after the increase in penalties; however the effect size was small.
Table 4. Average number of speeding offences committed by all drivers across both cohorts
2001 cohort 2003 cohort Significance
Mean offences 1.53 1.42
SD 1.87 1.90 (p< .001, = .02)
Range (number of offences) 0 - 55 0 - 58
Recidivism Measure 3: Length of delay to re-offence
To investigate this measure of recidivism, the timeframe (number of days) from the index offence to the next offence was examined for those drivers in each cohort who did have a second offence during the two year period. As can be seen from the information presented in Table 5, the mean number of days to re-offence reduced significantly in the post-penalty change time period from 313 days to 285 days [F(1,44398) = 175.0, p < 0.001; = 0.04]. Contrary to expectations, this result indicates that after the introduction of more severe penalties, there was a significantly shorter time between the index offence and the subsequent speeding offence; however both the effect size and the proportional reduction were small.
Table 5. Time to re-offence across both cohorts
2001 cohort of offenders
2003 cohort
of offenders Significance
Mean days to re-offence 313 285
Range (in days) 1 - 730 1 - 730 (p< .001, = .05)
This result does not provide support for Hypothesis 3. Rather than increasing the time to re-offence, the data suggest that drivers who re-offended, re-offended within a shorter timeframe after the increase in speeding penalties.
Recidivism Measure 4: Average number of re-offences
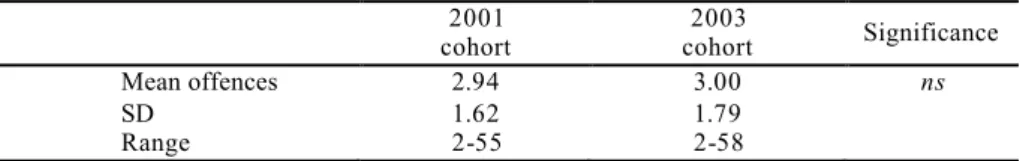
To investigate this measure of recidivism, the average number of offences committed within the first and second years for both cohorts of drivers was examined. As shown in Table 6, there was no statistically significant difference between the pre- and post -penalty change periods in terms of the average number of offences committed [F(1,44398) = 3.38, p = 0.06]. This result indicates that, on average, re-offending drivers did not commit fewer speeding offences after the increase in penalties. Thus, Hypothesis 4 was not supported.
2010 Australasian Road Safety Research, Policing and Education Conference 6 Table 6. Average number of speeding offences among those who re-offended
2001
cohort cohort2003 Significance
Mean offences 2.94 3.00 ns
SD 1.62 1.79
Range 2-55 2-58
In summary, the increase in more severe speeding penalties appears to have produced mixed results across the different measures of recidivism. Table 7 summarises the recidivism outcomes for our sample of speeding offenders in Queensland.
Table 7. Summary of recidivism measure outcomes
Measure of recidivism Hypotheses Outcome
1 Overall proportion of re-offending in the follow up period
1 There will be a reduction in the proportion of speeding offenders who re-offend after the
introduction of more severe penalties
Hypothesis supported. Statistically significant reduction in the proportion of offenders who
re-offended after penalty change; small effect size 2 Overall frequency of
re-offending in the follow up period 2 There will be a reduction in the overall frequency of re-offending after the introduction of more severe penalties
Hypothesis supported. Statistically significant reduction in
the average number of offences committed among all offenders after
penalty change; small effect size 3 Length of delay to re-offence
among re-offenders
3 Among those who re-offend, there will be a longer delay to re-offence after the introduction of more severe penalties
Hypothesis not supported. Contrary finding: statistically significant decrease in the time taken
to re-offend after penalty increase; small effect size
4 Average number of re -offences committed by those who re-offended
4 Among those who re-offend, there will be a reduction in the average number of re-offences committed after the introduction of
more severe penalties
Hypothesis not supported. No statistically significant change in
average number of re-offences after penalty change
Effects of Enforcement
It is important to acknowledge that changes in enforcement may have influenced the number of speeding drivers detected in each cohort. In order to take this into account, the Queensland Police Service provided data relating to the number of speed enforcement hours (camera and radar) and the number of offences detected during those hours. From this, a detection rate (offences per speed enforcement hour) was calculated. As shown in Table 8, there was an increase in speed enforcement hours from pre- (414,699 hours) to post-penalty change (594,093 hours) (an increase of 43%). This suggests that the reduction in proportion of re-offenders in the 2003 cohort might not have been due to an enforcement effect. In fact, the increase in enforcement hours may actually be inflating the number of speeding offences in the post -penalty change period, and therefore suppressing the effect of the penalty change on the recidivism measures. It is also of interest, that the detection rate for speed offences decreased from pre- to post-penalty change. While a range of factors can influence speeding detection rates, it is possible that the reduction is indicative of a general deterrent effect arising from the increased intensity of speed enforcement (as evidenced by the increase in speed camera operating hours) or other changes to the speed management program, such as the changes to speeding penalties.
2010 Australasian Road Safety Research, Policing and Education Conference 7 Table 8. Speeding enforcement hours, offences, and detection rates for both cohorts
2001 cohort 2003 cohort 1stand 2ndyear after index
(May ‘01 – April ’03)
1stand 2ndyear after index
(May ‘03 – April ’05)
Percentage change
Speed enforcement hours1 414,699 594,093 43%
No. of offences 1,170,373 1,121,735 -4%
Detection rate 2.82 1.89
1. Speed camera and radar hours combined.
Discussion
One mechanism for assessing the effectiveness of countermeasures is to determine whether there have been reductions in the target behaviour as a result of their introduction. Examining recidivism rates is one method that may be used to determine the specific deterrent effect of a countermeasure (i.e., how much a countermeasure deters those who have already been caught and punished for committing the offence). To date, the literature provides little in the way of guidance for determining how to measure recidivism and, most commonly, a person who commits the same offence more than once is deemed to be a recidivist or repeat -offender in the road safety context. However, we believe that there is benefit in considering reductions in behaviour across a number of measures and, as such, the current paper used offence data relating to two cohorts of speeding offenders to examine four measures of recidivism relating to increases in speeding penalties in April 2003 in Queensland. It is important to acknowledge that there will be road safety benefits associated with any reduction in speeding behaviour. However, the manner in which a ‘reduction’ is determined is an important and often overlooked concept; one which we believe deserves greater methodological attention.
The first measure of recidivism aimed to measure the absolute specific deterrent effect of the penalty changes. It was hypothesised that, as a result of the introduction of more severe penalties for committing a speeding offence, there would be reduction in the proportion of offenders who re-offended during the follow up period. The results supported this hypothesis, although a substantial proportion (approximately half) of the post-penalty change cohort had re-offended at least once by the end of the second year after their index offence. This relatively high proportion of re-offenders highlights the need to consider other measures of recidivism, particularly those that relate specifically to those who continued to offend (e.g., measures 3 and 4). The second measure of recidivism assessed changes in the average number of offences across the entire cohort (i.e., both those who re-offended and those who did not). The results supported the second hypothesis; on average, drivers committed fewer speeding offences in the two years following the penalty increases, although the effect size was small. It should be noted that this measure included the proportion of the cohorts that did not re-offend. As this proportion was higher in the 2003 cohort, the mean number of o ffences for this cohort was therefore reduced, reflecting the relatively strong influence of absolute specific deterrence on the related outcome.
The results relating to the remaining two proposed measures of recidivism (length of delay to re-offence and average number of re-offences among those who re-offended) did not provide support for our hypotheses. With regard to length of delay to re-offence, greater road safety benefits could be anticipated if drivers refrain from speeding for longer periods of time (i.e., speed less often). However, the results indicated that after the introduction of more severe penalties, there was actually a shorter time to re-offence rather than the hypothesised longer timeframe. Similarly, when looking at the average number of speeding offences committed after the increased penalties were introduced, the results suggested no significant difference between the pre-and post-change offender cohorts for those who re-offended.
To summarise our results, it appears that, in the current sample, the increased speeding penalties could be considered to have had an absolute specific deterrent effect for some drivers because fewer of them re-offended and, on average, fewer speeding offences overall were committed during the time period selected for this study (recidivism measure #1 and #2). However, as noted above, measure #2 strongly reflects the absolute deterrent effect found in measure #1. Also, further exploration is needed to exclude the influence of other factors. Among those who did re-offend, there appears to have been little or no marginal deterrent effect of the more severe penalties, because we did not find the hypothesised changes in the two measures that related specifically to the behaviour of those who re-offended (i.e., recidivism measures #3 and #4). Speed enforcement data were also analysed to explore whether the changes in re-offence patterns may have been influenced by changes in speed enforcement activity. This analysis indicated that the speed enforcement operational hours increased from the
2010 Australasian Road Safety Research, Policing and Education Conference 8 pre to post-penalty change period, suggesting that the reduction in speeding offenders and related offences
observed in the follow-up period was not due to an enforcement effect.
As noted earlier, a marginal deterrent effect refers to the situation where increases in penalties translate to some form of reduction in the target behaviour, rather than elimination of it altogether (absolute deterrent effect) [10, 11]. Our findings are consistent with the review that examined recidivism among drivers in New South Wales who had received a court -imposed fine for driving offences between 1998 and 2000 [19]. The review concluded that there was little evidence of a marginal deterrent effect of fines for repeat offenders and that an increase in monetary fines and the introduction of licence disqualification would have a limited impact on deterring recidivist offenders. Interestingly, the review authors noted that speeding offences were the only driving offence category to register a significant effect relating to penalty increases. However, the direction of the effect was contrary to that proposed by a deterrence hypothesis, such that longer periods of licence disqualification (i.e., more severe penalty) resulted in an increased risk of re-offending among the sample.
As noted earlier, there is limited evidence to indicate that increasing the severity of sanctions and penalties, in isolation, can deter offending. Our results contribute to the uncertainty of this issue and demonstrate that the mechanisms used to assess recidivism and specific deterrent effects can produce differential outcomes when evaluating countermeasures. Moreover, there are a range of issues relating to penalty increases that warrant mention. In the circumstances relating to the current paper, penalties were increased with the intention o f reducing speeding on the road in Queensland. For this intention to be realised, a number of assumptions about potential offenders need to be met. For instance, the success of increased penalties in deterring speeding relies on drivers: 1) being aware that penalties have increased; 2) perceiving the new penalties as sufficiently severe enough to want to avoid them; 3) believing that the new penalties will apply if caught [11].
There are a number of limitations acknowledged with a study of this nature that should be considered when interpreting the findings. Firstly, there are limitations inherent in using routinely collected data because it is collected primarily for administrative, rather than for research purposes. As such, the data are limited in some respects with regard to the level of sensitivity and specificity required for research of this nature. In addition, there can be errors in recording and coding that lead to inaccurate or incomplete data. Secondly, it is acknowledged that there are a range of other issues that may have influenced the current results that have not been accounted for in the current analyses. Across the two selected time periods, changes in public education campaigns, levels of driving exposure, and levels of police enforcement may have differentially contributed to speeding behaviour in Queensland. Although the intensity of speed enforcement activity across the study period was examined via hours of operation, it is acknowledged that other aspects of speed enforcement practice (e.g., deployment practices and visibility) may impact on detection rates. While the policies relating to these issues appear to have remained stable across the two time periods, this issue requires further examination.
Future research
The current findings highlight a number of areas for future research endeavours. From a behavioural countermeasure perspective, there is still much that we need to understand about repeat speeding offenders, the factors that influence re-offending, and the deterrent effect of different penalties on speeding behaviour. The current speeding penalties in Queensland are based only on the speed at whi ch drivers are detected (see Table 2) without reference to previous offence history. Although there is a cumulative effect of penalties with regard to demerit points and licence loss attached to the current speeding penalties, this approach is at odds with drink driving penalties, where, for example, there are additional penalties and sanctions applied to repeat offenders. Indeed, it has been suggested that repeat speeding offenders should receive more severe penalties than first time offenders [17, 20]. This issue requires greater research attention in order to establish whether this is an effective tool to manage speeding offenders.
From a methodological perspective, the ways in which recidivism rates are defined and calculated also deserve greater research attention. To date, there are limited examples of definitive definitions of recidivism in the literature and the concept appears somewhat uni-dimensional. There is further refinement possible in measures of recidivist behaviour to assist in assessing the effectiveness of speeding countermeasures. There is, for example, at least one other way to consider recidivism with respect to the current dataset. An assessment of the severity of repeat offences would provide additional insights into how behaviour m ay have changed as a result of increased penalties for speeding. Across cohorts, there is the potential to examine whether there was a reduction in the level of severity of subsequent offences. In other words, did more severe penalties result in those drivers who continued to exceed the speed limit doing so at slower speeds? To this end, the authors propose to conduct such analyses to allow comparisons across the various recidivism measures. In addition, we recognise the need to account for changes in enforcement activity, public education campaigns, and driving
2010 Australasian Road Safety Research, Policing and Education Conference 9 exposure across the life of this study. Therefore, we also propose to use data from partner agencies (e.g.,
information about changes in fuel sales in Queensland as a measure of overall driving expos ure) to assess the influence of such factors on current results. Together, these results will contribute to our understanding of countermeasure evaluation methods.
Finally, we believe that there is a need to focus research attention on examining the potential differential effects of speeding penalties across different offender groups for two reasons. Firstly, as noted earlier, the change in penalties was most notable for range speeding offences and included immediate licence loss for a high-range speeding offence for the fi rst time in Queensland (see Tables 1 and 2). It is possible that the results presented in this paper reflect the situation that ‘less hard core’ repeat offenders were deterred by the penalty change more so than ‘more hard core’ offenders. Therefore, there is a need to evaluate the effect of immediate licence loss for high-range offenders. Secondly, previous investigations of this cohort of drivers revealed that high-range offenders were more likely to have committed other offences (e.g., alcohol, unlicensed driving, dangerous driving, and seatbelt offences) than low-range offenders [17]. As such, this group of drivers appear to pose unique and significant challenges in managing risky road use.
Acknowledgements
The authors acknowledge the funding support provided by the Australian Research Council and the funding support and provision of data from the Department of Transport and Main Roads, Queensland Police Service, and the Office of Economic and Statistical Research.
References
1. Wagenaar, A. C., Maldonado-Molina, M. M., Ma, L., Tobler, A. L., & Komro, K. A. (2007). Effects of legal BAC limits on fatal crash involvement: analyses of 28 states from 1976 through 2002. Journal of Safety Research, 38(5), 493-499.
2. Freeman, J., Liossis, P., Schonfeld, C., Sheehan, M., Siskind, V., & Watson, B. (2006). The self-reported impact of legal and non-legal sanctions on a group of recidivist drink drivers. Transportation Research Part F, 9, 53-64.
3. Hedlund, J., & Fell, J. (1995). Repeat Offenders and Persistent Drinking Drivers in the U.S. Paper presented at the Proceedings of the Association for the Advancement of Automotive Medicine 39th Annual Conference, USA.
4. Yu, J. (2000). Punishment and alcohol problems recidivism among drink-driving offenders. Journal of Criminal Justice, 28, 261-270.
5. Lawpoolsri, S., Li, J., & Braver, E. R. (2007). Do speeding tickets reduce the likelihood of receiving subsequent speeding tickets? A longitudinal study of speeding violators in Maryland. Traffic Injury Prevention, 8, 26-34.
6. Manderson, J., Siskind, V., Bain, C., & Watson, B. (2004). Speeding recidivism and road safety.Paper presented at the Australasian Road Safety Research Policing Education Conference, Perth.
7. Delhomme, P., Grenier, K., & Kreel, V. (2008). Replication and Extension: The Effect of the Commitment to Comply With Speed Limits in Rehabilitation Training Courses for Traffic Regulation Offenders in France. Transportation Research Part F, 111, 192-206.
8. McKenna, F. P. (2005). Why do drivers break the speed limit? Paper presented at the Behavioural Research in Road Safety 15th Seminar, London.
9. Gibbs, J. P. (1979). Assessing the deterrence doctrine: A challenge for the social and behavioral sciences. American Behavioral Scientist, 22, 653-677.
10. Grasmick, H. G., & Bryjak, G. J. (2001). The deterrent effect of perceived severity of punishment. Social Forces, 59(2), 471-491.
11. von Hirsch, A., Bottoms, A. E., Burney, E., & Wikstrom, P. O. (2000). Criminal deterrence and sentence severity. Oxford: Hart Publishing.
12. Fildes, B. N., Langford, J., Andrea, D., & Scully, J. (2005). Balance between harm reduction and mobility in setting speed limits: A feasibility study AP- R272/05: AUSTROADS.
13. Queensland Transport. (2002). Queensland Road Safety Action Plan 2002-2003, Brisbane.
14. Briscoe, S. (2004). Raising the bar: Can increased statutory penalties deter drink-drivers? Accident Analysis and Prevention, 36, 919-929.
15. Elvik, R., & Christensen, P. (2006). Deterrent effect of increasing fixed penalties for traffic offences: Norwegian experience.Paper presented at the Transportation Research Board 85th Annual Meeting.
2010 Australasian Road Safety Research, Policing and Education Conference 10 16. Nichols, J. L., & Ross, H. L. (1990). The effectiveness of legal sanctions in dealing with drinking
drivers. Alcohol, Drugs and Driving, 6(2), 33-60.
17. Watson, B., Watson, A., Siskind, V., & Fleiter, J. J. (2009). Characteristics and predictors of high-range speeding offenders. Paper presented at the Australasian Road Safety Research Policing Education Conference, Sydney.
18. Aron, A., & Aron, E. N. (1991). Statistics for psychology(2nd ed.). Upper Saddle River, New Jersey: Prentice Hall.
19. Moffatt, S., & Poynton, S. (2007). The deterrent effect of higher fines on recidivism: Driving offences. Crime and Justice Bulletin, NSW Bureau of Crime Statistics and Research, March.
20. Delhaye, E. (2007). The Enforcement of Speeding: Should Fines be Higher for Repeated Offences? Transportation Planning and Technology 30(4), 355 - 375.