Conservation Trust Fund
for financial year 2009
Investment Survey
Cover Photos Contributed by Lorenzo Rosenzweig, FMCN MexicoInvestment Survey
Marja J. Preston
Consultant
Ray Victurine
Wildlife Conservation Society
Prepared in collaboration with the Conservation Finance Alliance and
the Latin American and Caribbean Network of Environmental Funds
September 2010
Conservation Trust Fund
Photo Contributed by Lorenzo Rosenzweig, FMCN, Mexico
Table of Contents
Acknowledgements 1 Foreword 3 Executive Summary 5 Introduction 7 - Background - Objectives 8 Methodology 9- Survey format, origination - Data collection
- Confidentiality
- Fiscal Year 10
- Statistical Variants - Average Returns
Results and Analysis 11
- Description of Participating Funds - Endowment and Sinking Funds
- Area and Age of Participating Funds 12 - Latin America and Caribbean
- Africa
- Asia 13
- Overall Rates of Return
- Endowment Investment Performance - Sinking Fund Investment Performance 14 - Endowment Returns by Region
- Africa 15
- Asia
- Latin America and the Caribbean - Sinking Fund Returns by Region - Comparison of Endowment and
Sinking Fund Returns 16
- Types of Benchmarks Used 17 - Currency and Inflation Adjusted Returns
- Asset Allocation 19
- 2009 Endowment Asset Allocation - 2009 Sinking Fund Asset Allocation - Asset Allocation Comparison from
2008 to 2009 20
- Asset Allocation in Domestic, US and International Markets
Investment Management 21
- Organizational responsibility for - Investment Decisions
- Investment Policy
- Donor Restrictions 22
- Investment Objectives
- Management, Consultants, etc.
- Consultant Fees and Services Provided 23
Contribution of CTFs to Conservation 24 - Conservation Achievements of CTFs - Advantages of Endowment Funds 25 - Difficulties Encountered in Managing
Fund Resources 26
- New Opportunities for Involvement of CTFs
- Advice for New Trust Funds 27
Conclusions 28
Funds Participating in 2009 Survey 30 Newly Established Funds and Public Funds 32
Acknowledgements
This report would not have been possible without the assistance of a number of individuals from the Conservation Finance Alliance, RedLAC, FMCN and Acacia Partners who took the time to review and comment upon the survey and working drafts. We would particularly like to thank the following individuals for their assistance in drafting the survey and this report: Scott O’Connell of Acacia Partners, Camila Monteiro of RedLAC, Lorenzo Rosenzweig and his staff from Fondo Mexicano para la Conservación de la Naturaleza, John Adams and Patrick Drum of the Arbor Group, Mónica Morales and Andrés Muñetón of Heyman and Associates, and members of the Environmental Funds Working Group of the Conservation Finance Alliance. Primary funding for the project has been provided by Acacia Partners, with additional support for translation and dissemination provided by the French Global Environment Fund.This report is based on the responses of participating Conservation Trust Funds (CTFs) and we would like to thank all those who took the time from their many responsibilities to complete the survey, provide comments and suggestions, and contribute photos for this project.
Women’s Association Training, Photo Contributed by Tany Meva, Madagascar
Foreword
Dear Fund Manager,As irreplaceable parts of nature are increasingly threatened, it gives great hope to see conservation trusts flourishing around the world. Your work in Africa, Asia, and the Americas on behalf of plants, animals, and habitats is critical to protecting our natural world.
Judging by meetings of the Funds in Dakar, Belize City, Paris, Cartagena, and Geneva, the CTIS is serving as intended: to help the Funds think about investing in a thoughtful, systematic way, to promote sharing of information and learning from the experience of other Funds, and hopefully, by shining a light on investment returns of their peers, those Funds that hope to improve their returns can make needed changes.
As the 2007 survey showed, the trusts entered 2008 with conservatively positioned portfolios. Whether this was due to skill, clairvoyance, or happenstance, it was fortunate. On average, the trusts survived the financial crisis with small losses and enjoyed satisfactory returns during the market recovery in 2009. As this year’s survey shows, the CTFs have significantly outperformed the S&P 500 over the last three and five calendar years.
Yet, the underlying data suggest there are reasons for concern. Fixed income returns have been outstanding over the last few years as interest rates in many countries have declined. It is not likely that bond returns will be as generous over the next five years. Furthermore, governments around the world are running their printing presses with inflation and rising interest rates a likely outcome. So great is the required issuance of government bonds to finance budget deficits that interest rates might increase even in the absence of inflation.
The average CTF has about 49% of its assets in fixed income and almost 16% in cash. Both of these assets are vulnerable to inflation. Twelve funds have more than 60% of their assets in fixed income. When bonds generate yields higher than the ongoing rate of inflation, they generate “real” returns, and such income can be used to fund conservation projects and provide a safe harbor during financial crises. However, investors need to be aware of the risks associated with bonds.
4
At the time of this writing, the US year treasury yields 2.5%. If interest rates rose to 4.0%, the price of a 10-year treasury would drop by approximately 11%, more than four 10-years worth of interest coupons. Skeptics might counter such a large increase in interest rates is unlikely. Yet rates on the 10-year treasury were 4.0% back in April of…2010! A proportionate rise in 30-year treasury rates would cause a drop in price of nearly 18%. If 30-year rates were to return to their 7.3% average over the past three decades, today’s 30-year treasury could drop in value by 50%.This does not mean a significant allocation to bonds is inappropriate. It does mean bonds, especially medium to long dated bonds and bonds, owned through mutual funds which have no maturity date, hold significant risk if inflation and/or interest rates increase. It also suggests that the 30% average equity allocation of the CTFs may be too low if assets are to grow in real terms over long time periods.
As we suggested last year, the return on stocks over the next ten years, particularly after periods of stock market decline, are almost inevitably going to be higher than on bonds or cash. Over the long term, equities, bought at reasonable valuations, have earned returns above inflation and enabled owners to grow their assets at more than satisfactory rates. Given that the critical work of the conservation trusts will take place over decades, can CTFs generate the needed returns to preserve the habitats entrusted to them, while still protecting against inflation, by holding 65% in bonds and cash?
Investors are always conditioned by the immediate past and all the more so after harrowing markets like we experienced in 2008 and early 2009. However, those that can think long term invariably achieve better results. As the years go by, we have taken to thinking, “Everyone should just think long term—it seems to come around soon enough anyway!”
Investing is difficult and quality money managers are hard to find. We urge CTFs to not accept mediocre performance or slipshod advice. At the same time, they should avoid going for the appearance of good past returns alone— there are qualitative issues in choosing money managers as well. The future of CTFs’ endeavors is important. Search for excellent money managers and keep your investments appropriately conservative until you find them.
We are pleased to support the Conservation Trust Fund Investment Survey and its contribution to your important efforts. We thank all of our partners, as there is much good work to do in conservation, and far too little funding.
With our best regards,
Greg Alexander Alexander Foundation Acacia Partners
Executive Summary
This report represents the third in a series of studies covering the financial performance of Conservation Trust Funds from 2006 through 2009. Conservation Trust Funds are innovative financing mechanisms developed to provide long term financing for conservation and sustainable development. Over 50 Conservation Trust Funds (CTFs) have been established in Africa, Latin America and the Caribbean, Asia and Eastern Europe. The 39 trust funds participating in this study manage over $519 million dollars and operate under a variety of financing structures, including endowments, sinking funds and revolving funds.The investment returns reported by participating CTFs for the 2009 financial year, (January 1st through December 31st), reflect both the recovery of the market and the ability of the Funds to carefully and effectively manage their investments. All of the Funds reporting investment data show positive returns for 2009, some with substantial improvements over the last two years. Investment returns range from 1.0% to 27.1% for the financial year ending December 31, 2009, with the average at 14.4%. The returns reported in this study reflect a variety of investment strategies, from investments held in local banks or fixed deposit receipts, to more complex investment portfolios managed by international investment firms.
The investment return data for 2009 demonstrates a significant rebound from the 2008 investment performance when participating trust funds suffered losses averaging 7%. At the end of 2008, the Funds indicated a commitment to more closely monitor their investments and allocation strategies, and to work with their investment advisors to strengthen investment policies and position themselves for long-term growth. That strategy coupled with the strong rebound in the equities markets appears to have worked as participating funds averaged returns of more than 14% in 2009. In addition, Conservation
Photo Contributed by Lorenzo Rosenzweig, FMCN, Mexico
6
Summary of Endowment and Sinking Fund Average Returns, 2009 Financial Year
The following table provides a quick snapshot of the investment performance and the changes in performance and asset allocation over time as reported by the participating funds since the inception of this survey. The investment information for 2006 is based on a total of 17 reporting funds. Since that time the survey has been able to include data from more than 30 Conservation Trust Funds.
This year, in addition to financial information, Conservation Trust Funds also reported on development of new programs that diversify their leadership roles and create new funding sources. Examples include programs to create cash flow from the sale of carbon credits (e.g. REDD), and investment in clean energy and other climate change mitigation efforts. These new opportunities may offer Funds even greater latitude to contribute to meeting long-term conservation financing needs around the world.
3
Executive Summary
This report represents the third in a series of studies covering the financial performance of Conservation Trust Funds from 2006 through 2009. Conservation Trust Funds are innovative financing mechanisms developed to provide long term financing for conservation and sustainable development. Over 50 Conservation Trust Funds (CTFs) have been established in Africa, Latin America and the Caribbean, Asia and Eastern Europe. The 39 trust funds participating in this study manage over $450 million dollars and operate under a variety of financing structures, including endowments, sinking funds and revolving funds. The investment returns reported by participating CTFs for the 2009 financial year, (January 1st through December 31st), reflect both the recovery of the market and the ability of the Funds to carefully and effectively manage their investments. All of the Funds reporting investment data show positive returns for 2009, some with substantial improvements over the last two years. Investment returns range from 1.0% to 27.1% for the financial year ending December 31, 2009, with the average at 14.4%. The returns reported in this study reflect a variety of investment strategies, from investments held in local banks or fixed deposit receipts, to more complex investment portfolios managed by international investment firms.Summary of Endowment and Sinking Fund Average Returns, 2009 Financial Year
The investment return data for 2009 demonstrates a significant rebound from the 2008 investment performance when participating trust funds suffered losses averaging 7%. At the end of 2008, the Funds indicated a commitment to more closely monitor their investments and allocation strategies, and to work with their investment advisors to strengthen investment policies and position themselves for long‐term growth. That strategy coupled with the strong rebound in the equities markets appears to have worked as participating funds averaged returns of more than 14% in 2009. In addition, Conservation Trust Funds have enjoyed healthy average three‐ and five‐year returns of 7% and 8% respectively, demonstrating CTF investments strategies are prudent, minimizing risk while focusing on achieving capital growth.Photo Contributed by Lorenzo Rosenzweig, FMCN Mexico
Trust Funds have enjoyed healthy average three- and five-year returns of 7% and 8% respectively, demonstrating CTF investments strategies are prudent, minimizing risk while focusing on achieving capital growth.
4 The following table provides a quick snapshot of the investment performance and the changes in performance and asset allocation over time as reported by the participating funds since the inception of this survey. The investment information for 2006 is based on a total of 17 reporting funds. Since that time the survey has been able to include data from more than 30 Conservation Trust Funds.
Return and Asset Allocation Average
2009 2008 2007 2006
Average Investment Return 14.4% -6.9% 8.6% 12.2%
Asset Allocation Equities 30% 25% 31% 23% Fixed Income 49% 43% 39% 58% Cash 16% 30% 27% 14% Alternatives 5% 2% 3% 5% This year, in addition to financial information, Conservation Trust Funds also reported on development of new programs that diversify their leadership roles and create new funding sources. Examples include programs to create cash flow from the sale of carbon credits (e.g. REDD), and investment in clean energy and other climate change mitigation efforts. These new opportunities may offer Funds even greater latitude to contribute to meeting long‐term conservation financing needs around the world. 4 The following table provides a quick snapshot of the investment performance and the changes in performance and asset allocation over time as reported by the participating funds since the inception of this survey. The investment information for 2006 is based on a total of 17 reporting funds. Since that time the survey has been able to include data from more than 30 Conservation Trust Funds.
Return and Asset Allocation Average
2009 2008 2007 2006
Average Investment Return 14.4% -6.9% 8.6% 12.2%
Asset Allocation Equities 30% 25% 31% 23% Fixed Income 49% 43% 39% 58% Cash 16% 30% 27% 14% Alternatives 5% 2% 3% 5% This year, in addition to financial information, Conservation Trust Funds also reported on development of new programs that diversify their leadership roles and create new funding sources. Examples include programs to create cash flow from the sale of carbon credits (e.g. REDD), and investment in clean energy and other climate change mitigation efforts. These new opportunities may offer Funds even greater latitude to contribute to meeting long‐term conservation financing needs around the world.
Photo Contributed by Lorenzo Rosenzweig, FMCN Mexico
Introduction
Background
This project was conceived as a mechanism to provide information on fund management and to compare endowment investment strategies and performance over time. Our hope is that this study will promote information sharing and networking regarding best practices for investment management, especially for those funds that are just beginning to establish their structures and policies. This report will also provide the investment, donor, and conservation communities with an assessment of the continuing efficacy and reliability of Conservation Trust Funds (CTFs) as a mechanism to achieve long term sustainable financing of biodiversity.
Conservation Trust Funds are innovative financing mechanisms developed to provide long term financing for conservation and environmentally sustainable development. We estimate over 50 Conservation Trust Funds have been established in Africa, Latin America and the Caribbean, Asia and Eastern Europe, and new funds continue to be launched in these regions.
The CTFs participating in this report are structured as endowments or sinking funds, with some CTFs managing both types of investment funds. The CTFs that manage endowments generally spend only the income from their investments, maintaining the capital as a permanent asset. This allows for longer term funding for projects such as the management of protected areas. Other CTFs manage sinking funds, spending the income from investment as well as a portion of their capital each year until the fund is expired. This type of structure allows sinking funds to finance larger, medium-term projects or a series of small grants. Some of the CTFs participating in this study indicate that they are transitioning from sinking funds to endowments, moving the investment income of the sinking fund into an endowment to create longer term financing opportunities.
National Park of Banc d’Arguin, Mauritania. Photo Contributed by Cécile Lamour, FIBA. Photo Contributed by Lorenzo Rosenzweig,
FMCN Mexico
8
Conservation Trust Funds are capitalized by bilateral debt swaps and multilateralagency donations, as well as by grants from governments, foundations, non-profit organizations, individuals and revenue-generating activities. Most operate as foundations and are managed by a diverse board, independent of Government, with representation from the public and private sectors.
This report provides information regarding how the invested funds of CTFs are managed; how assets are allocated; and the changes CTFs have made to their investment strategies in the face of global economic challenges. In addition, this report addresses the role of Conservation Trust Funds as leaders of change in their respective countries, exploring the types of services CTFs provide beyond grant programs and financing of protected areas.
This study has been a collaborative effort between the Wildlife Conservation Society and RedLAC, the Latin American and Caribbean Network of Environmental Funds whose representative, the Mexican Fund for Nature Conservation (FMCN), and its Secretariat hosted by the Brazilian Biodiversity Fund (Funbio), participated in creation of the survey and coordinated the survey of its members funds.
Objectives
The objectives of this study are to assess the financial performance of Conservation Trust Funds and to show the various investment strategies they employ.
This report will focus on the following financial information gathered through surveys of each participating Fund:
• Fund size and structure • Investment returns
• Asset and currency allocation
• Types and fees of investment advisors
• Investment policies and response to current market changes
In addition, this report will explore the role of Conservation Trust Funds in shaping national conservation strategies, touching on the advantages of the funds as financing mechanisms, the role of CTFs in creating and sustaining national policies, and the difficulties experienced by the Funds, as well as the opportunities open to them in the future.
Photo Contributed by Lorenzo Rosenzweig, FMCN Mexico
Methodology
Survey format, origination
This report is designed to gather financial information from privately directed Conservation Trust Funds that manage endowments, sinking funds or revolving funds with the mandate to provide long-term financing for conservation and sustainable development. Development of the CTIS survey drew on the experience of the National Association of College and University Business Officers (NACUBO), which publishes an annual survey of the performance of US College and University endowments.
Data collection
The survey for the financial year ending December 31, 2009 was administered in a Word-based format and was emailed to all participating Funds. The survey was available in English, Spanish and French to ensure ease of accessibility and to garner greater participation. An initial introductory cover letter and a hard copy of the survey, as well as a copy of the 2007-2008 CTIS report were mailed to all potential participants in April 2010. The RedLAC Executive Committee distributed the survey to its member Funds and provided follow-up to ensure full participation of its membership. RedLAC was instrumental in collecting survey information from all of its members. During the process repeat emails reminders were sent to Funds and in some cases phone calls were made to elicit responses to the survey questions.
Confidentiality
The CTIS project is committed to maintaining the confidentiality of each of the Fund’s individual data submissions. Contact information for each of the participating Funds is provided in the report; however, all financial data is reported anonymously to ensure that the Funds are not placed at an unfair advantage by disclosure of information. The objective of the report is to share
Archipel des Bijagos, Guinée-Bisau. Photo Contributed by Cécile Lamour, FIBA.
10
information and support the development of effective investment strategies.Each Fund is therefore able to compare its performance to the average returns of Funds within similar size categories and with the average returns of all Funds. Where individual returns are listed, each Fund is assigned a random identification number.
Fiscal Year
All data and reporting are based on the financial year 2009 ending December 31st unless noted. All performance data are reported net of investment management fees and expenses.
Statistical Variants
Survey participants were encouraged to answer as many of the questions as possible; however some of the CTFs were unable to fill in data for all of the categories. Therefore, the data tables in this report do not necessarily reflect all participants. Each data table indicates the number of funds represented in the analysis either within the table itself or in a footnote below the table.
Average Returns
Following procedures used in the NACUBO study, average values provided in this report are calculated as equal-weighted averages, meaning that each reporting Fund has an equal influence on the outcome of the average calculation regardless of the size of the endowment. This allows each individual Fund to compare its returns to other Funds participating in this study. For informational purposes dollar-weighted averages (e.g. weighted in terms of the size of the endowment) may also be calculated and are reported in some of the tables as noted for 2009 returns.
Heliconia, Protected Natural Area Normandia, Photo Contributed by FIAES, El Salvador
PN Sajama Protected Area, Photo Contributed by FUNDESNAP, Bolivia
Results and Analysis
Description of Participating Funds
Conservation Trust Funds participating in this study manage both endowments and sinking funds. Most all of the Funds are established as private foundations or trusts, though a number are Non-governmental Organizations (NGO) or have been incorporated as not-for-profit Limited Liability Corporations (LLC) governed by charity and trust law. The funds are generally established in the country where they operate and are managed by a board of directors with members from both the private and public sectors. In some cases, funds have been established in third-party countries due to legal constraints or administrative necessity.
Endowment and Sinking Funds
A number of comments were received from both Funds and CFA members last year requesting that the study analyze the investment strategies for endowment and sinking funds separately since the two types of funds often have different time horizons and investing requirements. Endowment funds are long-term funds spending the investment income to fund long-term conservation projects, such as management of protected areas. Sinking funds are short to medium-term funds spending both principal and investment income to fund shorter-term projects.
Endowment Fund: A fund spending investment income or a fixed percent of its asset value each year, with the goal of preserving and growing the capital as a permanent asset. Sinking Fund: A fund that disburses its entire principal and investment income over a fixed period of time.
Revolving Fund: A fund that receives new income on a regular basis, such as tourist taxes, user fees, etc., to replenish or augment the original capital.
Mutwa herding goats, Photo Contributed by BMCT, Uganda
12
Area and Age of Participating Funds
Latin America and Caribbean
Conservation Trust Funds are well established in the Latin American and Caribbean region, with an active network, RedLAC, providing opportunities for communication and training amongst its member Funds. The majority of the Funds responding to this survey are in that region, with 20 Funds participating in the study this year. Sixteen of the Latin American and Caribbean Funds reported investment information, and two new Funds submitted surveys but do not have information on investment returns at this time. Two additional publicly managed Funds submitted information on their governance structure and activities. The average length of operation for the Funds in this region is 11 years, with a range from one to 17 years.
Africa
A total of 11 Funds in Africa filled out surveys this year, an increase of two over the previous year. Nine of these Funds reported investment return information for the 2009 financial year. Two Funds have just established their endowments and have begun investing in 2009. African Funds range in length of operation from Funds established in 2009, to Funds that have been in operation for 20 years.
The formation of new Conservation Trust Funds in Africa is continuing, especially in francophone Africa, so the number of Funds reporting from Africa is likely to increase over time. In addition to the 11 Funds filling out surveys, two new African Funds responded by email with updates on their Fund establishment process.
Figure 1. Number of Participating Funds by Region
9 Figure 1. Number of Participating Funds by Region Africa A total of 11 Funds in Africa filled out surveys this year, an increase of two over the previous year. Nine of these Funds reported investment return information for the 2009 financial year. Two Funds have just established their endowments and have begun investing in 2009. African Funds range in length of operation from Funds established in 2009, to Funds that have been in operation for 20 years. The formation of new Conservation Trust Funds in Africa is continuing, especially in francophone Africa, so the number of Funds reporting from Africa is likely to increase over time. In addition to the 11 Funds filling out surveys, two new African Funds responded by email with updates on their Fund establishment process. Asia A number of long established Funds in Asia also reported this year. Eight Funds in Asia responded to our inquiries. Seven Funds submitted investment information, while one Fund filled out the survey but does not yet have investment return information to report. One additional Fund responded with an update on the Fund status. The most established Fund in the region has been in existence for more than 18 years.
Photo Contributed by MMCT, Malawi
13
Asia
A number of long established Funds in Asia also reported this year. Eight Funds in Asia responded to our inquiries. Seven Funds submitted investment information, while one Fund filled out the survey but does not yet have investment return information to report. One additional Fund responded with an update on the Fund status. The most established Fund in the region has been in existence for more than 18 years.
Overall Rates of Return
Many of the CTFs made changes to their investment strategies after experiencing losses in 2007 and 2008, and were able to take advantage of the recovery in 2009 to show gains. Conservation Trust Funds reporting endowment and sinking fund investment return information for fiscal year 2009 enjoyed average returns of 14.4%, an impressive turn from the 7 percent averages losses in 2008.
The CTFs’ one-, three- and five-year average rates of return for the period between 2005-2009 are shown in Tables 1 and 2 below. Five-year returns for endowments and sinking funds are very similar. The average endowment return over five years was 7.9 percent, while the average for sinking fund return is 8.0 percent over the same five-year period.
The S&P 500 recorded a five-year average return of approximately three percent (3%) for that same period. The CTFs all reported returns that outperformed the S&P 500 over the 5-year period ending in 2009.
Endowment Investment Performance
The group of smaller CTFs (assets less than $10 million in US dollar equivalent) experienced the highest returns in 2009, at an average of 17.8 percent. The group of mid-size CTFs (between 10 and 20 million US dollar equivalent) experienced gains of 13.0 percent. The larger endowments had more conservative returns in 2009, averaging 11.8 percent.
Table 1. Average Endowment Returns by Fund Size, 2009
Photo Contributed by WWF, South Africa
Overall Rates of Return
Many of the CTFs made changes to their investment strategies after experiencing losses in 2007 and 2008, and were able to take advantage of the recovery in 2009 to show gains. Conservation Trust Funds reporting endowment and sinking fund investment return information for fiscal year 2009 enjoyed average returns of 14.4%, an impressive turn from the 7 percent averages losses in 2008. The CTFs’ one‐, three‐ and five‐year average rates of return for the period between 2005‐2009 are shown in Tables 1 and 2 below. Five‐year returns for endowments and sinking funds are very similar. The average endowment return over five years was 7.9 percent, while the average for sinking fund return is 8.0 percent over the same five‐year period. The S&P 500 recorded a five‐year average return of approximately three percent (3%) for that same period. The CTFs all reported returns that outperformed the S&P 500 over the 5‐year period ending in 2009 as indicated in Table 1.
Endowment Investment Performance
The group of smaller CTFs (assets less than $10 million in US dollar equivalent) experienced the highest returns in 2009, at an average of 17.8 percent. The group of mid‐size CTFs (between 10 and 20 million US dollar equivalent) experienced gains of 13.0 percent. The larger endowments had more conservative returns in 2009, averaging 11.8 percent.
Table 1. Average Endowment Returns by Fund Size, 2009
Percent Average Annual Endowment Fund Returns by Fund Size
Size Category Total Assets (USD) 2009 3-Year Average 5-Year Average
<$10M 47,945,513 17.8 8.3 9.6
$10-20M 111,703,562 13.0 6.6 6.9
>$20M 284,107,958 11.8 4.4 6.1
Equal-Weighted Average All Funds 14.8 6.8 7.9
Dollar-Weighted Average All Funds 14.8 *26 endowment funds reported investment returns
Sinking Fund Investment Performance
Sinking funds report investment returns in a range similar to that of the endowment funds. Sinking funds managing less than $10 million US dollars experienced returns averaging 11.4 percent, while the larger funds, managing $10‐20 million reported higher returns, on average 15.7 percent.
Table 2. Average Sinking Fund Returns by Fund Size, 2009
Percent Average Annual Sinking Fund Returns by Fund Size
Size Category Total Assets (USD) 2009 3-Year Average 5-Year Average
<$10M 23,370,759 11.4 7.8 7.9
$10-20M 51,913,734 15.7 8.1 8.2
Equal-Weighted Average All Funds 13.3 8.0 8.0
Dollar-Weighted Average All Funds 14.9 *9 sinking funds reported investment returns
Photo Contributed by Lorenzo Rosenzweig, FMCN Mexico
14
Sinking Fund Investment Performance
Sinking funds report investment returns in a range similar to that of the endowment funds. Sinking funds managing less than $10 million US dollars experienced returns averaging 11.4 percent, while the larger funds, managing $10-20 million reported higher returns, on average 15.7 percent.
Endowment Returns by Region
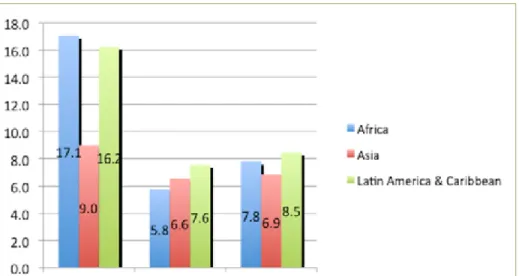
Figure 2 below shows the average investment returns for 2009 for the endowment funds in each of the three regions studied. In 2009, the African Funds posted the highest endowment returns of the three regions, at 17.1 percent, up from -10.7% in 2008. African Funds also posted positive longer-term returns, with 3-year average of 5.8%, and 7.8% for the five-year period. The average rate of return for Asian funds in 2009 was 9.0%, up from -0.5% in 2008. The 3-Year average return for these funds is 6.6% and the 5-Year average is 6.9%. In general Asian funds continue to demonstrate less volatility across the study years compared to the funds in other regions.
The Latin American and Caribbean (LAC) Funds had an average return of 16.2% for 2009, a large increase over the average return of -7.1% for 2008. These Funds posted three-year average gains of 7.6% and over a five-year time period the Funds reported average annual returns of 8.5%.
Table 2. Average Sinking Fund Returns by Fund Size, 2009
Figure 2. Endowment Returns by Region
Photo Contributed by Lorenzo Rosenzweig, FMCN Mexico
10
Overall Rates of Return
Many of the CTFs made changes to their investment strategies after experiencing losses in 2007 and 2008, and were able to take advantage of the recovery in 2009 to show gains. Conservation Trust Funds reporting endowment and sinking fund investment return information for fiscal year 2009 enjoyed average returns of 14.4%, an impressive turn from the 7 percent averages losses in 2008. The CTFs’ one‐, three‐ and five‐year average rates of return for the period between 2005‐2009 are shown in Tables 1 and 2 below. Five‐year returns for endowments and sinking funds are very similar. The average endowment return over five years was 7.9 percent, while the average for sinking fund return is 8.0 percent over the same five‐year period. The S&P 500 recorded a five‐year average return of approximately three percent (3%) for that same period. The CTFs all reported returns that outperformed the S&P 500 over the 5‐year period ending in 2009 as indicated in Table 1.
Endowment Investment Performance
The group of smaller CTFs (assets less than $10 million in US dollar equivalent) experienced the highest returns in 2009, at an average of 17.8 percent. The group of mid‐size CTFs (between 10 and 20 million US dollar equivalent) experienced gains of 13.0 percent. The larger endowments had more conservative returns in 2009, averaging 11.8 percent.
Table 1. Average Endowment Returns by Fund Size, 2009
Percent Average Annual Endowment Fund Returns by Fund Size
Size Category Total Assets (USD) 2009 3-Year Average 5-Year Average
<$10M 47,945,513 17.8 8.3 9.6
$10-20M 111,703,562 13.0 6.6 6.9
>$20M 284,107,958 11.8 4.4 6.1
Equal-Weighted Average All Funds 14.8 6.8 7.9
Dollar-Weighted Average All Funds 14.8
*26 endowment funds reported investment returns
Sinking Fund Investment Performance
Sinking funds report investment returns in a range similar to that of the endowment funds. Sinking funds managing less than $10 million US dollars experienced returns averaging 11.4 percent, while the larger funds, managing $10‐20 million reported higher returns, on average 15.7 percent.
Table 2. Average Sinking Fund Returns by Fund Size, 2009
Percent Average Annual Sinking Fund Returns by Fund Size
Size Category Total Assets (USD) 2009 3-Year Average 5-Year Average
<$10M 23,370,759 11.4 7.8 7.9
$10-20M 51,913,734 15.7 8.1 8.2
Equal-Weighted Average All Funds 13.3 8.0 8.0
Dollar-Weighted Average All Funds 14.9
*9 sinking funds reported investment returns
11
Endowment Returns by Region
Figure 2 below shows the average investment returns for 2009 for the endowment funds in each of the three regions studied. In 2009, the African Funds posted the highest endowment returns of the three regions, at 17.1 percent, up from ‐10.7% in 2008. African Funds also posted positive longer‐term returns, with 3‐year average of 5.8%, and 7.8% for the five‐year period. The average rate of return for Asian funds in 2009 was 9.0%, up from ‐0.5% in 2008. The 3‐Year average return for these funds is 6.6% and the 5‐Year average is 6.9%. In general Asian funds continue to demonstrate less volatility across the study years compared to the funds in other regions. The Latin American and Caribbean (LAC) Funds had an average return of 16.2% for 2009, a large increase over the average return of ‐7.1% for 2008. These Funds posted three‐year average gains of 7.6% and over a five‐year time period the Funds reported average annual returns of 8.5%.
Figure 2. Endowment Returns by Region
15
Table 3. Total Endowment Size and Average 2009 Returns
Africa
All nine African Funds participating in this study manage endowments. A sinking fund in Africa that previously participated in the survey did not return the survey due to management and institutional changes. African Funds reported a combined investment of approximately 95.6 million dollars1, with an average endowment size of $10.6 million. The largest fund in Africa manages approximately $21.4 million and the smallest manages $2.5 million.
Asia
Six funds in Asia provided investment return information for the survey this year, reporting a combined value of $86.8 million in endowments and an average size of $14.5 million. The largest fund manages approximately $37 million and the smallest fund has an endowment of $182,000.
Latin America and the Caribbean
The 11 Funds managing endowments in the Americas manage investments totaling approximately $276 million, with an average endowment size of $25.1 million. The largest CTF in the Americas manages approximately $106 million in endowment assets and the smallest reporting Fund manages a $2 million endowment.
Sinking Fund Returns by Region
Two CTFs in Asia and seven CTFs in the Americas manage sinking funds that reported investment returns this year. Five CTFs manage sinking funds separately from and in addition to endowment funds.
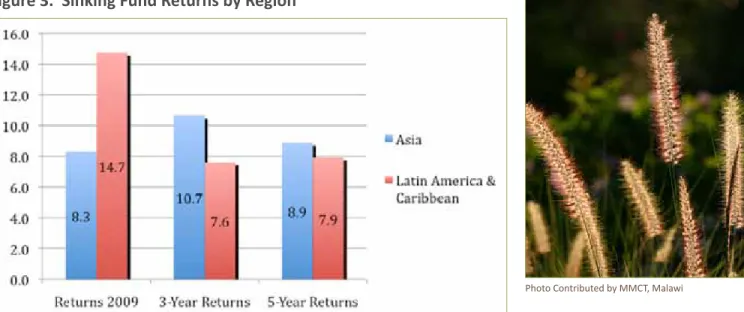
The two sinking funds in Asia total $6.4 million. The smallest is $45,000 and the largest is $6.4 million. These sinking funds report average investment returns of 8.3% for 2009. Three- and five-year returns for the Asian Funds managing sinking funds are 10.7% and 8.9%, respectively.
The seven Latin American and Caribbean CTFs that manage sinking funds have approximately $69 million in dollar equivalent assets, with the smallest sinking fund at $2.8 million and the largest at $16.7 million. These sinking fund investments returned an average of 14.7% in 2009. The three- and five-year returns for these funds were 7.6 and 7.9%.
1All fund sizes are reported in equivalent US dollar amounts.
Africa
All nine African Funds participating in this study manage endowments. A sinking fund in Africa that previously participated in the survey did not return the survey due to management and institutional changes. African Funds reported a combined investment of approximately 95.6 million dollars2, with an average endowment size of $10.6 million. The largest fund in Africa manages approximately $21.4 million and the smallest manages $2.5 million.Asia
Six funds in Asia provided investment return information for the survey this year, reporting a combined value of $86.8 million in endowments and an average size of $14.5 million. The largest fund manages approximately $37 million and the smallest fund has an endowment of $182,000.Latin America and the Caribbean
The 11 Funds managing endowments in the Americas manage investments totaling approximately $276 million, with an average endowment size of $25.1 million. The largest CTF in the Americas manages approximately $106 million in endowment assets and the smallest reporting Fund manages a $2 million endowment.
Table 3. Total Endowment Size and Average 2009 Returns
Percent Average Annual Endowment Fund Returns by Region
Region Total Assets (USD) 2009 3-Year Average 5-Year Average
Africa 80,824,784 17.1 5.8 7.8
Asia 86,778,160 9.0 6.6 6.9
Latin America & Caribbean 276,154,089 16.2 7.6 8.5
Equal-Weighted Average All Funds 14.8 6.8 7.9
Dollar-Weighted Average All Funds 14.8
*26 endowment funds reported investment returns
2
All fund sizes are reported in equivalent US dollar amounts.
Photo Contributed by MMCT, Malawi
16
Figure 3. Sinking Fund Returns by Region
Figure 4. Endowment and Sinking Fund Returns
The Conservation Trust Funds managing endowments and those managing sinking funds had similar returns in 2009. The smaller endowments showed higher returns than the similar sinking funds; however, the mid-size sinking funds reported higher returns than endowments in the same size category.
Table 4. Total Sinking Fund Size and Average 2009 Returns
13
Sinking Fund Returns by Region
Two CTFs in Asia and seven CTFs in the Americas manage sinking funds that reported investment returns this year. Five CTFs manage sinking funds separately from and in addition to endowment funds. Figure 3. Sinking Fund Returns by Region The two sinking funds in Asia total $6.4 million. The smallest is $45,000 and the largest is $6.4 million. These sinking funds report average investment returns of 8.3% for 2009. Three‐ and five‐year returns for the Asian Funds managing sinking funds are 10.7% and 8.9%, respectively. The seven Latin American and Caribbean CTFs that manage sinking funds have approximately $69 million in dollar equivalent assets, with the smallest sinking fund at $2.8 million and the largest at $16.7 million. These sinking fund investments returned an average of 13.3% in 2009. Both the three‐ and five‐year returns for these funds were 8.0%. Table 4. Total Sinking Fund Size and Average 2009 Returns
Percent Average Sinking Fund Returns by Region
Region Total Assets (USD) 2009 3-Year Average 5-Year Average
Asia 6,426,652 8.3 10.7 8.9
Latin America & Caribbean 68,857,841 14.7 7.6 7.9
Equal-Weighted Average All Funds 13.3 8.0 8.0
Dollar-Weighted Average All Funds 14.9
*9 sinking funds reported investment returns
13
Sinking Fund Returns by Region
Two CTFs in Asia and seven CTFs in the Americas manage sinking funds that reported investment returns this year. Five CTFs manage sinking funds separately from and in addition to endowment funds.
Figure 3. Sinking Fund Returns by Region
The two sinking funds in Asia total $6.4 million. The smallest is $45,000 and the largest is $6.4 million. These sinking funds report average investment returns of 8.3% for 2009. Three‐ and five‐year returns for the Asian Funds managing sinking funds are 10.7% and 8.9%, respectively. The seven Latin American and Caribbean CTFs that manage sinking funds have approximately $69 million in dollar equivalent assets, with the smallest sinking fund at $2.8 million and the largest at $16.7 million. These sinking fund investments returned an average of 13.3% in 2009. Both the three‐ and five‐year returns for these funds were 8.0%.
Table 4. Total Sinking Fund Size and Average 2009 Returns
Percent Average Sinking Fund Returns by Region
Region Total Assets (USD) 2009 3-Year Average 5-Year Average
Asia 6,426,652 8.3 10.7 8.9
Latin America & Caribbean 68,857,841 14.7 7.6 7.9
Equal-Weighted Average All Funds 13.3 8.0 8.0
Dollar-Weighted Average All Funds 14.9
*9 sinking funds reported investment returns
Comparison of Endowment and Sinking Fund Returns
The Conservation Trust Funds managing endowments and those managing sinking funds had similar returns in 2009. The smaller endowments showed higher returns than the similar sinking funds; however, the mid‐size sinking funds reported higher returns than endowments in the same size category.
Figure 4. Endowment and Sinking Fund Returns
Types of Benchmarks Used
A variety of benchmarks are used by the Funds to measure performance. The S&P 500 is the most commonly listed index across all of the Funds, though the Morgan Stanley Capital International (MSCI) World Index, the Barclays Capital US Aggregate Bond Index and the JP Morgan Stanley Bond Index are also listed as common benchmarks against which some of the Funds measure their portfolio performance. National indices are also used by many of the funds invested in domestic markets. The following table shows how the average returns for the endowment funds and the sinking funds surveyed for this report compared to the three most commonly referenced indices. The lower returns for the CTFs reflect their more conservative investment approach lower equity weights in their asset allocations. Table 5. CTF Returns Compared to Common Benchmark Indices 2009 Average Returns Compared to Common Indices CTF Endowment Funds 14.8% CTF Sinking Funds 13.3% Barclays Capital Aggregate Bond Index 5.9% S&P 500 26.5% MSCI EAFE 32.0% *Source: UBS Market Research *25 endowment funds and 9 sinking funds reported investment return information
Photo Contributed by MMCT, Malawi
Comparison of Endowment & Sinking Fund Returns
Photo Contributed by Lorenzo Rosenzweig, FMCN Mexico
Types of Benchmarks Used
A variety of benchmarks are used by the Funds to measure performance. The S&P 500 is the most commonly listed index across all of the Funds, though the Morgan Stanley Capital International (MSCI) World Index, the Barclays Capital US Aggregate Bond Index and the JP Morgan Stanley Bond Index are also listed as common benchmarks against which some of the Funds measure their portfolio performance. National indices are also used by many of the funds invested in domestic markets.
The following table shows how the average returns for the endowment funds and the sinking funds surveyed for this report compared to the three most commonly referenced indices. The lower returns for the CTFs reflect their more conservative investment approach as well as lower equity weights in their asset allocations.
Table 5. CTF Returns Compared to Common Benchmark Indices
Comparison of Endowment and Sinking Fund Returns
The Conservation Trust Funds managing endowments and those managing sinking funds had similar returns in 2009. The smaller endowments showed higher returns than the similar sinking funds; however, the mid‐size sinking funds reported higher returns than endowments in the same size category.
Figure 4. Endowment and Sinking Fund Returns
Types of Benchmarks Used
A variety of benchmarks are used by the Funds to measure performance. The S&P 500 is the most commonly listed index across all of the Funds, though the Morgan Stanley Capital International (MSCI) World Index, the Barclays Capital US Aggregate Bond Index and the JP Morgan Stanley Bond Index are also listed as common benchmarks against which some of the Funds measure their portfolio performance. National indices are also used by many of the funds invested in domestic markets. The following table shows how the average returns for the endowment funds and the sinking funds surveyed for this report compared to the three most commonly referenced indices. The lower returns for the CTFs reflect their more conservative investment approach lower equity weights in their asset allocations.
Table 5. CTF Returns Compared to Common Benchmark Indices
2009 Average Returns Compared to Common Indices CTF Endowment Funds 14.8% CTF Sinking Funds 13.3% Barclays Capital Aggregate Bond Index 5.9% S&P 500 26.5% MSCI EAFE 32.0% *Source: UBS Market Research *25 endowment funds and 9 sinking funds reported investment return information
Currency and Inflation Adjusted Returns
A number of CTF portfolios include investments in US and international equities and other instruments, while some focus almost entirely on domestic investments. Investing in global markets can potentially improve the risk-adjusted performance of a portfolio, however exposure to foreign currency carries a certain risk as exchange rates fluctuate. Returns are also affected by the domestic rate of inflation, which if positive and significant, can decrease the purchasing power of money available for project financing. Fund managers need to be aware of the effects of exchange rates and domestic inflation on the ability of their Funds to deliver the desired conservation outcomes.
The table below shows reported investment returns for Funds with global portfolios adjusted for changes in exchange and inflation rates. Returns in dollar, euro, and local currency equivalents, along with the 2009 domestic rate of inflation are provided, along with the currency used in reporting. For example, where the table indicates the reporting currency as domestic, the local currency return represents the reported nominal return, and euro and dollar equivalent returns are calculated based on that currency’s appreciation or depreciation against those currencies. If reported in dollars, the dollar return forms the basis for calculating the equivalencies in euros and local currency. For purposes of illustration, the last column presents the real rate of return in domestic currency. In the US and Eurozone, inflation rates were -0.3% and 0.7% respectively and thus there is relatively little difference between the
Photo Contributed by MMCT, Malawi
Photo Contributed by Lorenzo Rosenzweig, FMCN Mexico
18
Table 6. Currency and Inflation Adjusted Returns
16 Table 6. Currency and Inflation Adjusted Returns Fund ID No Reporting Currency Dollar Return Euro Return Local Currency Return Domestic Inflation Rate Real Return Local Currency Endowment Funds 15 Domestic 33.33% 30.82% 11.00% 7.10% 3.90% 5 Domestic 35.46% 32.95% 13.13% 7.10% 6.03% 3 US$ 9.75% 7.24% 9.75% 0.30% 9.45% 11 US$ 24.50% 21.99% 26.17% 12.10% 14.07% 2 Domestic 12.40% 9.89% 7.73% 10.90% -3.17% 6 US$ 15.00% 12.49% 5.89% 4.20% 1.69% 8 US$ 24.96% 22.45% 28.80% 8.40% 20.40% 9 US$ 26.45% 23.94% 24.14% 13.10% 11.04% 14 US$ 27.11% 24.60% 28.54% 3.30% 25.24% 7 US$ 16.90% 14.39% 28.82% 9.60% 19.22% 31 US$ 19.13% 16.62% 19.13% 2.72% 16.41% 24 US$ 11.90% 9.39% 17.25% 9.00% 8.25% 22 Domestic 39.18% 36.67% 16.85% 7.10% 9.75% 23 US$ 6.35% 3.84% -9.08% 4.80% -13.88% 25 US$ 8.66% 6.15% 5.80% 3.30% 2.50% 20 US$ 17.72% 15.21% 17.77% 1.10% 16.67% 10 Domestic 13.88% 11.37% 10.90% 2.20% 8.70% 26 US$ 18.50% 15.99% 10.64% 2.90% 7.74% 18 US$ 9.85% 7.34% -14.78% 4.20% -18.98% 29 US$ 10.40% 7.89% 5.73% 8.00% -2.27% 28 US$ 16.85% 14.34% 7.74% 4.20% 3.54% 21 US$ 7.75% 5.24% 13.10% 9.00% 4.10% 27 US$ 16.71% 14.20% 16.71% 2.40% 14.31% 17 US$ 8.04% 5.53% 8.04% 4.31% 3.73% 30 US$ 22.19% 19.68% 17.93% 3.60% 14.33% Sinking Funds 13 Domestic 4.50% 1.99% 16.42% 9.60% 6.82% 12 US$ 11.26% 8.75% 11.77% 5.40% 6.37% 16 US$ 21.12% 18.61% 22.55% 3.30% 19.25% 2 Domestic 10.01% 7.50% 5.34% 10.90% -5.56% 4 Domestic 7.35% 4.84% 3.00% 1.90% 1.10% 19 US$ 21.50% 18.99% 13.64% 2.90% 10.74% 26 US$ 24.80% 22.29% 16.94% 2.90% 14.04% 1 US$ 6.68% 4.17% 6.63% 0.60% 6.03% 28 Domestic 18.82% 16.31% 9.71% 4.20% 5.51% *25 endowment funds and 9 sinking funds reported investment return information Note: The US inflation rate in 2009 was ‐0.3% while inflation in the Eurozone was 0.7%
Asset Allocation
Asset allocation information was submitted for 18 endowment funds and for 12 sinking funds. Allocations were recorded among the four categories: equities, fixed income, cash and alternative strategies, and are shown below, averaged by Fund size in Tables 7 and 8.
2009 Endowment Asset Allocation
Table 7, below, shows the average asset allocation for the endowment funds in 2009.
Table 7. Endowment Funds Asset Allocation
17
Asset Allocation
Asset allocation information was submitted for 18 endowment funds and for 12 sinking funds. Allocations were recorded among the four categories: equities, fixed income, cash and alternative strategies, and are shown below, averaged by Fund size in Tables 7 through 9.
Asset Allocation Comparison from 2008 to 2009
Table 7, below, shows the rebalancing of the funds (both endowment and sinking funds combined) from 2008 to 2009. The larger Funds, both in the over $20 Million category and the $10‐20 Million category show increased allocations in both equities and fixed income, with less cash investments than in 2008. The smaller funds, managing less than $10 million show reduced fixed income allocations, with increased allocations in equities, cash and alternative instruments. These Funds showed the highest overall returns of the fund categories.
Table 7. Endowment and Sinking Fund Asset Allocation Comparison 2008 to 2009
Asset Allocation Comparison 2008 to 2009
Size Category 2009 Returns 2008 Equity 2009 Equity 2008 Fixed 2009 Fixed 2008 Cash 2009 Cash 2008 Alt. 2009 Alt. Funds >20 Million 10.3% 19.5% 25.0% 45.8% 58.7% 43.3% 11.2% 0.5% 5.1% Funds 10-20 Million 14.0% 27.7% 33.8% 26.0% 50.9% 45.0% 14.4% 1.3% 0.9% Funds <10 Million 15.8% 28.9% 31.3% 56.4% 37.9% 12.0% 21.6% 2.7% 9.2%
*18 endowment funds and 12 sinking funds reported asset allocation information
2009 Endowment Asset Allocation
Table 8, below, shows the average asset allocation for the endowment funds in 2009.
Table 8. Endowment Funds Asset Allocation
Endowment Asset Allocation 2009
Size Category Equity Fixed Income Cash Other >20 Million 25.0% 58.7% 11.2% 5.1% 10-20 Million 30.7% 47.3% 21.3% 0.7% <10 Million 42.7% 34.5% 16.7% 6.1%
*Asset allocation information is reported for 18 endowment funds
2009 Sinking Fund Asset Allocation
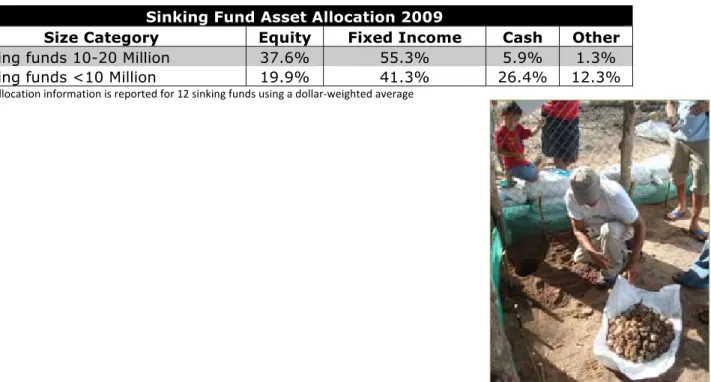
The asset allocations for the sinking funds participating in this study are shown below in Table 9. While the average asset allocations appear similar to those of the endowment funds, the majority of the twelve sinking funds are invested substantially in domestic fixed income and cash. However, a number of the sinking funds have invested between upwards of 20% of their assets in domestic equities, an unusual portfolio for sinking funds that are generally conservatively balanced.
Table 9. Sinking Funds Asset Allocation
Sinking Fund Asset Allocation 2009
Size Category Equity Fixed Income Cash Other Sinking funds 10-20 Million 37.6% 55.3% 5.9% 1.3% Sinking funds <10 Million 19.9% 41.3% 26.4% 12.3%
*Asset allocation information is reported for 12 sinking funds using a dollar‐weighted average
Photo Contributed by IAES, El Salvador
2009 Sinking Fund Asset Allocation
The asset allocations for the sinking funds participating in this study are shown below in Table 8. The larger sinking funds had similar portfolios to the endowments in the same size range for 2009, with the majority of assets in fixed income instruments and equities. The smaller sinking funds were also heavily weighted toward fixed income. However, the smaller sinking funds had greater allocations to cash instruments than to equities.
Table 8. Sinking Funds Asset Allocation
17
Asset Allocation
Asset allocation information was submitted for 18 endowment funds and for 12 sinking funds. Allocations were recorded among the four categories: equities, fixed income, cash and alternative strategies, and are shown below, averaged by Fund size in Tables 7 through 9.
Asset Allocation Comparison from 2008 to 2009
Table 7, below, shows the rebalancing of the funds (both endowment and sinking funds combined) from 2008 to 2009. The larger Funds, both in the over $20 Million category and the $10‐20 Million category show increased allocations in both equities and fixed income, with less cash investments than in 2008. The smaller funds, managing less than $10 million show reduced fixed income allocations, with increased allocations in equities, cash and alternative instruments. These Funds showed the highest overall returns of the fund categories.
Table 7. Endowment and Sinking Fund Asset Allocation Comparison 2008 to 2009
Asset Allocation Comparison 2008 to 2009
Size Category 2009 Returns 2008 Equity 2009 Equity 2008 Fixed 2009 Fixed 2008 Cash 2009 Cash 2008 Alt. 2009 Alt. Funds >20 Million 10.3% 19.5% 25.0% 45.8% 58.7% 43.3% 11.2% 0.5% 5.1% Funds 10-20 Million 14.0% 27.7% 33.8% 26.0% 50.9% 45.0% 14.4% 1.3% 0.9% Funds <10 Million 15.8% 28.9% 31.3% 56.4% 37.9% 12.0% 21.6% 2.7% 9.2%
*18 endowment funds and 12 sinking funds reported asset allocation information
2009 Endowment Asset Allocation
Table 8, below, shows the average asset allocation for the endowment funds in 2009.
Table 8. Endowment Funds Asset Allocation
Endowment Asset Allocation 2009
Size Category Equity Fixed Income Cash Other >20 Million 25.0% 58.7% 11.2% 5.1% 10-20 Million 30.7% 47.3% 21.3% 0.7% <10 Million 42.7% 34.5% 16.7% 6.1%
*Asset allocation information is reported for 18 endowment funds
2009 Sinking Fund Asset Allocation
The asset allocations for the sinking funds participating in this study are shown below in Table 9. While the average asset allocations appear similar to those of the endowment funds, the majority of the twelve sinking funds are invested substantially in domestic fixed income and cash. However, a number of the sinking funds have invested between upwards of 20% of their assets in domestic equities, an unusual portfolio for sinking funds that are generally conservatively balanced.
Table 9. Sinking Funds Asset Allocation
Sinking Fund Asset Allocation 2009
Size Category Equity Fixed Income Cash Other Sinking funds 10-20 Million 37.6% 55.3% 5.9% 1.3% Sinking funds <10 Million 19.9% 41.3% 26.4% 12.3%
*Asset allocation information is reported for 12 sinking funds using a dollar‐weighted average
Photo Contributed by Lorenzo Rosenzweig, FMCN Mexico