Black-White Differences in the Insurance Value of
Human Capital
Alexander Whalley
∗June 2004
Preliminary Draft, Comments Welcome
Abstract
This paper studies the implications of Black-White differences in uninsurable labor market risk for Black-White differences in the value of human capital. Unin-surable labor income risk implies that the internal rate of return is an insufficient statistic for the value of education for risk-averse individuals. A simple asset pricing approach is applied to labor income streams to estimate the value of human capital explicitly accounting for the individual’s preferences for risk and uninsurable labor income risk. It is shown that high school graduation significantly reduces the degree of transitory earnings risk for blacks, but not for whites. A simple calculation shows that the risk-adjusted rate of return to high school graduation is more one and a half times the internal rate of return for blacks. Blacks who really dislike risk select into higher levels of education, showing that the insurance benefit of education for blacks influences the behavior of those who value insurance most.
∗3105 Tydings Hall, Department of Economics, University of Maryland, College Park, MD 20742.
Email: [email protected]. Web: www.wam.umd.edu/∼whalley. I am extremely grateful to Jeff Smith for encouragement and many valuable comments. I also wish to thank Judy Hellerstein, and John Shea for many helpful discussions. Shawn Bushway, Mark Duggan, Jonah Gelbach, Ginger Jin, Seth Sanders, Sarah Bohn, Juan-Jose Diaz, BeomSoo Kim, Ignez Tristao and workshop participants at the University of Maryland also offered helpful comments on this paper. All errors are my own.
1
Introduction
This paper applies modern consumption based asset pricing theory to value human capi-tal in the presence of significant labor market risk, and tests for racial differences in this value. The theory underlying human capital investment has not kept pace with recent developments in the value of risky assets1. This seems strange since human capital is one the most valuable assets that most people ever hold, and it is subject to substantial unin-surable risk. Human capital theory is based on the comparison of the few period cost of acquiring human capital to the present discounted value of the resulting increasing stream. The human capital model which underlies typical Mincerian human capital regressions is based on a model where individuals only value the gain from education through the effect of education on permanent income, because all labor income risk is insurable. This paper will estimate the earnings insurance benefit of education for blacks and whites. It will also test whether any insurance benefit influences education attainment outcomes.
The value of human capital could differ by race due to uninsurable labor market risk. There are two important sources of black-white differences in utilization risk. Blacks face a far higher probability of being incarcerated and blacks are more likely to be unemployed longer upon displacement than whites. If human capital is not utilized, then the additional productivity that an individual gains from education has no value. If the utilization of human capital follows a stochastic process then the value of human capital will depend on that process. In a world where different individuals face different stochastic processes of earnings (as recent work by Meghir and Pistaferri (2004) has found) and labor market risk is not insurable, the value of human capital is not captured by differences in mean earnings (the internal rate of return). The probability of incarceration and the length of unemployment spell are reduced more for from education for blacks than for whites (see Lochner and Moretti (2003) and Fairlie and Kletzer (1998)). It is these differences in the effect of education on utilization risk (reducing the probability, or length of, of
1There are a number of recent papers that make this point. See Palacios-Huerta (2003) Carneiro,
Hansen, and Heckman (2003), and Heckman, Lochner and Todd (2003) for recent empirical contributions, and Pries (2001) and Krebs (2003) for recent theoretical contributions.
non-employment) that make human capital a more valuable asset for blacks than for whites.
This paper makes both a substantive and methodological contribution to the lit-erature. On a substantive level, I find that high school graduation is a more valuable asset for blacks than for whites. The source of this difference is the fact that high school graduation lowers the transitory standard deviation of the earnings process for blacks but not for whites. This difference is shown to imply that risk adjusted rates of return to high school graduation are over 150 percent larger for blacks than for whites, even if unadjusted rates of return are the same. A new result is presented that risk preferences are important determinants of high school graduation. Furthermore, the relationship be-tween risk and schooling is different for blacks and whites, but the relationship between family background and schooling is not. These results show that educational choice as a mechanism used by blacks to reduce the risk from transitory earnings shocks. This result questions the exclusive focus of previous literature on increases in permanent income from education as a central benefit of increasing educational attainment.
Another new substantivefinding of this paper is that preferences for risk are related to the estimated transitory volatility of both earnings and wages. This suggests that individuals are making labor market decisions based on how much they dislike transitory labor risk. Some jobs may be more or less risky, and individuals are choosing which income stream to accept based on their preferences for risk. The results for whites in-dicate that those who dislike risk the least experience the most transitory fluctuations in earnings. This would not happen in a world where differences in permanent income levels are the central determinants of optimal educational attainment choices. Transitory earnings insurance would have no value in a world the permanent income hypothesis holds since all transitoryfluctuations in labor market income would not result in consumption fluctuations.
The methodological contribution of this paper is a new method to value human capital in the presence of heterogeneous labor market risk and preferences for risk. Using
data from the Panel Study of Income Dynamics (PSID), I apply a parsimonious asset pricing kernel to estimate the risk-adjusted value of human capital. The method is to estimate the Sharpe ratio (risk adjusted excess rate of return) to high school graduation separately by race explicitly accounting for heterogeneous preferences for risk and selection on unobserved ability. Measures of the risk preferences are used to address thefirst source of heterogeneity. The second source of heterogeneity is addressed using an instrumental variables estimator, where the excluded instruments are compulsory schooling laws. No method has been previously utilized in the literature in a way that accounts for both sources of heterogeneity.
The outline of the paper is as follows. Section 2 will outline previous work, outline our data and present some new results on the role of preferences for risk in the determi-nation of educational outcomes. In Section 3, I will present the theory and econometric implementation of the two strands of the method employed to value human capital. In Section 4 the results of the analysis will be presented, and Section 5 concludes and presents an agenda for further research.
2
Previous Literature
The current literature on racial differences in educational attainment (see Neal and John-son (1996), Cameron and Heckman (2001) and Fryer and Levitt (2003)) emphasizes the role of long-term factors in determining this gap. It is argued that family background and income greatly influence the likelihood of college attendance because students from disadvantaged backgrounds obtain less human capital early in their academic careers (as measured by their test scores before they reach college age). This lower level of human capital then impacts their ability to complete high school and college successfully. How-ever, this research has not fully explained why this racial difference in early life human capital occurs. Another recent contribution (Carneiro, Heckman and Maertov (2003)) has addressed the question of whether blacks look forward and, anticipating labor market discrimination, optimally choose to invest less in human capital early in their academic
careers. The majority of the evidence presented does not support this hypothesis.
There are significant black-white differences in the likelihood of being able to fully employ an individual’s marginal product in the labor market at a given time. Two sources that are largely responsible for this difference are black-white differences in incarceration rates and in reemployment probabilities conditional on displacement. It has been shown that increases in educational attainment lower these probabilities more for blacks than for whites (see Lochner and Moretti (2003) and Fairlie and Kletzer (1998)). Other recent work by Antcetol and Bedard (2002) has indicated that education reduces time spent non-employed for blacks more than for whites. This suggests that the standard deviation in the earnings process due to these exogenous shocks would be reduced more for blacks than for whites from high school graduation. Recent work by Meghir and Pistaferri (2004) has shown that there are important unobserved differences across individuals in the variance of both the transitory and permanent labor market shocks they experience. Meghir and Pistaferri do not attempt to assess how time-invariant characteristics of different individ-uals are related to these differences. Both of these recent strands of work suggest that blacks and whites may well experience different standard deviations in the shock process of earnings and that the effect of education on this distribution could vary by race.
Could racial differences in labor market risk offer an explanation for racial differences in educational attainment? Recent work has claimed that human capital is a more risky asset for blacks than whites (see Palacios-Huerta (2003)) and other recent work (Buchin-sky and Leslie (2001)) has shown that the conditional distribution of rates of return to education is wider for blacks than for whites (suggesting that education is a more risky asset for blacks than whites). The research by Palacios-Huerta shows that in terms of the return per unit risk (or the Sharpe ratio), the value of human capital is greater for whites than blacks for most levels of education. This suggests that differences in the riskiness of education could offer an explanation for the racial differences in educational attainment noted by many researchers. Additional risk faced by blacks lowers the risk-adjusted re-turns to education of blacks relative to whites, even though they face the same unadjusted mean return. Thus, this additional risk could explain why blacks accumulate less human
capital than whites.
However, there are three important concerns with Palacios-Huerta’s definition of risk and with the representative agent model he uses. Because cross-sectional variance is used as a measure of risk, it is not clear that this variance reflects the uncertainty that individual’s actually face when they make educational investment decisions. His estimates of the risk-adjusted rate of return to a year of schooling are based on ordinary least squares estimates of the internal rate of return and the volatility of that rate of return. The mean return are likely to be biased upwards due to the omitted variable bias problem in estimating the mean internal rate of return identified by many researchers. For the estimation of risk-adjusted rates of return the volatility of these returns will also be biased due to omitted variable bias. In this case additional spurious volatility will be generated by the omitted variable bias. This arises because the omitted variable bias problem will bias the estimates of the internal rate of return by different amounts for different samples and different time periods. Palacios-Huerta uses the Current Population Survey, which is a representative national (on observable dimensions) repeated cross-section sample. So if individuals with higher or lower internal rates of return to years of schooling are over or undersampled in different years this will generate variation in the internal rate of return purely from sampling variation. Thus, his estimates of the Sharpe Ratio will be biased in an unknown because both the numerator and the denominator of this ratio will be upward biased and we cannot know which term is biased more.
Another salient concern for the estimation of racial differences in the Sharpe Ratio arises from the work of Cameron and Heckman (2001). They find that dynamics of the selection bias are different for blacks and whites and that accounting for this time-varying selection process is important in understanding racial differences in attainment. This finding implies that racial differences in the volatility of internal rates of return estimated without accounting for the time varying selection process will be biased, and the degree of bias will vary by race. This is a clear concern in an attempt to estimate racial differences in the risk-adjusted rate of return in this fashion. It is also important to note that the use of only workers employed full-time in the CPS data as in both the analysis in
Palacios-Huerta and, Buchinsky and Leslie would not capture any racial differences in utilization risk due to non-employment. This is likely to be a major concern if differences in utilization risk are the principle source of black-white differences in labor market risk, as I argue here.
Palacious-Huerta employs a representative agent framework to underlie his esti-mates. This is a concern in a world where individuals face different degrees of risk in the labor market (as Meghir and Pistaferri (2004) find) have different preferences for risk, and there are important frictions in the labor market. It is clear than an individual who is very risk averse is unlikely to accept a job with a very risky income stream unless he is compensated for taking on that risk. The individual making choices about which job to accept and at which wage has far more information available about the riskiness of a job than is available to the econometrician. For example, an individual when accepting a job will know whether the job is paid on an annual fixed salary basis or solely on commis-sion. They would have much more information on the probability of displacement than an econometrician. Thus I expect that (in a world without full compensating differentials and incomplete insurance markets) that those who dislike risk a great deal will select into jobs with steadier incomes streams. This means that observed volatility in income streams would be correlated with unobserved preferences for risk. So an estimate of the variance associated a particular labor market choice, in this case education, that does not take into account the fact that the individuals who select into that labor market choice have different preferences for risk than the average person will be biased.
3
Data Sources and Basic Statistics
This study is conducted using the Panel Study of Income Dynamics (PSID). Numerous other researchers have used this data set for similar studies of labor market dynamics. The sample offifteen years I use contains annual observations on a panel offive thousand individuals from 1977 until 1992. A large number of black individuals are in this data set because it has a poverty oversample (the Survey of Economic Opportunity (SEO)
sub-sample). This sub-sample has two thousand observations and a large fraction of black respondents. A concern here is that using the SEO sub-sample, where many of the black individuals will come from, will mean that any racial differences will be confounded by sampling differences. I use the PSID sampling weights for all statistics calculated across individuals to address this issue. All the crucial variables needed for this study are contained in this data set: race, education, annual labor income, annual social insurance (unemployment insurance and workers compensation) income, average wage, annual hours worked, household demographics, industry and sector of employment (in addition to other variables), as well as some measures of observed labor market shocks, are all included.
In addition, lottery-based measures of risk preferences were surveyed for individuals in the PSID in 1996. Because of the panel structure of the dataset, I can link these measures to our sample from earlier years. These types of measures were first used in the Health and Retirement Study and first analyzed in Barsky et al. (1997). Similar measures have been found to be correlated with stock holding (Vissing-Jorgensen (2001)), wealth accumulation (Charles and Hurst (2003)) and savings (Mazzocco (2003)). These questions ask respondents about their preferences on five gambles about lifetime labor income. These values determine the degree of risk tolerance (which is the inverse of the degree of relative risk aversion) for that individual. An example of a question asked of a respondent would be whether or not they would reject a lottery which doubles their job income with a 50 percent probability or sets that job income to zero with a 50
The sample exclusion rules I impose are the following. I only include household heads, since many of the variables I require are only measured for these individuals. I drop female household heads as I do not want to address gender differences in labor supply behavior. The reason I only consider two educational categories (high school dropout and high school graduate or more) is due to the fact that there are very few black college graduates. I drop those who are not between 22 and 65 years of age in every year of the sample and drop any observations where the respondent reports they were retired or a student. For most people leaving the labor force to attend an educational institution or to retire are not unexpected shocks. Those who change reported race are dropped from the
sample, since I want to avoid measurement error in terms of racial categories. I also drop those who are not in the dataset for at least nine consecutive years. Lastly, I drop those who have annual labor earnings in any year of less than twenty percent of the average earnings over the sample period. This restriction was imposed by Caroll and Samwick (1997) (whose methodology I follow) to reduce the confounding effect of measurement error in earnings in the estimation of the variance of transitory shocks from labor market earnings data.
I now turn to examine some of the basic statistics and new facts that underlie this paper. In Table 1 some basic summary statistics are presented from the PSID data esti-mation sample for the 1977 cross-section. Shown are the means and standard deviations of the log earnings, log wages and hours. As expected we can see that high school grad-uates earn more, are paid a higher hourly wage, and work more hours than high school dropouts. These results are not the focus of this study. The focus of this paper instead lies in the standard deviations of these variables. We can see in this table that the stan-dard deviation of both log annual earnings and social insurance income, and log wages are roughly the same for white high school graduates and high school drop outs. However, this is not true for black individuals. Black high school graduates have both lower standard deviations of log annual earnings and social insurance income and log wage than black high school dropouts. This suggests that black high school graduates face less uncertainty about their labor market and social insurance income than black high school dropouts, but the uncertainty about these variables that white individuals face is not related to their educational attainment. Uncertainty about hours worked falls with education for both groups, and there does not seem to be any racial difference here. The goal of this paper is to more rigorously investigate this relationship, and draw implications about the value of this uncertainty reduction for the value of human capital.
4
Labor Market Risk and the Value of Human
Cap-ital
The central component of the analysis seeks to adjust internal rates of return to human capital by the amount of labor market risk faced. I compute Sharpe Ratios for human capital separately by race in order to analyze the return that a black or white individual can realize by completing high school per unit of high school dropout risk. This method improves on previous work by explicitly incorporating heterogeneous preferences for risk and addresses the confounding effects of selection into education based on unobserved ability.
The central parameter I seek to estimate in this analysis is the Sharpe Ratio2for human capital for race j (SRj). The portfolio decision problem the agent faces here is whether or not to complete high school. The benefit of this investment is that it will alter the stochastic process of earnings that the individual faces, which will change mean expected earnings and perhaps the standard deviation of the earnings process. The cost to the individual is that they could have supplied labor for this time and invested their earnings at the risk free rateRf. I express the Sharpe Ratio for individual of racej as,
SRj = E(R
j)
−Rf
σ(Rj) . (1)
The estimation of a Sharpe Ratio (risk-adjusted rate of return) for an asset does not depend on the absence of liquidity constraints or seperability of utility. It does impose a significant, and potentially restrictive, functional form on the way the individual values mean returns to human capital, and the volatility of those returns. I assume throughout this section that the internal rate of return to human capital is equal for blacks and whites. Earlier estimates in Neal and Johnson (1996) have shown this to be the case once differences in the difference in skills the blacks and whites bring to the labor market is taken into account. Hellerstein, Neumark and Troske (1999)find that
2The Sharpe Ratio is based on a well posed optimization problem and is not derived here for the sake
differences in marginal products are responsible for wage differences across different races, again implying that internal rate of return to education should be the same for blacks and whites.
The task in estimating this parameter then, SRj, is to estimate σ(Rj) for race j. Individuals of both races face the same risk free rate. The change in the standard deviation of the earnings process that accompanies the change in educational attainment is different by race, and is what I seek to estimate. Because I am taking other estimates of the unadjusted excess rate of return, E(Rj) and assuming the risk free rate Rf is 4 percent, the only term in (1) to be estimated is σ(Rj). The methods employed to
consistently estimate this parameter are outlined below.
4.1
Estimating The Risk Adjusted Rate of Return to Human
Capital
In this section I describe how I estimate σ(Rj) which is the effect of education on the
volatility of the earnings process for an individual of racej. To do this I follow the method utilized in Carroll and Samwick (1997) to estimate the different amount of earnings un-certainty faced by different individuals. Their methodology allows me to decompose the variance of shocks to log earnings into transitory and permanent components for each individual in the sample. I construct standard deviations from these variances so that I am able to map my estimates to the formula in equation (1). I can then examine how these standard deviations differ by race and educational level. Because these estimates are the standard deviation of shocks to log income, they are equivalent to shocks to the rate of return to supplying labor and can be used with unadjusted rates of return to human capital to derive Sharpe Ratios for high school completion.
I begin by describing the stochastic earnings process. The logarithm of permanent income for individual i at time t, yPit is assumed to follow a random walk with drift so
that,
Predictable income growth is denoted bygt, which is income growth related to the lifecycle and aggregate productivity growth, andηit is the shock to permanent income in periodt. In the empirical implementation I use age, education, industry, occupation, demographic characteristics and the interactions of all variables with age, as well as a time trend for
gt. The log of current incomeyitC is given by the log of permanent income and an additive
transitory error termεit,
yCit =yitP +εit. (3)
A crucial assumption here is that the errors εit and ηit are uncorrelated with each other at all leads and lags. This is what allows us to decompose the variance into transitory and permanent components3. To complete this decomposition I remove the predicted component of income growthgt and rewrite (2) as,
yitP =y
P
it−1+ηit. (4)
Define the d-year income difference as,
∆id =yitC+d−y C it
=yitP+d+εit+d−yPit −εit. (5)
The second equality comes from substituting (3) into the first equality. Substituting (4) into (5) recursively yields,
∆id= [ηit+1+ηit+2+ηit+3+...+ηit+d] +εit+d−εit. (6)
Taking the second moment of the right hand side of equation (6) I obtain
var(∆di) =dση2i+ 2σ
2
εi. (7)
Whereσ2
ηi andσε2i are the variances of the permanent and transitory shocks to log income
for individuali, respectively.
3This method as it is applied here does not explicitly allow for autocorrelation in the transitory errors
of in current earnings. A number of researchers have found this autocorrelation to follow a second order moving average process, however Carroll and Samwich show that this method is robust this type of autocorrelation because yearfixed effects are used in the explained component of earnings growth
I can identify σ2
ηi and σε2i in equation (7) for any value of d. For example, if d is
two then the equation (7) is easily solved with an estimate ofvar(∆di) at hand. I again
follow Carroll and Samwick (1997) in this decomposition. I estimate fourteen var(∆di)’s
for each i (with d taking on values 1 to 14 since I have fourteen differences) and using ordinary least squares for each i regress these measures ond and a vector of 14 2’s. The coefficients on these regressors are the estimates of σˆ2
ηi and σˆε2i respectively. I then have
the permanent and transitory variances in the labor income process for eachi. To get the standard deviations of the permanent and transitory shocks I take the square root of the estimated variances.
To compare how observable differences across individuals affect these standard de-viations I look at the how the cross-sectional characteristics in 1977 (the first year) are related to these estimates. First I look at the differences in the means of these estimated standard deviations by race, education, risk preference, and education within race. Then I regress the estimated standard deviations on individual characteristics separately by race, using both ordinary least squares and two stage least squares.
More formally, I estimate the equation ˆ
σi =β1highschoolgraduatei+XiΛ+ui. (8)
for each of the dependent variables σˆηi and σˆεi and for each race. The estimate of β1 is the conditional effect of education on the standard deviation of either the transitory or permanent component of the earnings process. This is the central estimate of interest needed to form the Sharpe Ratio. The matrix Xi contains the other covariates in the regression such as age, risk preference, demographic characteristics, occupation, industry and region, and the matrix Λ contains the estimated coefficients on these covariates. We estimate this equation by both OLS and TSLS as we are concerned that the omitted variable (ability) could be correlated with education, and this would bias the all the estimates in the equation, including the estimate of interest, β1.
The results of the estimation of the coefficients on high school graduation (β1) for the regression ofσˆηi andσˆεi are estimates of the change in the standard deviation that an
individual of a given race experiences by increasing their education. I can then implement the Sharpe Ratio formula (1) by using statistically significant coefficients on high school graduation in the following manner. First I standardize the standard deviation of the shocks to the log of annual income to one for high school dropouts of the same race, so that the coefficient estimate is a measure of the conditional change in σˆηi or σˆεi from an
increase in education. I then can express the Sharpe Ratio for high school graduation for individual of racej as,
E(Rj) −Rf σεnohs−β j 1 σεnohs ,
where β1j is our estimate of the effect of education on the standard deviation of the shock to annual income for an individual of race j.
A well-known issue in estimating the mean return to education is that of selection bias. This occurs because those who are of higher ability optimally choose to acquire more education, so that the internal rate of return estimated in a typical human capital regression estimated by ordinary least squares is biased upwards (see Heckman, Lalonde, Smith (1999) and Card (2001)). This is likely to be a concern in the context of the estimation of the effect of education on earnings volatility also. In the PSID there is no measure of ability and thus a selection on observables approach is not plausible since we lack a key observable which determines the selection process. I instead utilize an instrumental variables two stage least squares procedure to estimate the casual impact of education on the volatility of the earnings process. The excluded instruments I use are the same as Lochner and Moretti (2003), the compulsory schooling laws in the state of birth in place when the individual is age 14. These laws generate plausibly exogenous variation in educational attainment, and allow me to estimate a local average treatment effect (LATE) for the effect of high school graduation on the volatility of the earnings process. In general, the local average treatment effect is not equal to the population average treatment effect. This would only be true under some strong assumptions on the nature of the selection and decision process which agents face when making decisions about how much education
to invest in. The LATE parameter is also a local estimate; only valid in the neighborhood of the average educational attainment for those who change educational attainment as a result of the compulsory schooling law changes. See Heckman, Smith, and Clements (1997) for results that show of the importance of heterogeneous impacts in a well-known social experiment.
This section has described the methodology used here to estimate the risk adjusted rate of return (Sharpe Ratio) for high school graduation separately for each race. Wefirst begin by estimating the impact of education on the permanent and transitory standard deviations of earnings for blacks and whites separately. Next those estimates are used in the Sharpe Ratio formula as described above to estimate the risk adjusted rate of return to high school graduation separately for blacks and whites.
5
Results
This section will discuss the results of the analysis. I discuss the results of estimating the effect of high school graduation on income uncertainty, how this varies by race, and what these estimates imply for risk adjusted rates of return to high school completion. I also attempt to identify the source of the difference between races in the impact of education on annual earnings. Finally, I examine how preferences for risk determine educational attainment choices differently for whites and blacks.
5.1
Education and Earnings Volatility
This section discusses the results for the impact of high school graduation on the volatility of the earnings separately for blacks and whites. To begin the empirical implementation I first estimate the standard deviations of the transitory and permanent shocks to earnings as described above. The method of analysis follows two steps. The first step is to take
out the predictable component of earnings 4and decompose the resulting variance of the earnings process into the transitory and permanent components. This results in an esti-mate of the standard deviation of the permanent and transitory components of the shock process for each individual in the sample. The second step of the analysis examines how these estimated standard deviations differ by education, race and preferences for risk. I begin by examining the mean of these standard deviations by racial, education, and risk preference subgroups. I then estimate cross-sectional regressions for the impact of educa-tion on these variances, both by Ordinary Least Squares and Instrumental Variables. The estimates from these regressions provide the crucial estimates to form the Sharpe Ratios (risk-adjusted rates of return) that lie at the heart of this paper.
In Table 2 the means of the estimated standard deviations of the transitory and permanent are presented by racial, educational and preference for risk categories. A number of interesting results emerge from this table. Afirst result to note is that blacks face less risk from both transitory and permanent shocks to annual earnings. This is surprising given that previous research has found that blacks are more likely to experience observed shocks. Perhaps this is due to the fact that the observed shocks examined in previous work reflect only a small fraction of the amount of labor market risk that individuals face, and unobserved shocks (to the econometrician) may be less frequent or severe for blacks than whites. The second key result is that black high school graduates face a significantly lower transitory standard deviation of earnings than do black high school dropouts. The magnitude of this difference is worth noting; black high school dropouts facealmost twice the risk of transitory fluctuations of earnings than black high school graduates face. Comparing this to the differences across education groups for whites in the transitory standard deviation of earnings we can see that it is somewhat lower for high school graduates, but not of the magnitude that it is for blacks. The differences across education groups within racial groups in the permanent standard deviation of the
4The variables included to take out predictable components of earnings growth are: an age quartic, high
school graduate, black, black*high school graduate, houshold size, marital status dummies, occupational dummies, industry dummies, year dummies and age age fully intereacted with black, high school graduate, marital status dummies, occupational dummies and industry dummies
earnings shows very little difference. It is interesting to note that education appears to have little relation to permanent shocks to earnings but is closely related to transitory shocks to earnings.
One final point to take from Table 2 is how the estimated standard deviation of permanent and transitory earnings are related to preferences for risk. In a world where full insurance for labor market risk exists, there should be no relationship between pref-erences for risk and the amount of labor market risk experienced by an individual. In this world, those who dislike risk more are willing to pay more to purchase insurance or borrow and lend to smooth consumption (depending on whether the shock is permanent or transitory). They do not take action to reduce earnings volatility because the volatil-ity in earnings does not impact the volatilvolatil-ity of consumption, which is what individuals actually care about smoothing. However the results presented in this table contradict this worldview. Those who dislike risk theleast(the individuals with the highest risk tol-erance) have thelargest permanent and transitory standard deviations of earnings. The results suggest that one way those who dislike risk a great deal insure their consump-tion is to choose income streams that are less volatile. This could be thought of as a mechanism to self-insure consumption and suggests there are significant credit market constraints faced by individuals. This result is also interesting given that most of the macroeconomics literature has focused on wealth holdings as a mechanism to self-insure and the labor literature has not explored how expected labor market risk influences labor market decisions.
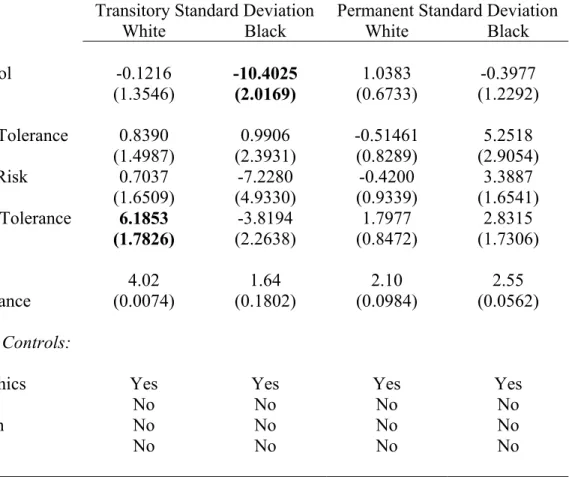
The results presented in Table 3 are for selected coefficient estimates from the cross-sectional regression (8) estimated by Ordinary Least Squares (OLS). Each column in Table 3 presents the estimates from one regression. Column 1 shows the results for the regression of the transitory standard deviation of earnings on the selected covariates for the white sample. The next column shows the results for the same regression specification for the black sample. Columns 3 and 4 are for the same specification as columns 1 and 2, but with the permanent standard deviation as the dependent variable. The other covariates included in the regression by not entered in the table are indicated in the lower panel and
are demographic variables such as marital status and the size of the household (described in more detail in the table notes). The central estimate of interest is the coefficient on the variable high school graduate, which takes a value of zero if the individual did not complete high school and one if they did. The interpretation of the coefficient is then the difference in the mean of the standard deviation (which ever one is in the regression) conditional on the other covariates in the specification.
The central result to notice in this table is that high school graduation reduces the standard deviation of earnings for blacks, but not for whites. There is no impact of high school graduation on the permanent standard deviation of earnings for either blacks or whites. This result suggests that educational attainment provides an insurance benefit for blacks in reducing the transitory volatility of the earnings process either by reducing the probability or the severity of a shock. Another interesting result in Table 3 is that preferences for risk are significant in explaining the transitory standard deviation of the earnings process for whites but not for blacks. White individuals with high risk tolerance have larger transitory volatility of the earnings process than those with low risk tolerance. Again this is consistent with individuals making labor market decisions (such as which job to accept or which occupation to work in) based on their preferences for risk. Those who dislike risk the least are the ones who accept the income stream with the most labor market risk.
One concern with the estimates in Table 3 is that they likely suffer from selection bias. Those who choose to attain higher levels of education are likely to be those of high ability. Since it is likely that those who are high ability would be less likely to experience an adverse shock such as job loss, the estimates in Table 3 are biased upwards. I address this concern using an Instrumental Variables (IV) estimation strategy. The instruments that I use are compulsory schooling laws in the state that the individual was born in place when they were 14. These laws generate plausibly exogenous variation in the attainment levels for different individuals depending on when and where they were born. The use of this IV estimation strategy will allow me to obtain an unbiased Local Average Treatment Effect (LATE) for the effect of high school graduation on the standard deviation of the
earnings process. This parameter will have a causal interpretation for the subpopulation that is induced to change educational attainment by a change in the compulsory schooling law. If the estimate were positive we can say that high school graduatecausedthe volatility in earnings to rise.
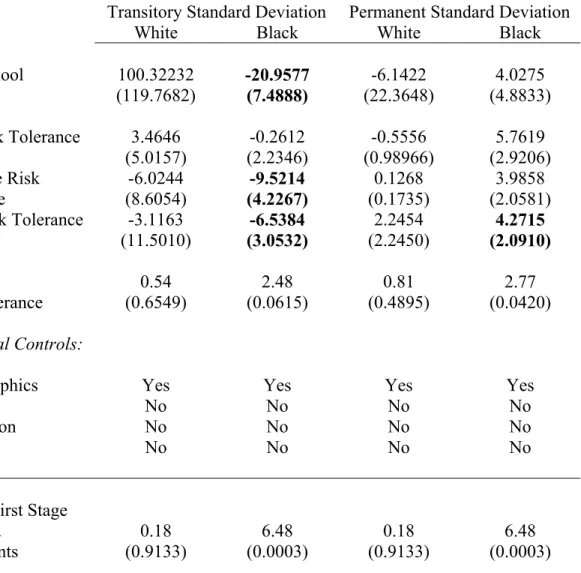
Turning now to Table 4 we can see that the results are qualitatively the same as Table 3. The effect of high school on the transitory standard deviation of earnings is negative for blacks, but not statistically different from zero for whites (at the 5 percent level). This allows to make the statement that high school graduation actually reduces the transitory volatility for blacks in a casual sense. The fact that this estimate is less than (and larger in absolute value) than the estimate in Table 3 implies that the individuals who select into higher education levels do are experiencing less risk. The other coefficient that is significantly different from zero in this table is that on the impact of moderate risk tolerance (relative to very low risk tolerance) on the transitory standard deviation of earning for blacks. This negative estimate result is puzzling. Since that those with moderate risk tolerance dislike risk less than those with very low risk tolerance we would expect this coefficient to be positive in an incomplete markets world, or zero in a full-insurance/permanent income world.
It is important to note one concern in the estimates for whites in Table 4. Instru-mental Variables estimates are very problematic if the instruments are weak in terms of changing the endogenous variable (in this case high school graduation). In this case the finite sample bias inherent in IV estimation is amplified a great deal so as to make infer-ence problematic. One useful statistic to determine if the candidate instruments are of sufficient power is to look at the F-Statistic from the test of if the excluded instruments are jointly zero in the first stage. The first stage consists of regressing the endogenous variable on all of covariates to be used in the second stage as well as the excluded instru-ments. In this paper this is a regression of the three variables for compulsory schooling laws, the risk tolerance measures and the other covariates on the high school graduation variable. If the hypothesis that the three compulsory schooling laws are jointly zero is re-jected then we can say that the instruments are of sufficient strength for the IV estimates
to be meaningful. In Table 4 we see that the instruments have sufficient power for black individuals, but not for whites. This makes the IV estimates for whites very problematic, and thus for this group the OLS estimates are preferred even with the likely presence of selection bias.
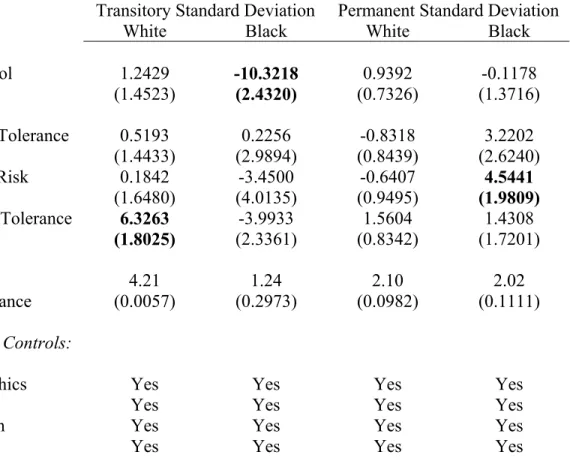
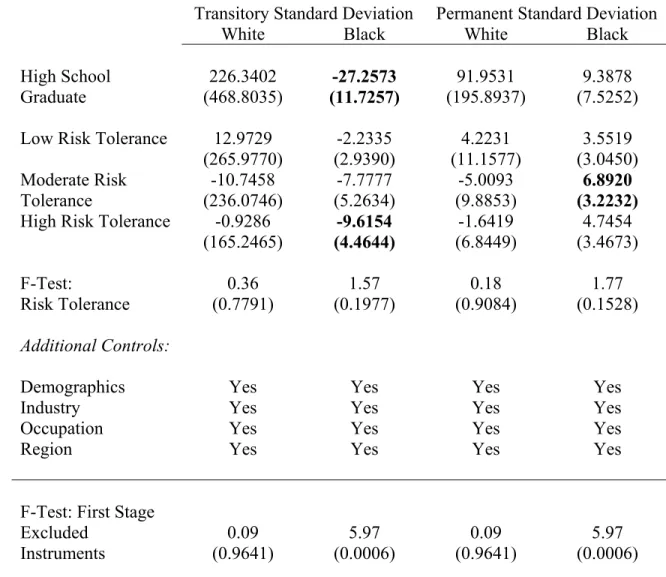
The results in Table 3 and 4 both indicate that high school graduation reduces the transitory volatility of earnings for blacks. However they are only the results from one specification. As sensitivity analysis is it useful to consider a specification that includes more covariates that are likely related to both educational attainment and the volatility of the earning process. The available variables in the PSID which I add to the specification are occupation, industry and region. The results in Tables 5 and 6 are for this specification, with these additional covariates now included in the same cross-sectional specifications as in Tables 3 and 4. The results in Table 5 and 6 essentially confirm the results in Tables 3 and 4. Again, Ifind in both the OLS and IV estimates that high school graduation lowers the transitory volatility of earnings for blacks. We do not see any relationship between education and the volatility of the earnings process for whites.
Now the estimates from Tables 3 and 4 can be used to form the Sharpe Ratios for human capital using the formula above. We can see that both sets of estimates imply that the Risk-Adjusted Rate of Return to human capital is much larger that the unadjusted return for Blacks. In fact, the Risk-Adjusted Rate of Return is shown to be between 173 percent and 669 percent larger than the unadjusted rate or return for Blacks. For whites there is no difference in the unadjusted and adjusted rate of return since they receive no insurance benefit to human capital accumulation. These estimates suggest that the value of this earnings insurance is very significant for the value of high school graduation for blacks.
In sum, I have shown that blacks receive an insurance benefit from high school graduation whereas whites do not. This result is not driven other observed covariates that are likely related to both educational attainment and the volatility of the earning process. Concerns about selection bias in the estimates are addressed through the use of
instrumental variables estimation with a plausibly exogenous determinant of high school graduation, and do not explain the central result. The key results that earnings volatility is reduced for blacks and that preferences for risk are related to earnings volatility are shown to be robust to these concerns. It is shown that estimates imply that the risk-adjusted rate of return to high school graduate is far larger than the unrisk-adjusted rate of return for blacks but not for whites.
5.2
Sources of Earnings Volatility
This section examines the sources of this racial difference in the insurance benefit of education. First I examine whether this result is coming from wage risk. Then I look at differences in the probability of occurrence of observed shocks by race and educational group.
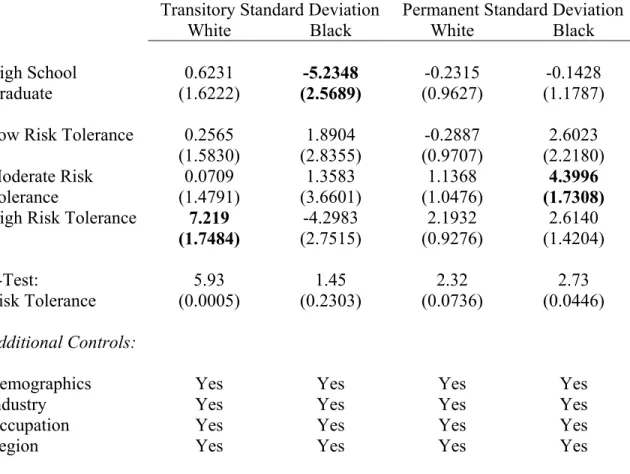
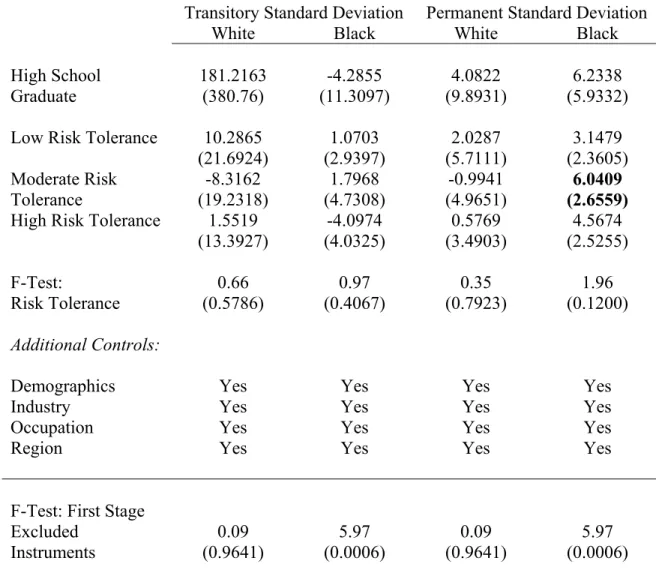
The results for the impact of education on wage volatility are reported in Tables 7 and 8. The methodology to estimate the transitory and permanent standard deviation of the wage is identical to that used above. The specification to estimate the impact education on these standard deviations for the 1977 cross-section is identical to that used above. In the OLS estimates in Table 7 we see again that high school graduation reduces the transitory standard deviation of wages for blacks but not for whites. I also find that risk tolerance is significant in explaining transitory wage volatility for whites. In Table 8 when I estimate this same specification by IV we find that the significant relationship between high school graduation and transitory wage volatility disappears. It seems that racial differences in the response of wage risk to education are not the source of the results in previous tables.
In Table 10 I look at the how three observed labor market shocks differ by race and educational group. This table displays the mean of three shocks variables. The displaced variable is an indicator of whether the individual was exogenously displaced in the previous year. The health significantly limits the ability to work variable is an indicator that takes a value of one if the individual responds that they have a health
condition that limits their ability to work significantly, and is zero otherwise. The job search duration variable measures in days the length of the last job search spell for those who are currently employed (since they have complete spells). The results of this table show that high school graduation is associated with a small increase in the probability of displacement, and a significant drop in the probability of having a work limiting health condition for individuals of both races. These changes in the probability of having one of these observed shocks do not seem to be related to education differently by race. Job search duration does seem to be lowered more from high school graduation more for blacks than whites. However, this difference is not statistically significant.
5.3
Preferences for Risk and Educational Attainment
Figures 1 and 2 show the new facts at the heart of this paper. The distributions of risk preferences are plotted by race and education. The interesting result in these figures is the difference in how individuals select into high school education in terms of risk preferences by race. For blacks (see Figure 1) we see that those with very low levels of risk tolerance (very risk averse) are more likely to be high school graduates. In contrast, we see the opposite relationship for whites in Figure 2, where those with very low tolerance for risk are less likely to be high school graduates. None of the differences in other risk tolerance categories is significant. This differing relationship between preferences for risk and educational attainment is suggestive. The revealed preferences indicate that for blacks high school graduation reduces labor risk, but for whites this risk is increased. When taken together with the results that high school graduation reduces the transitory earnings volatility of earnings for blacks, and that more risk averse blacks select into high school graduation is questions the focus of the human capital literature on permanent income considerations as the only determinant of educational outcomes.
Of course it could certainly be true that family background differences are far more important determinants of education choices than preferences for risk. Table 11 reports a probit model designed to investigate this by examining the relationship between
educa-tional attainment, risk preferences, parents’ educaeduca-tional attainment, and state of birth. In column one Ifind that after controlling for parents’ education and state of birth, risk preferences are a significant determinant of educational attainment. In column two we see a very interesting pattern in the relationship between risk preferences and attainment; it differs by race, but the relationship between attainment and parents’ background does not! This newfinding again suggests that the role of education in effecting labor market risk is different by race. The marginal effect estimates in Table 11 for the racial interac-tions show that blacks with higher levels of risk tolerance are less likely to graduate high school than blacks with lower levels of risk tolerance. So those who would most value the insurance benefit of education that blacks receive are the ones who are more likely to have a higher level of educational attainment. However, this result does not hold for whites, where we find that those with a high tolerance for risk are more likely to complete high school.
Previously work by Chen (2003) has found that preferences for risk do not have a different impact on the probability of college attendance by race, so the results here are different from prior work. This is could be due to the fact that Chen has access to a more crude measure of preferences for risk in the NLSY, which is a binary indicator variable for highly risk averse or not. It could also be true that there is not much difference in the shock process for earnings between high school graduates and college graduates for blacks.
These results show that blacks who are more risk averse are more likely to complete high school than blacks who are less risk averse. The opposite result holds for whites where those who are less risk averse are more likely to complete high school. These results are consistent with the insurance benefit that blacks receive from high school graduation having significant value and influencing the behavior of those who value this insurance benefit the most.
6
Conclusions
The central contribution of this paper is to demonstrate that high school graduation is a more valuable asset for blacks than for whites. The estimates of this paper indicate the result is due to the fact that high school graduation reduces the amount of labor market risk faced by blacks, but has no impact on labor market risk for whites. The implications for the risk adjusted return to education for blacks are shown to be very large. Further-more, the source of this difference in labor market risk, transitory earningsfluctuations, is identified. Thefinding that not only do preferences for risk matter for educational choice, but also the effect of risk preferences on educational choice is different by race - and that the effect of family background is not - suggests an important role for labor market risk in explaining racial differences in educational attainment. The other central contribution of this paper is to demonstrate that preferences for risk are related to transitory earnings (and wage) volatility. Neither of these findings can be explained by a model of optimal educational attainment set in a world where the permanent income hypothesis holds. It seems than that it would be profitable for researchers in labor economics to consider re-laxing the strong assumptions of the permanent income hypothesis in other contexts, and consider whether other observed labor market behavior is related to the desire to insure labor market risk.
This research leaves open the question of what the precise mechanisms behind this result are. Are these differences in the volatility of the earnings process for resulting from education for blacks driven risky job assignments differing by race and education level for example? It would be profitable to examine data on how firms actually employ workers of different races and education levels in different tasks. It would also be interesting to examine whether there is a difference in compensation methods between blacks and whites of difference skills. Perhaps black high school dropouts are often employed infirms where they are paid by piece-rate or sales commissions, which may well be more volatile than an annual salary.
insur-ance benefits to tenure, and who might receive them. This would add significant value to the tenure for an individual, which is not captured in previous estimates and might potentially explain why different individuals have difference tenures. This would be an-other opportunity to examine whether relaxing some of the assumptions underlying the permanent income hypothesis would help us to better understand the determinants of labor market outcomes.
7
References
Attanasio, Orazio, James Banks and Sarah Turner (2002) "Asset Holding and Consump-tion Volatility",Journal of Political Economy, 110(4), 771-792.
Attanasio, Orazio and Guglielmo Weber (1995) "Is Consumption Growth Consistent with Intertemporal Optimization? Evidence From the Consumer Expenditure Survey". Journal of Political Economy, 103(6), 1121-1157.
Attanasio, Orazio and Hamish Low (2003) "Estimating Euler Equations" Review of Economic Dynamics, Forthcoming.
Antcetol, Heather and Kelly Bedard (2002) "The Racial Wage Gap: The Importance of Labor Market Attachment Differences Across Black, Mexican and White Men", Journal of Human Resources, Forthcoming.
Barsky, Robert, Thomas Juster and Miles Kimball (1997) "Preference Parameters and Behavioral Heterogeneity: An Experimental Approach in the Health and Retirement Study,"Quarterly Journal of Economics, 112(2), 537-579.
Buchinsky, Moshe and Phillip Leslie (2000) "Educational Attainment and the Chang-ing U.S. Wage Structure: Dynamic Implications Without Rational Expectations" Working Paper, University of California - Los Angeles, Los Angeles, Ca.
Bowlus, Audra and Jean-Marc Robin (2003) "Twenty Years of Rising Inequality in US Lifetime Labor Income Values"Review of Economic Studies, Forthcoming.
Cameron, Stephen and James Heckman (2001) "The Dynamics of Educational Attain-ment for Black, Hispanic and White Males" Journal of Political Economy, 109(3), 455-499.
Card, David (2001) "Estimating the Return to Schooling: Progress on Some Persistent Econometric Problems",Econometrica, 99(5), 1127-1160.
Carneiro, Pedro, James Heckman and Dimitriy Masterov (2003) "Labor Market Dis-crimination and Racial Differences in Premarket Factors" Working Paper 10068, National Bureau of Economic Research, Cambridge MA.
Carneiro, Pedro, Karsten Hansen and James Heckman (2003) "Estimating Distributions of Treatment Effects with an Application to the Returns to Schooling and Mea-surement of the Effects of Uncertainty on College Choice"International Economic Review, 44(2), 361-423.
Carroll, Christopher (2001) "A Theory of the Consumption Function, With and Without Liquidity Constraints"Journal of Economic Perspectives, 15(3), 23-45.
Carroll, Christopher and Andrew Samwick (1997) "The Nature of Precautionary Wealth", Journal of Monetary Economics, 40(1),
Charles, Kofi Kerwin and Eric Hurst (2003) "The Correlation of Wealth Across Gener-ations",Journal of Political Economy, 111(6), 1155.
Chen, Stacy (2003) "Risk Attitude and College Attendance"Working Paper, State Uni-versity of New York at Albany, Albany, NY.
Cochrane, John (2001) Asset Pricing, Princeton University Press, Princeton, NJ. Fairlie, Robert and Lori Kletzer (1998) "Jobs Lost, Jobs Regained: An Analysis of
Black/White Differences in Job Displacement in the 1980s" Industrial Relations, 37(4), 460-475.
Fryer, Roland and Steven Levitt (2003) "Understanding The Black-White Test Score Gap in the First Two Years of School"Review of Economics and Statistics, Forthcoming. Heckman, James, Robert Lalonde and Jeffrey Smith (1999) "The Economics and Econo-metrics of Active Labor Market Programmes" In Orley Ashenfelter and David Card, eds.,Handbook of Labor Economics, Volume 3A., North-Holland, Amsterdam, 1865-2097.
Heckman, James, Lance Lochner and Petra Todd (2003) "Fifty Years of Mincer Earn-ings Regressions". Working Paper, National Bureau of Economic Research 9732, Cambridge, MA.
Heckman, James, Jeffrey Smith and Nancy Clements (1997) "Making the Most Out of Programme Evaluations and Social Experiments: Accounting for Heterogeneity in Programme Impacts."Review of Economic Studies. 64(4), 487-535.
Hellerstein, Judith, David Neumark and Kenneth Troske (1999) "Wages, Productivity, and Worker Characteristics: Evidence from Plant-Level Production Functions and Wage Equations"Journal of Labor Economics, 17(3), 409-446.
Krebs, Tom (2003) "Human Capital Risk and Economic Growth" Quarterly Journal of Economics, 188(2), 709-704.
Lochner, Lance and Enrico Moretti (2003) "The Effect of Education on Crime: Evi-dence from Prison Inmates, Arrests and Self-Reports",American Economic Review, Forthcoming
Mazzocco, Maurizio (2003) "Saving, Risk Sharing and Preferences for Risk", Working Paper, University of Wisconsin, Madison, WI.
Meghir, Costas and Luigi Pistaferri (2004) "Income Variance Dynamics and Heterogene-ity" Econometrica, 72(1), 1-32.
Neal, Derek and William Johnson (1996) "The Role of Premarket Factors in Black-White Wage Differences"Journal of Political Economy, 104(5), 869-895.
Palacios-Huetra, Ignacio (2003) "An Empirical Analysis of the Risk Properties of Human Capital Returns"American Economic Review, 93(3), 948-964.
Pries, Micheal (2001) "Uninsured Idiosyncratic Risk and Human Capital Accumulation" Working Paper, University of Maryland, College Park, MD.
Vissing-Jorgensen, Annette (2002) "Limited Asset Market Participation and the Elas-ticity of Intertemporal Substitution"Journal of Political Economy, 110(4), 825-853. Vissing-Jorgensen, Annette (2001) "Towards an Explanation of Household Portfolio Choice Heterogeneity: Nonfinancial Income and Participant Cost Structures " Work-ing Paper, Northwestern University, Evanston, IL.
Table 1: Earnings, Wages and Hours by Race and Education White Black High School Graduate High School Dropout High School Graduate High School Dropout Mean:
Log Annual Labor and Social
Insurance Income 10.41 10.17 10.20 9.84 Log Average Annual Wage 2.70 2.47 2.55 2.19
Annual Hours 2288 2204 2152 2101
Standard Deviation:
Log Annual Labor and Social
Insurance Income 0.51 0.54 0.41 0.50 Log Average Annual Wage 0.50 0.51 0.35 0.51
Annual Hours 586 878 471 777
Notes: Source: Authors calculations using the PSID data. The sample contains 790 white high school graduate observations, 164 white high school dropout observations, 132 black high school graduate observation, and 135 black high school dropout observations, and is the 1977 cross-section. All estimates weight observations by probability of sampling weights. Dependent variables are measured in 1992 Dollars using the GDP consumption deflator.
Table 2: Means of Transitory and Permanent Standard Deviation of Log Annual Labor and Social Insurance Income by Subgroup
Transitory Standard Deviation Permanent Standard Deviation White 0.2314 (0.0052) 0.1155 (0.0027) Black 0.1885 (0.0115) 0.1001 (0.0068) High School Dropout 0.2408
(0.0110)
0.1131 (0.0053) High School Graduate 0.2267
(0.0056) (0.0030) 0.1151 White High School Dropout 0.2402
(0.0122)
0.1142 (0.0059) White High School Graduate 0.2297
(0.0057)
0.1158 (0.0031) Black High School Dropout 0.2464
(0.0156) (0.0091) 0.1045 Black High School Graduate 0.1542
(0.0130)
0.0975 (0.0093) Very Low Risk Tolerance 0.2115
(0.0067)
0.1073 (0.0040)
Low Risk Tolerance 0.2206
(0.0133) (0.0072) 0.1057 Moderate Risk Tolerance 0.2162
(0.0154)
0.1068 (0.0083) High Risk Tolerance 0.2756
(0.0159)
0.1309 (0.0076)
Notes: Source: Authors calculations using the PSID data. All estimates weight observations by probability of sampling weights. The sample contains 1280 observations. Log annual labor and social insurance income is measured in 1992 Dollars using the GDP consumption deflator.
Table 3: OLS Estimates for Transitory and Permanent Standard Deviations of Log Annual Labor and Social Insurance Income By Race
Transitory Standard Deviation Permanent Standard Deviation White Black White Black High School Graduate -0.1216 (1.3546) -10.4025 (2.0169) 1.0383 (0.6733) -0.3977 (1.2292) Low Risk Tolerance 0.8390
(1.4987) 0.9906 (2.3931) -0.51461 (0.8289) 5.2518 (2.9054) Moderate Risk Tolerance 0.7037 (1.6509) -7.2280 (4.9330) -0.4200 (0.9339) 3.3887 (1.6541) High Risk Tolerance 6.1853
(1.7826) -3.8194 (2.2638) (0.8472) 1.7977 (1.7306) 2.8315 F-Test: Risk Tolerance 4.02 (0.0074) 1.64 (0.1802) 2.10 (0.0984) 2.55 (0.0562) Additional Controls:
Demographics Yes Yes Yes Yes
Industry No No No No
Occupation No No No No
Region No No No No
Notes: Source: Authors calculations using the PSID data. Estimates and standards errors (in parentheses) presented are the multiplied by 100. All regressions include a constant , an age quartic, and a missing risk tolerance measure dummy. Demographic measures included are dummies for the marital status and, a variable for the number of members in the household. Occupation and Industry controls are eight industry and eight occupation dummies as well as missing indicators for each of industry and occupation. Region controls contain six dummy variables for the census regions. All estimates weight observations by probability of sampling weights. The sample contains 984 white and 276 black observations for the 1977 cross-section. Log annual labor and social insurance income is measured in 1992 Dollars using the GDP consumption deflator.
Table 4: TSLS Estimates for Transitory and Permanent Standard Deviations of Log of Annual Labor and Social Insurance Income By Race
Transitory Standard Deviation Permanent Standard Deviation White Black White Black High School Graduate 100.32232 (119.7682) -20.9577 (7.4888) -6.1422 (22.3648) 4.0275 (4.8833) Low Risk Tolerance 3.4646
(5.0157) -0.2612 (2.2346) -0.5556 (0.98966) 5.7619 (2.9206) Moderate Risk Tolerance -6.0244 (8.6054) (4.2267) -9.5214 0.1268 (0.1735) 3.9858 (2.0581) High Risk Tolerance -3.1163
(11.5010) (3.0532) -6.5384 2.2454 (2.2450) (2.0910)4.2715 F-Test: Risk Tolerance 0.54 (0.6549) 2.48 (0.0615) 0.81 (0.4895) 2.77 (0.0420) Additional Controls:
Demographics Yes Yes Yes Yes
Industry No No No No
Occupation No No No No
Region No No No No
F-Test: First Stage Excluded Instruments 0.18 (0.9133) 6.48 (0.0003) 0.18 (0.9133) 6.48 (0.0003)
Notes: Source: Authors calculations using the PSID data. Estimates and standards errors (in parentheses) presented are the multiplied by 100. The excluded instruments are three dummy variables for compulsory schooling laws in the individuals’ state of birth in the year they were age 14. All regressions include a constant, an age quartic, and a missing risk tolerance measure dummy. Demographic measures included are dummies for the marital status and, a variable for the number of members in the household. Occupation and Industry controls are eight industry and eight occupation dummies as well as missing indicators for each of industry and occupation. Region controls contain six dummy variables for the census regions. All estimates weight observations by probability of sampling weights. The sample contains 960 white and 271 black observations for the 1977 cross-section. Log annual labor and social insurance income is measured in 1992 Dollars using the GDP consumption deflator.
Table 5: OLS Estimates for Transitory and Permanent Standard Deviations of Log Annual Labor and Social Insurance Income By Race
Transitory Standard Deviation Permanent Standard Deviation White Black White Black High School Graduate 1.2429 (1.4523) -10.3218 (2.4320) 0.9392 (0.7326) -0.1178 (1.3716) Low Risk Tolerance 0.5193
(1.4433) 0.2256 (2.9894) -0.8318 (0.8439) 3.2202 (2.6240) Moderate Risk Tolerance 0.1842 (1.6480) -3.4500 (4.0135) -0.6407 (0.9495) (1.9809)4.5441
High Risk Tolerance 6.3263 (1.8025) -3.9933 (2.3361) (0.8342) 1.5604 (1.7201) 1.4308 F-Test: Risk Tolerance 4.21 (0.0057) 1.24 (0.2973) 2.10 (0.0982) 2.02 (0.1111) Additional Controls:
Demographics Yes Yes Yes Yes
Industry Yes Yes Yes Yes
Occupation Yes Yes Yes Yes
Region Yes Yes Yes Yes
Notes: Source: Authors calculations using the PSID data. Estimates and standards errors (in parentheses) presented are the multiplied by 100. All regressions include a constant, an age quartic, and a missing risk tolerance measure dummy. Demographic measures included are dummies for the marital status and, a variable for the number of members in the household. Occupation and Industry controls are eight industry and eight occupation dummies as well as missing indicators for each of industry and occupation. Region controls contain six dummy variables for the census regions. All estimates weight observations by probability of sampling weights. The sample contains 984 white and 276 black observations for the 1977 cross-section. Log annual labor and social insurance income is measured in 1992 Dollars using the GDP consumption deflator.
Table 6: TSLS Estimates for Transitory and Permanent Standard Deviations of Log of Annual Labor and Social Insurance Income By Race
Transitory Standard Deviation Permanent Standard Deviation White Black White Black High School Graduate 226.3402 (468.8035) -27.2573 (11.7257) 91.9531 (195.8937) 9.3878 (7.5252) Low Risk Tolerance 12.9729
(265.9770) -2.2335 (2.9390) 4.2231 (11.1577) 3.5519 (3.0450) Moderate Risk Tolerance -10.7458 (236.0746) -7.7777 (5.2634) -5.0093 (9.8853) (3.2232)6.8920
High Risk Tolerance -0.9286
(165.2465) (4.4644)-9.6154 -1.6419 (6.8449) (3.4673) 4.7454 F-Test: Risk Tolerance 0.36 (0.7791) 1.57 (0.1977) 0.18 (0.9084) 1.77 (0.1528) Additional Controls:
Demographics Yes Yes Yes Yes
Industry Yes Yes Yes Yes
Occupation Yes Yes Yes Yes
Region Yes Yes Yes Yes
F-Test: First Stage Excluded Instruments 0.09 (0.9641) 5.97 (0.0006) 0.09 (0.9641) 5.97 (0.0006)
Notes: Source: Authors calculations using the PSID data. Estimates and standards errors (in parentheses) presented are the multiplied by 100. The excluded instruments are three dummy variables for compulsory schooling laws in the individuals’ state of birth in the year they were age 14. All regressions include a constant, an age quartic, and a missing risk tolerance measure dummy. Demographic measures included are dummies for the marital status and, a variable for the number of members in the household. Occupation and Industry controls are eight industry and eight occupation dummies as well as missing indicators for each of industry and occupation. Region controls contain six dummy variables for the census regions. All estimates weight observations by probability of sampling weights. The sample contains 960 white and 271 black observations for the 1977 cross-section. Log annual labor and social insurance income is measured in 1992 Dollars using the GDP consumption deflator.
Table 7: OLS Estimates for Transitory and Permanent Standard Deviations of Log Wage By Race
Transitory Standard Deviation Permanent Standard Deviation White Black White Black High School Graduate 0.6231 (1.6222) -5.2348 (2.5689) -0.2315 (0.9627) -0.1428 (1.1787) Low Risk Tolerance 0.2565
(1.5830) 1.8904 (2.8355) -0.2887 (0.9707) 2.6023 (2.2180) Moderate Risk Tolerance 0.0709 (1.4791) 1.3583 (3.6601) 1.1368 (1.0476) (1.7308)4.3996
High Risk Tolerance 7.219 (1.7484) -4.2983 (2.7515) (0.9276) 2.1932 (1.4204) 2.6140 F-Test: Risk Tolerance 5.93 (0.0005) 1.45 (0.2303) 2.32 (0.0736) 2.73 (0.0446) Additional Controls:
Demographics Yes Yes Yes Yes
Industry Yes Yes Yes Yes
Occupation Yes Yes Yes Yes
Region Yes Yes Yes Yes
Notes: Source: Authors calculations using the PSID data. Estimates and standards errors (in parentheses) presented are the multiplied by 100. All regressions include a constant, an age quartic, and a missing risk tolerance measure dummy. Demographic measures included are dummies for the marital status and, a variable for the number of members in the household. Occupation and Industry controls are eight industry and eight occupation dummies as well as missing indicators for each of industry and occupation. Region controls contain six dummy variables for the census regions. All estimates weight observations by probability of sampling weights. The sample contains 984 white and 276 black observations for the 1977 cross-section. Log wage is measured in 1992 Dollars using the GDP consumption deflator.
Table 8: TSLS Estimates for Transitory and Permanent Deviations of Log Wage By Race
Transitory Standard Deviation Permanent Standard Deviation White Black White Black High School Graduate 181.2163 (380.76) -4.2855 (11.3097) 4.0822 (9.8931) 6.2338 (5.9332) Low Risk Tolerance 10.2865
(21.6924) 1.0703 (2.9397) 2.0287 (5.7111) 3.1479 (2.3605) Moderate Risk Tolerance -8.3162 (19.2318) 1.7968 (4.7308) -0.9941 (4.9651) (2.6559)6.0409
High Risk Tolerance 1.5519
(13.3927) (4.0325) -4.0974 (3.4903) 0.5769 (2.5255) 4.5674 F-Test: Risk Tolerance 0.66 (0.5786) 0.97 (0.4067) 0.35 (0.7923) 1.96 (0.1200) Additional Controls:
Demographics Yes Yes Yes Yes
Industry Yes Yes Yes Yes
Occupation Yes Yes Yes Yes
Region Yes Yes Yes Yes
F-Test: First Stage Excluded Instruments 0.09 (0.9641) 5.97 (0.0006) 0.09 (0.9641) 5.97 (0.0006)
Notes: Source: Authors calculations using the PSID data. Estimates and standards errors (in parentheses) presented are the multiplied by 100. The excluded instruments are three dummy variables for compulsory schooling laws in the individuals’ state of birth in the year they were age 14. All regressions include a constant, an age quartic, and a missing risk tolerance measure dummy. Demographic measures included are dummies for the marital status and, a variable for the number of members in the household. Occupation and Industry controls are eight industry and eight occupation dummies as well as missing indicators for each of industry and occupation. Region controls contain six dummy variables for the census regions. All estimates weight observations by probability of sampling weights. The sample contains 960 white and 271 black observations for the 1977 cross-section. Log wage is measured in 1992 Dollars using the GDP consumption deflator.