AN IMPROVED WAVELET NEURAL NETWORK FOR
CLASSIFICATION AND FUNCTION
APPROXIMATION
ONG PAULINE
UNIVERSITI SAINS MALAYSIA
2011
AN IMPROVED WAVELET NEURAL NETWORK FOR
CLASSIFICATION AND FUNCTION APPROXIMATION
by
ONG PAULINE
Thesis submitted in fulfillment of the requirements
for the Degree of
Doctor of Philosophy
ii
ACKNOWLEDGEMENTS
Foremost, I would like to take this opportunity to thank my thesis supervisor, Professor Zarita binti Zainuddin, for introducing to me the theory of wavelets as well as artificial neural networks, and for her expert guidance and encouragement. Her perspective and insight had a profound influence on this thesis.
Special thanks to The Scheme of Graduate Assistant (Teaching) and USM Fellowship under Universiti Sains Malaysia for their generous support which made this research possible.
Last, but certainly not least, I would like to express my gratitude to my parents and family, for their patience, relentless support and sacrifices all these years.
To all others whose names I have failed to mention but who have in one way or another helped in the completion of this thesis, I owe you my humblest gratitude.
iii
TABLE OF CONTENTS
Page
ACKNOWLEDGEMENTS ii
TABLE OF CONTENTS iii
LIST OF TABLES ix
LIST OF FIGURES xiv
LIST OF ABBREVIATION xxi
ABSTRAK xxiv ABSTRACT xxvi CHAPTER 1 INTRODUCTION 1 1.1 Preliminaries
1.2 Introduction to Artificial Neural Networks 1.3 Problem Statement
1.4 Objectives of Thesis
1.5 Scope and Organization of Thesis
1 7 10 15 16 CHAPTER 2
WAVELET AND WAVELET NEURAL NETWORKS
19
2.1 Introduction
2.2 Introduction to Wavelet 2.3 Properties of Wavelets
2.4 A Brief Historical Perspective of Wavelets 2.5 From Fourier to Wavelet Analysis
19 20 22 23 25
iv
2.5.1 Fourier Transform
2.5.2 Windowed Fourier Transform 2.5.3 Wavelet Transform
2.6 Theoretical Analysis of Wavelet Transform 2.6.1 Continuous Wavelet Transform 2.6.2 Discrete Wavelet Transform 2.7 Applications o f Wavelet Transform 2.8 Introduction to Wavelet Neural Networks
2.8.1 Universal Function Approximation Theorem and Artificial Neural Network Theory
2.8.2 The Emergence of the Wavelet Neural Networks 2.8.3 Wavelet Neural Networks and its Parameterization
2.8.3 (a) The Structure of Wavelet Neural Networks 2.8.3 (b) Initialization of Wavelet Neural Networks 3.8.3 (c) The Learning in Wavelet Neural Networks 2.8.4 Unification of Neural and Wavelet Neural Networks
2.8.4 (a) Distance-based Neural Networks 2.8.4 (b) Radial Wavelet Networks
2.8.4 (c) Weighted Radial Basis Functions 2.8.5 Applications of Wavelet Neural Networks 2.9 Summary 25 28 29 30 32 34 36 38 40 43 44 45 46 48 50 52 53 53 54 56 CHAPTER 3
AN IMPROVED FUZZY C-MEANS CLUSTERING ALGORITHM
57
3.1 Introduction
3.2 The Conventional Clustering Algorithm
3.2.1 An Overview of the K-Means Clustering Algorithm 3.2.2 An Overview of the Fuzzy C-Means Clustering Algorithm 3.3 The Point Symmetry Distance
57 58 59 60 64
v
3.4 The Point Symmetry Based Clustering Algorithm 3.4.1 The Point Symmetry Based K-Means Clustering
3.4.2 The Point Symmetry Based Fuzzy C-Means Clustering 3.5 Limitations of the Point Symmetry Distance Measure
3.5.1 Lacking Of the Distance Difference Symmetry Property 3.5.2 Inaccuracy for the Symmetrical Inter-Clusters
3.5.3 Lacking Of the Closure Property 3.6 The Symmetry Similarity Level Operator
3.6.1 The Distance Similarity Level (DSL) 3.6.2 The Orientation Similarity Level (OSL) 3.6.3 The Symmetry Similarity Level (SSL) 3.6.4 Speeding-Up for Computation-Saving
3.7 The Modified Point Symmetry Based Clustering Algorithm 3.7.1 The Modified Point Symmetry Based K-Means Clustering 3.7.2 The Proposed Modified Point Symmetry Based Fuzzy C- Means Clustering 3.8 Summary 66 66 71 75 75 76 78 78 79 80 80 84 85 85 90 97 CHAPTER 4
AN IMPROVED WAVELET NEURAL NETWORK APPROACH FOR CLASSIFICATION
4.1 Introduction
4.2 Multiclass Tumours Classification 4.2.1 Research Background 4.2.2 Materials
4.2.3 Microarray Data Preprocessing 4.2.4 Gene Selection
4.2.5 Wavelet Neural Networks Based Classifier 4.2.5 (a) Types of Wavelet Families
100 100 105 105 107 108 111 114 114
vi
4.2.5 (b) Selection of Input, Hidden and Output Nodes 4.2.5 (c) Initialization of Parameter
4.2.6 Multifold Cross Validation 4.2.7 Performance Assessment 4.2.8 Result and Discussion
4.2.8 (a) Experimental Result: LEU Dataset 4.2.8 (b) Experimental Result: SRBCT Dataset 4.2.8 (c) Experimental Result: GLO Dataset 4.2.8 (d) Experimental Result: CNS Dataset 4.2.8 (e) Discussion
4.2.9 Performance Comparison with Other Approaches 4.2.9 (a) Performance Comparison with Lee’s Work
4.2.9 (b) Performance Comparison with Ensemble Classifiers 4.2.9 (c) Performance Comparison with Support Vector Machines Approach
4.2.9 (d) Performance Comparison with Computational Intelligence and Statistical Method
4.3 Type II Diabetic Patients Classification 4.3.1 Research Background
4.3.2 Materials and Methodology 4.3.3 Result and Discussion
4.3.4 Performance Comparison and Discussion 4.4 Summary 116 117 117 117 118 118 121 123 125 131 136 136 138 139 140 143 143 146 147 152 154 CHAPTER 5
AN IMPROVED WAVELET NEURAL NETWORK APPROACH FOR FUNCTION APPROXIMATION 5.1 Introduction 5.2 Experimental Design 156 156 157
vii
5.3 Result and Discussion
5.3.1 Case 1: One-Dimensional Continuous Exponential Function 5.3.2 Case 2: One-Dimensional Continuous Periodic Function 5.3.3 Case 3: Two-Dimensional Continuous Exponential Function 5.3.4 Case 4: Two-Dimensional Continuous Periodic Function 5.3.5 Case 5: One-Dimensional Continuous Piecewise Function 5.4 Real-World Application: Blood Glucose Level Prediction
5.4.1 Research Background 5.4.2 Materials and Methodology 5.4.3 Result and Discussion
5.4.4 Performance Comparison and Discussion 5.5 Summary 159 160 164 170 172 177 189 189 191 196 202 206 CHAPTER 6
AN IMPROVED WAVELET APPROACH FOR MICROARRAY SPOT SEGMENTATION
6.1 Introduction
6.2 Microarray Image Processing 6.2.1 Addressing/Gridding 6.2.2 Segmentation
6.2.3 Quantification
6.3 Sources of Microarray Image Variations 6.4 Existing Segmentation Methods
6.4.1 Fixed Circle Segmentation 6.4.2 Adaptive Circle Segmentation 6.4.3 Adaptive Shape Segmentation 6.4.4 Histogram Segmentation
6.4.5 Other Proposed Microarray Spot Segmentation Methods 6.4.6 Fuzzy Gaussian Mixture Model Segmentation
209 209 210 211 212 213 214 215 216 217 217 218 219 221
viii
6.5 Image Segmentation Using Wavelet Approach
6.5.1 1-D Wavelet-Based Multiscale Edge Detection 6.5.2 2-D Wavelet-Based Multiscale Edge Detection 6.6 Image Segmentation Using A Modified Wavelet Approach 6.7 Experimental Simulations and Comparison
6.8 Summary 222 223 226 230 234 246 CHAPTER 7
CONCLUSION AND FUTURE WORK
7.1 Conclusions and Contributions 7.2 Suggestions for Future Work
247 247 249 REFERENCES 252 LIST OF PUBLICATIONS 273 APPENDICES
Appendix A Experimental Results: Case 1 Appendix B Experimental Results: Case 2 Appendix C Experimental Results: Case 3 Appendix D Experimental Results: Case 4 Appendix E Experimental Results: Case 5 Appendix F Experimental Results: Diabetes
275 275 281 287 293 299 305
ix
LIST OF TABLES
Page 1.1 Development of ANNs over the past few decades 5 3.1 The VPC values of FCM, PSDFCM and the proposed
MPSDFCM algorithms for the first artificial dataset
93
3.2 The VPC values of FCM, PSDFCM and the proposed MPSDFCM algorithms for the second artificial dataset
95
4.1 Information for the benchmark microarray dataset used in the experimental simulations
108
4.2 Performance comparison of WNNs for Leukemia dataset (Accuracy)
119
4.3 Performance comparison of WNNs for Leukemia dataset (Sensitivity)
119
4.4 Performance comparison of WNNs for Leukemia dataset (Specificity)
119
4.5 Performance comparison of WNNs for SRBCT dataset (Accuracy)
122
4.6 Performance comparison of WNNs for SRBCT dataset (Sensitivity)
122
4.7 Performance comparison of WNNs for SRBCT dataset (Specificity)
122
4.8 Performance comparison of WNNs for GLO dataset (Accuracy) 123 4.9 Performance comparison of WNNs for GLO dataset (Sensitivity) 124 4.10 Performance comparison of WNNs for GLO dataset (Specificity) 124 4.11 Performance comparison of WNNs for CNS dataset (Accuracy) 126 4.12 Performance comparison of WNNs for CNS dataset (Sensitivity:
MED)
127
4.13 Performance comparison of WNNs for CNS dataset (Specificity: MED)
x
4.14 Performance comparison of WNNs for CNS dataset (Sensitivity: MG)
127
4.15 Performance comparison of WNNs for CNS dataset (Specificity: MG)
128
4.16 Performance comparison of WNNs for CNS dataset (Sensitivity: AT/RT)
128
4.17 Performance comparison of WNNs for CNS dataset (Specificity: AT/RT)
128
4.18 Performance comparison of WNNs for CNS dataset (Sensitivity: NC)
129
4.19 Performance comparison of WNNs for CNS dataset (Specificity: NC)
129
4.20 Performance comparison of WNNs for CNS dataset (Sensitivity: PNET)
129
4.21 Performance comparison of WNNs for CNS dataset (Specificity: PNET)
130
4.22 Performance comparison of the proposed improved WNNs based classifier with Lee’s work (Lee et al., 2005)
137
4.23 Performance comparison of the proposed improved WNNs based classifier with ensemble classifier
138
4.24 Performance comparison of the proposed improved WNNs based classifier with SVMs classifier
139
4.25 Performance comparison of the proposed improved WNNs based classifier with computational intelligence based classifier
141
4.26 Clinical and biomedical characteristics of male subjects with NGT, IGT and DM2
146
4.27 Performance comparison of WNNs for Diabetes dataset (Accuracy)
148
4.28 Performance comparison of WNNs for Diabetes dataset (Sensitivity: NGT)
148
4.29 Performance comparison of WNNs for Diabetes dataset (Specificity: NGT)
xi
4.30 Performance comparison of WNNs for Diabetes dataset (Sensitivity: IGT)
149
4.31 Performance comparison of WNNs for Diabetes dataset (Specificity: IGT)
149
4.32 Performance comparison of WNNs for Diabetes dataset (Sensitivity: DM2)
149
4.33 Performance comparison of WNNs for Diabetes dataset (Specificity: DM2)
150
4.34 Performance comparison of MLPs, RBFNNs and WNNs for Diabetes dataset (Accuracy)
152
4.35 Performance comparison of MLPs, RBFNNs and WNNs for Diabetes dataset (Sensitivity)
152
4.36 Performance comparison of MLPs, RBFNNs and WNNs for Diabetes dataset (Specificity)
152
5.1 Prediction error in terms of MSE for RBFNNs and WNNs with different activation functions and initialization methods (Case 1)
160
5.2 Percentage of accuracy improvements for the proposed MPSDFCM algorithm as compared with other initialization methods (Case 1)
164
5.3 Prediction error in terms of MSE testing data for RBFNNs and WNNs with different activation functions and initialization methods (Case 2)
167
5.4 Percentage of accuracy improvements for the proposed MPSDFCM algorithm as compared with other initialization methods (Case 2)
169
5.5 Prediction error in terms of MSE for RBFNNs and WNNs with different activation functions and initialization methods (Case 3)
170
5.6 Percentage of accuracy improvements for the proposed MPSDFCM algorithm as compared with other initialization methods (Case 3)
171
5.7 Prediction error in terms of MSE for RBFNNs and WNNs with different activation functions and initialization methods (Case 4)
173
5.8 Percentage of accuracy improvements for the proposed MPSDFCM algorithm as compared with other initialization
xii
methods (Case 4)
5.9 (a) Prediction error for RBFNNs and WNNs with different activation functions and initialization methods (Case 5): MSE
178
5.9 (b) Prediction error for RBFNNs and WNNs with different activation functions and initialization methods (Case 5): ERR
178
5.10 Percentage of accuracy improvements for the proposed MPSDFCM algorithm as compared with other initialization methods (Case 5)
185
5.11 Performance comparison of the prediction capability of the proposed model with the results from other researchers in approximating the benchmark piecewise function
186
5.12 Detectable factors that influence the fluctuation of blood glucose level
190
5.13 Daily information for a patient to fill in 192 5.14 Correlation coefficients between the blood glucose levels for four
intervals
193
5.15 The 19 input variables used for predicting the blood glucose level 194
5.16 Total variance for each interval 196
5.17 Result on blood glucose concentration prediction (in terms of RMSE) using WNNs with different activation functions and initialization methods: Morning Interval
197
5.18 Result on blood glucose concentration prediction (in terms of RMSE) using WNNs with different activation functions and initialization methods: Afternoon Interval
197
5.19 Result on blood glucose concentration prediction (in terms of RMSE) using WNNs with different activation functions and initialization methods: Evening Interval
198
5.20 Result on blood glucose concentration prediction (in terms of RMSE) using WNNs with different activation functions and initialization methods: Night Interval
198
5.21 Percentage of accuracy improvements for the proposed MPSDFCM algorithm as compared with other initialization methods (Morning Interval)
xiii
5.22 Percentage of accuracy improvements for the proposed MPSDFCM algorithm as compared with other initialization methods (Afternoon Interval)
201
5.23 Percentage of accuracy improvements for the proposed MPSDFCM algorithm as compared with other initialization methods (Evening Interval)
202
5.24 Percentage of accuracy improvements for the proposed MPSDFCM algorithm as compared with other initialization methods (Night Interval)
202
5.25 Performance comparison of the proposed WNNs with other models
204
6.1 Quantitative evaluations on microarray spot segmentation results 240 6.2 Quantitative evaluations on microarray spot segmentation results
with other segmentation approaches
xiv
LIST OF FIGURES
Page
1.1 Schematic diagram of a neuron 3
1.2 Connection between the synapses and the dendrites of other neurons
4
1.3 McColluch and Pitts model 5
1.4 Schematic diagram of an ANN 7
2.1 (a) A schematic diagram of a wavelet 20
2.1 (b) A schematic diagram of a wave (sinusoid) 20
2.2 Plot of a stationary signal 26
2.3 Fourier Transform of a stationary signal 27
2.4 Plot of a non-stationary signal 27
2.5 Fourier Transform of a non-stationary signal 28 2.6 Visualization of time-frequency representation of a
non-stationary signal in FT, WFT and WT
31
2.7 A three-level wavelet decomposition tree 35
2.8 A three-level wavelet reconstruction tree 36
2.9 A single layer feed-forward neural network 42 2.10 The architecture of a wavelet neural network 46 2.11 Flowchart of the wavelet neural networks learning algorithm 51
3.1 Flowchart of the KM clustering algorithm 61
3.2 Flowchart of the FCM clustering algorithm 63
3.3 Example of PSD 65
3.4 (a) The dataset contains a combination of ring-shaped, compact and linear clusters
69
xv
3.4 (c) The clustering result achieved by PSDKM clustering algorithm 69 3.5 Flowchart of the PSDKM clustering algorithm 70 3.6 (a) The dataset contains a combination of ring-shaped, rectangular
compact and linear clusters
73
3.6 (b) The clustering result achieved by FCM 73
3.6 (c) The clustering result achieved by PSDFCM clustering algorithm 73 3.7 Flowchart of the PSDFCM clustering algorithm 74 3.8 An example to illustrate the problem of lacking the distance
difference symmetry property for the PSD
75
3.9 An example to illustrate the inefficiency of PSD 77 3.10 An example to illustrate the distance difference symmetry
property
79
3.11 An example to illustrate the inefficiency of SSL’ 81 3.12 (a) The dataset consists of two compact circles and two crossed
ellipsoidal shells
88
3.12 (b) The clustering result achieved by the PSDKM 88 3.12 (c) The clustering result achieved by the MPSDKM 88 3.13 Flowchart of the MPSDKM clustering algorithm 89 3.14 The dataset consists of three compact circles 93 3.15 The clustering result achieved by the FCM algorithm 93 3.16 The clustering result achieved by the PSDFCM algorithm 94 3.17 The clustering result achieved by the proposed MPSDFCM
algorithm
94
3.18 The artificial dataset consists of two compact circles and two ellipsoidal shells
95
3.19 The clustering result achieved by the FCM algorithm 95 3.20 The clustering result achieved by the PSDFCM algorithm 96
xvi
3.21 The clustering result achieved by the proposed MPSDFCM algorithm
96
3.22 Flowchart of the proposed MPSDFCM clustering algorithm 99
4.1 A RGB microarray image 102
4.2 An example of a gene expression matrix 103
4.3 The pipeline of a microarray experiment 104
4.4 (a) Box-plot of the Leukemia dataset without preprocessing 110 4.4 (b) Box-plot of the Leukemia dataset after the logarithmic
transformation and quantile normalization
110
4.5 (a) Schematic diagram for the wavelet: Mexican Hat 115 4.5 (b) Schematic diagram for the wavelet: Gaussian wavelet 115 4.5 (c) Schematic diagram for the wavelet: Morlet 115 4.6 Performance comparison of wavelet neural network models for
LEU dataset
120
4.7 Performance comparison of wavelet neural network models for GLO dataset
123
4.8 Performance comparison of wavelet neural network models for CNS dataset
126
4.9 Performance comparison of wavelet neural network models for diabetes dataset
147
5.1 Case 1-Simulation results of RBFNNs with Gaussian activation function
161
5.2 Case 1-Simulation results of WNNs with Mexican Hat activation function
161
5.3 Case 1-Simulation results of WNNs with Gaussian wavelet activation function
162
5.4 Case 1-Simulation results of WNNs with Morlet activation function
162
5.5 Case 2-Simulation results of RBFNNs with Gaussian activation function
xvii
5.6 Case 2-Simulation results of WNNs with Mexican Hat activation function
165
5.7 Case 2-Simulation results of WNNs with Gaussian wavelet activation function
166
5.8 Case 2-Simulation results of WNNs with Morlet activation function
166
5.9 Approximation error of RBFNNs and WNNs with different activation functions and initialization approaches
168
5.10 The original piecewise function in Case 5 179
5.11 Case 5: Simulation results of RBFNNs with Gaussian activation function
180
5.12 Case 5: Simulation results of WNNs with Mexican Hat activation function
180
5.13 Case 5: Simulation results of WNNs with Gaussian wavelet activation function
181
5.14 Case 5: Simulation results of WNNs with Morlet activation function
181
5.15 Case 5: Simulation results of RBFNNs -Zoom-In 182 5.16 Case 5: Simulation results of WNNs (Mexican Hat) -Zoom-In 182 5.17 Case 5: Simulation results of WNNs (Gaussian wavelet)
-Zoom-In
183
5.18 Case 5: Simulation results of WNNs (Morlet) -Zoom-In 183 5.19 Case 5: Simulation results of RBFNNs and WNNs with
MPSDFCM algorithm
184
5.20 Case 5: Simulation results of RBFNNs and WNNs with MPSDFCM algorithm (Zoom-In)
184
5.21 WNNs (Gaussian wavelet and MPSDFCM algorithm in predicting the blood glucose level at morning interval
199
6.1 (a) The scanned microarray image: RGB 211
xviii
6.1 (c) The scanned microarray image: Gridded 211
6.2 (a) Sum of pixel intensities: Across the row 212 6.2 (b) Sum of pixel intensities: Across the column 212 6.3 Principal steps in microarray image processing 213
6.4 An ideal microarray image 214
6.5 Fixed circle spot segmentation using ScanAlyze software 216 6.6 An example of pixel intensities for a spot within the mask 219
6.7 Edge detection of original Lenna image 229
6.8 Edge detection of Lenna image with Gaussian noise 229 6.9 Two-level wavelet decomposition on the benchmark Lenna
image
231
6.10 Block diagram for wavClust algorithm 232
6.11 (a) Perfect spot segmentation: Original image 236
6.11 (b) Perfect spot segmentation: WT 236
6.11 (c) Perfect spot segmentation: WT/KM 236
6.11 (d) Perfect spot segmentation: WT/FCM 236
6.11 (e) Perfect spot segmentation: WT/PSDKM 236
6.11 (f) Perfect spot segmentation: WT/PSDFCM 236
6.11 (g) Perfect spot segmentation: WT/MPSDKM 236
6.11 (h) Perfect spot segmentation: WT/MPSDFCM 236
6.12 (a) Irregular spot segmentation: Original image 236
6.12 (b) Irregular spot segmentation: WT 236
6.12 (c) Irregular spot segmentation: WT/KM 236
6.12 (d) Irregular spot segmentation: WT/FCM 236
xix
6.12 (f) Irregular spot segmentation: WT/PSDFCM 236 6.12 (g) Irregular spot segmentation: WT/MPSDKM 236 6.12 (h) Irregular spot segmentation: WT/MPSDFCM 236 6.13 (a) Weak spot segmentation: Original image 237
6.13 (b) Weak spot segmentation: WT 237
6.13 (c) Weak spot segmentation: WT/KM 237
6.13 (d) Weak spot segmentation: WT/FCM 237
6.13 (e) Weak spot segmentation: WT/PSDKM 237
6.13 (f) Weak spot segmentation: WT/PSDFCM 237
6.13 (g) Weak spot segmentation: WT/MPSDKM 237
6.13 (h) Weak spot segmentation: WT/MPSDFCM 237
6.14 (a) Sickle-shaped spot segmentation: Original image 237
6.14 (b) Sickle-shaped spot segmentation: WT 237
6.14 (c) Sickle-shaped spot segmentation: WT/KM 237 6.14 (d) Sickle-shaped spot segmentation: WT/FCM 237 6.14 (e) Sickle-shaped spot segmentation: WT/PSDKM 237 6.14 (f) Sickle-shaped spot segmentation: WT/PSDFCM 237 6.14 (g) Sickle-shaped spot segmentation: WT/MPSDKM 237 6.14 (h) Sickle-shaped spot segmentation: WT/MPSDFCM 237 6.15 (a) Scratched-shaped spot segmentation: Original image 239 6.15 (b) Scratched -shaped spot segmentation: WT 239 6.15 (c) Scratched -shaped spot segmentation: WT/KM 239 6.15 (d) Scratched -shaped spot segmentation: WT/FCM 239 6.15 (e) Scratched -shaped spot segmentation: WT/PSDKM 239 6.15 (f) Scratched -shaped spot segmentation: WT/PSDFCM 239
xx
6.15 (g) Scratched -shaped spot segmentation: WT/MPSDKM 239 6.15 (h) Scratched -shaped spot segmentation: WT/MPSDFCM 239 6.16 (a) Artifact spot segmentation: Original image 239
6.16 (b) Artifact spot segmentation: WT 239
6.16 (c) Artifact spot segmentation: WT/KM 239
6.16 (d) Artifact spot segmentation: WT/FCM 239
6.16 (e) Artifact spot segmentation: WT/PSDKM 239
6.16 (f) Artifact spot segmentation: WT/PSDFCM 239
6.16 (g) Artifact spot segmentation: WT/MPSDKM 239
6.16 (h) Artifact spot segmentation: WT/MPSDFCM 239 6.17 (a) Donut spot segmentation: Original image 240
6.17 (b) Donut spot segmentation: WT 240
6.17 (c) Donut spot segmentation: WT/KM 240
6.17 (d) Donut spot segmentation: WT/FCM 240
6.17 (e) Donut spot segmentation: WT/PSDKM 240
6.17 (f) Donut spot segmentation: WT/PSDFCM 240
6.17 (g) Donut spot segmentation: WT/MPSDKM 240
6.17 (h) Donut spot segmentation: WT/MPSDFCM 240
6.18 Comparative results of the proposed method with other existing spot segmentation approaches
xxi
LIST OF ABBREVIATION
AB After Breakfast
AD After Dinner
AL After Lunch
ALL Acute Lymphocytic Leukemia AML Acute Myelocytic Leukemia ANNs Artificial Neural Networks
AT/RT Atypical Teratoid/Rhabdoid Tumours
BB Before Breakfast
BD Before Dinner
BL Before Lunch
BLY Burkitt’s Lymphoma
BP Back-Propagation
BS Before Sleep
cDNA Complementary DNA
CG Classic Glioma
CNS Central Nervous System Embryonal Tumour CT Conditional T-Test Statistic
CWT Continuous Wavelet Transform
DM Diabetes Mellitus
DM1 Diabetes Mellitus Type 1 DM2 Diabetes Mellitus Type 2 DSL Distance Similarity Level DWT Discrete Wavelet Transform
ECG Electrocardiogram
EEG Electroencephalogram
EWS Ewing’s Sarcoma
ERR Error Criterion Function
FCM Fuzzy C-Means
FGMM Fuzzy Gaussian Mixture Model FWT Fast Wavelet Transform
xxii
FT Fourier Transform
GAs Genetic Algorithms
GLO Glioma
IGT Impaired Glucose Tolerance
KM K-Means
LEU Leukemia
MED Medulloblastoma
MG Malignant Glioma
MLPs Multilayer Perceptrons
MPSDFCM Modified Point Symmetry-Based Fuzzy C-Means MPSDKM Modified Point Symmetry-Based K-Means
MSE Mean Squared Error
NB Neuroblastoma
NC Normal Cerebellum
NG Non-classic Glioma
NGT Normal Glucose Tolerance
NNs Neural Networks
NT Night
OGTT Oral Glucose Tolerance Test OSL Orientation Similarity Level
PC Principal Component
PCA Principal Component Analysis PNET Primitive Neuroectodermal
PSD Point Symmetry Distance
PSDFCM Point Symmetry-based Fuzzy C-Means PSDKM Point Symmetry-based K-Means
RBFNNs Radial Basis Function Neural Networks
RMS Rhabdomyosarcoma
RMSE Root Mean Squared Error
SRBCT Small Round Blue Cell Tumours
SSL Symmetry Similarity Level
SVMs Support Vector Machines VPC Bezdek’s Partition Coefficient
xxiii
wavClust The Proposed Edge Detection Method WFT Windowed Fourier Transform
WHO World Health Organization WNNs Wavelet Neural Networks
WRBF Weighted Radial Basis Functions
xxiv
SUATU RANGKAIAN NEURAL WAVELET YANG DITAMBAH BAIK UNTUK PENGELASAN DAN PENGHAMPIRAN FUNGSI
ABSTRAK
Mereka bentuk rangkaian neural wavelet (RNW) dengan sebaiknya adalah penting untuk mencapai prestasi pengitlakan yang optimum. Dalam tesis ini, dua pendekatan yang berbeza dicadangkan untuk meningkatkan kemampuan peramalan RNW. Pertama, jenis fungsi pengaktifan yang digunakan dalam lapisan tersembunyi RNW adalah dipelbagaikan. Kedua, algoritma pengklusteran c-min kabur diperteguh yang dicadangkan—khususnya, algoritma c-min kabur berasaskan simetri titik terubah suai —digunakan dalam memilih lokasi vektor anjakan RNW. Kemudiannya, RNW terubah suai diaplikasikan dalam bidang pengelasan dan penghampiran fungsi. Dalam konteks pengelasan, RNW terubah suai dilaksanakan pada kanser heterogen dan pengelasan diabetes dengan menggunakan lima set data mikrosusunan yang berbeza. Keputusan eksperimen perbandingan menunjukkan bahawa metodologi yang dicadangkan mencapai hampir 100% ketepatan pengelasan dalam ramalan multikelas, yang mendorong pada prestasi superior dengan merujuk kepada algoritma pengklusteran lain. Perbandingan prestasi dengan pengelas lain juga dijalankan. Analisis penilaian menunjukkan bahawa pendekatan yang dicadangkan ini mengatasi prestasi kebanyakan pengelas lain. Dalam konteks penghampiran fungsi, RNW terubah suai diaplikasikan dalam penghampiran lima fungsi yang berbeza. Perbandingan prestasi menunjukkan penambahbaikan yang signifikan dalam ketepatan penghampiran melalui RNW yang dicadangkan. Seterusnya, perbandingan prestasi dengan kaedah lain dalam penghampiran fungsi sesecebis tanda aras yang sama juga dijalankan. Penilaian
xxv
menunjukkan kesuperioran pendekatan yang dicadangkan apabila dibandingkan dengan kaedah lain. Suatu kajian RNW yang dicadangkan dalam aplikasi dunia sebenar, iaitu dalam peramalan tahap glukosa darah bagi pesakit diabetes juga dikaji.
Suatu algoritma hibrid baru bagi pengesanan pinggir dibentangkan dalam tesis ini. Algoritma yang terhasil, yang dinamakan, wavClust, kemudiannya diaplikasikan dalam pensegmenan titik imej mikrosusunan. Perbandingan dengan kaedah pensegmenan titik klasik juga dijalankan. Jika dibandingkan dengan kaedah klasik, analisis penilaian menunjukkan bahawa algoritma wavClust yang dicadangkan mampu mensegmen dengan tepat semua bintik berbentuk donut, bintik tak sekata dan bintik dengan keamatan yang pelbagai dan jenis hingar yang berbeza.
xxvi
AN IMPROVED WAVELET NEURAL NETWORK FOR CLASSIFICATION AND FUNCTION APPROXIMATION
ABSTRACT
Properly designing a wavelet neural network (WNN) is crucial for achieving the optimal generalization performance. In this thesis, two different approaches were proposed for improving the predictive capability of WNNs. First, the types of activation functions used in the hidden layer of the WNN were varied. Second, the proposed enhanced fuzzy c-means clustering algorithm—specifically, the modified point symmetry-based fuzzy c-means (MPSDFCM) algorithm—was employed in selecting the locations of the translation vectors of the WNN. The modified WNN was then applied in the areas of classification and function approximation. In the context of classification, the modified WNN was implemented to heterogeneous cancer and diabetes classification using five different microarray datasets. The comparative experimental results showed that the proposed methodology achieved an almost 100% classification accuracy in multiclass prediction, leading to superior performance with respect to other clustering algorithms. Performance comparisons with other classifiers were made. An assessment analysis showed that this proposed approach outperformed most of the other classifiers. In the context of function approximation, the modified WNN was applied in approximating five different functions. Performance comparisons indicated significant improvement in the approximation accuracy was accomplished by the proposed WNN. Subsequently, performance comparisons with other methods in approximating the same benchmark piecewise function were made. Evaluation demonstrated the superiority of the proposed approach when compared with other
xxvii
methods. A study of the proposed WNN in a real-world application, i.e. prediction of blood glucose level for diabetics was also investigated.
A novel hybrid algorithm for edge detection was presented in this thesis. The resulting algorithm, namely, wavClust, was then applied in the microarray image spot segmentation. Comparisons with the classical spot segmentation methods were made. Assessment analysis showed that the proposed wavClust algorithm was able to segment all the donut-shaped spot, irregular spot and spots with intensity variations and different noise types accurately, compared to the classical methods.
1
CHAPTER 1 INTRODUCTION 1.1PRELIMINARIES
The invention of the abacus 2000 years ago is the starting point of the evolution of the computer. Simply using a wooden rack holding two horizontal strings with beads strung on them, basic arithmetic problems can be solved by moving the beads around, following the simple programming rules memorized by the user. A few centuries later, through further innovations and improvement, we have the invention of another wonderful machine: the computer. Life has never been the same since.
The advent of the computer is a blessing to the emergence of the artificial neural networks (ANNs). The study of the human brain dates back several centuries, inspired by the ways of how humans and living creatures struggle to survive in a challenging environment. The human brain possesses incredible characteristics. It is robust and fault-tolerant; able to adaptively adjust to new environments through learning; capable in dealing with diffused information; and able to process multiple sets of parallel information at the same time. Indeed, the human brain is amazing. It can recognize different faces, discern noise from music and differentiate various types of shapes. Thus, it is not surprising that the members of the scientific community endeavor to unlock its mystery. Although researches on the human brain have been ongoing for a long time, scientists have only recently been able to successfully simulate the thinking process of the human brain after the invention of the computer.
2
The aspiration of scientists to emulate the complex functions of the human brain has resulted in a new challenging research area, namely Artificial Intelligence, where ANNs are merely one of the facets of this interesting field. Attempting to preserve the desirable features of the human brain, mimicking its structures and understanding how it operates constitute the core development of ANNs.
An extensive understanding of the constituents and the manners in which the human brain processes information is crucial and necessary before constructing the building blocks of ANNs. Yet, the struggle to understand the exact workings of the human brain is not an easy task. The human brain is the most complex organism, made up of a biological nervous system of organized assembly of cells interconnected through synapses. Fortunately, in 1911, Ramón y Cajǎl came up with the idea of introducing “neurons” as the elementary structural components of the brain. His contribution has helped scientists better understand the secrets of the human brain (López et al., 2006).
It is believed that the human brain is composed of approximately 10 billion neurons. Each neuron can connect directly with up to 200,000 other neurons (though 1,000 to 10,000 is typical) (Gopal, 2009). The ability to think intellectually, to remember, to learn, and to experience sensations is attributed to the enormous number of neurons and the vast interconnections between them.
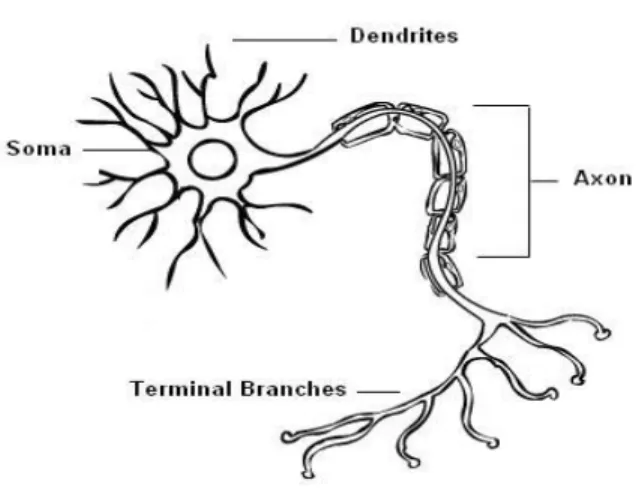
Basically, a biological neuron consists of four main components, namely, dendrites, soma, axon and the synapse. Soma forms the main body of a neuron. The dendrites of a neuron are hair-like filaments, which branch out from the soma. An axon is a long, slender projection that connects the soma with the terminal branches of the
3
axon. There are a number of synapses at the end of the terminal branches, which usually connect to the dendrites of the other neurons. The structure of a typical biological neuron is illustrated in Figure 1.1.
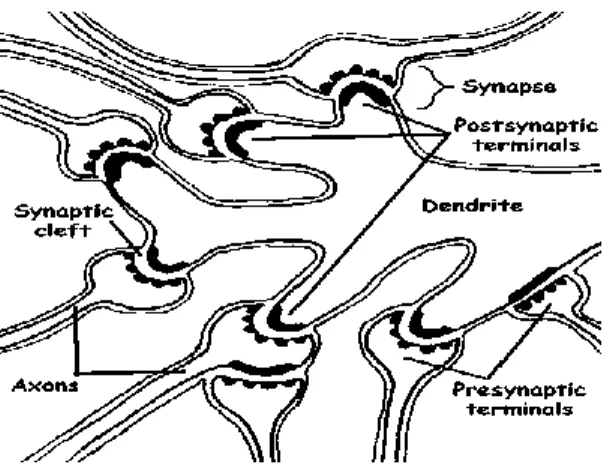
The nerve impulse transmission of a neuron starts at the dendrites. Dendrites, the receptive zone, collect signals from the other neurons. The signals are converted into electrical impulses and propagated away from the soma via the axon, the transmission line, until it reaches the synapses. At the synapses, communication with the other neurons occur (Figure 1.2).
At the synapses, the nerve impulse will be converted into electrical effects that cause either excitation or inhibition in the neuron which is connected to it. When a neuron sends an excitatory signal to the neuron it is connected to, this signal will be summed up with all the other inputs of that neuron. If it exceeds a given threshold, the target neuron will fire an action potential. If it is lower than the threshold, no action potential takes place.
4
Figure 1.2: Connection between the synapses and the dendrites of other neurons
In short, a biological neuron receives signals from other cells, perceives it and makes appropriate decisions. It combines the received signals in some way, performs a generally non-linear operation on the result of combination, and then outputs the final result to the other neurons.
An artificial neuron, which is the core processing element of an ANN, is a mathematical function that imitates how the biological neurons operate. The first artificial neuron model, developed by McCulloch and Pitts (1943) in 1943, is shown in Figure 1.3.
The flows of the neuron in the McColluch and Pitts model are similar to the processes involved in the biological neurons. The inputs received by the artificial neuron from the other neurons (representing the nerve impulses received by the dendrites) are weighted in order to modulate the strength of the input. The sum of the weighted inputs is then fed through a transfer function to generate an output signal, which is then fed into the other neurons. The transfer functions could be in the form of sigmoid functions, piecewise linear functions or step functions.
5
WW11
WN
W2
Figure 1.3: McColluch and Pitts model
Following McColluch and Pitts’s pioneering work, a series of great advances has arisen in the improvement of ANNs over the past few decades. The timeline for the brief history of the major development in ANNs is summarized in Table 1.1 (Haykin, 1999; Iyengar, 2002).
Table 1.1: Development of ANNs over the past few decades
Year Researchers Findings
1943 McColluch and Pitts The first artificial neuron was developed.
1949 Donald Hebb When a human learns a different task, the connectivity of the brain is changed continually. Based on the ways of how a human learns, the learning rule of the synaptic modification was proposed. It describes how the neural pathways are strengthened each time they are used, which is a concept identical to the learning process in the human brain.
1954 Marvin Minsky A classical paper entitled “Steps Toward Artificial Intelligence” was published, where a large section in this paper is now termed as neural network.
1958 Frank Rosenblatt A novel supervised learning method, named as perceptron convergence theorem was introduced.
Weights Input
Sum Threshold
6
Table 1.1: Continued
Year Researchers Findings
1960 Widrow and Hoff The least mean-square algorithm was formulated in the models of ADALINE and MADELINE. 1969 Minsky and Papert The declaration of the limitation of single layer
perceptrons was made, where it led to the inactive research period of ANNs.
1982 Hopfield The Hopfield model, which is a recurrent network with symmetric synaptic connections, was introduced.
1982 Kohonen A novel structure of ANNs, namely, self-organizing maps which uses a one or two dimensional lattice structure was proposed.
1986 Rumelhart, Hinton and Williams
The development of the back-propagation learning algorithm was reported.
1988 Broomhead and Lowe A single hidden layer of radial basis function neural network was developed.
1992 Vapnik The first support vector machine was invented. 1992 Zhang and Benveniste Wavelet neural networks (WNNs) are reported. Today With the dawn of the advances in the technology
today, the researches in ANNs are studied widely all around the world.
The following section provides an introduction to ANNs, and how the problems encountered in the typical ANNs inspire the formulation of WNNs. Next, the motivations for developing an improved WNN in this research are presented. This is followed by the research objectives, research scope and lastly, an overview of the organization of this thesis is given.
7
1.2INTRODUCTION TO ARTIFICIAL NEURAL NETWORKS
An ANN, or normally just referred as neural networks (NNs), is made up of interconnecting artificial neurons, which uses mathematical or computational models for information processing. A schematic diagram of an ANN with two hidden layers is given in Figure 1.4.
The basic component of an ANN is the artificial neuron. The combination of the artificial neurons forms a layer, namely, the input layer, the hidden layer and the output layer. As shown in Figure 1.4, every artificial neuron is connected to the succeeding layer, where there is a synaptic weight associated with each neuron.
Two important attention-grabbing characteristics of ANNs are (Haykin, 1999):
It possesses self-learning ability, and
It uses simple computational operations in reaching the solution for a highly complex, mathematically ill-defined and non-linear problems
8
Distinct from the computer systems which are only capable in doing the precised programmed instructions, the ANNs are able to classify the objects that it has never seen before into classes or even predict the future based on past experience. These fascinating characteristics are attributed to the learning ability of ANNs. Much like how humans learn from experience, ANNs also learn from examples. The learning of ANNs involves the adjustment of the synaptic weight connections that exist between neurons. It changes its network structure adaptively based on external and internal information that flows through the network during the learning phase.
For example, in the supervised learning method, a collection of samples are fed into the ANNs with predefined target output. After the learning phase, the output achieved from the ANNs is compared with the predefined target output. If the undesired output is obtained, the altering to the synaptic connection weight is made, such that the error within the network results and the target output is minimized.
It is not surprising that the ANNs with the property of massive parallel distributed structure and the ability to generalize reasonable output for the unseen data during the learning phase make it a suitable tool for solving large-scale problems where the physical processes are highly complex and ill-defined. Furthermore, there are difficulties in solving the problems that do not have an algorithm solution or the solution is too complex to obtain by using the conventional methods. This is where the ANNs play its role.
ANNs outshine other conventional approaches due to its adaptive learning capability. During the learning phase, an ANN learns the underlying relationship
9
between the input and output data. It has been found that, an ANN provides correct solutions even though the input data is contaminated by noise, when properly trained (Juang et al., 2009). ANNs perform excellently in pattern recognition and classification problems where correct decisions are being made when the imprecise input data are present.
Due to its fascinating features of robustness, fault tolerance, adaptively learning and highly parallel capabilities, ANNs have been implemented extensively in our daily life (Adeli and Panakkat, 2009; Adjeroh et al., 2006; Balasubramanian et al., 2009; Crone and Kourentzes, 2010; Du, 2010; Ebrahimzadeh and Ranaee, 2010; Emili et al., 2008; Huang and Wu, 2008; Jiao, 2010; Juan and Julian, 2006; Kim and Cho, 2006; Lee, 2008; Lee and Ko, 2009; Li et al., 2009; Lin and Hsieh, 2009; Lu, 2010; Melin et al., 2008; Pajares et al., 2010; Suk et al., 2010; Sun and Tien, 2008; Übeyli, 2008; Übeyli, 2009; Wang et al., 2009).
The applications of the ANNs fall within the following broad categories:
a. Function approximation and regression analysis, including the time series prediction and modeling
b. Classification, including pattern recognition and decision making c. Data processing, including data compression, filtering and clustering
The implementations of ANNs in the real-world problems can be discriminated further into more detailed areas of application. Some examples of the specific paradigm are given for each area:
10 a. Finance and Commerce
Forecasting of stock price index
Forecasting the exchange rate b. Medical
Classification of heterogeneous cancer subtypes
Denoising and compression of medical image
Classification of EEG signals c. Environment
Prediction of the pollutant concentrations
Forecasting of the storm surge at the costal line d. Pattern Recognition
Face recognition
Handwriting recognition
Fingerprint recognition e. Engineering
Fault detection and diagnosis
Control system
1.3PROBLEM STATEMENT
Accuracy is seen as important by everyone, in every aspect, in view of the fact that it is always correlated with the decision-making. For example, when the heterogeneity of cancer could not be differentiated through its morphological appearance, classification of the heterogeneous cancer accurately is tremendously crucial, since a correct
11
classification enables the maximizing of efficacy and minimizing of toxicity in the therapy. Since numerous application problems are highly dependent on the accuracy of the ANNs, improving the prediction and approximation accuracy of the ANNs is the main concern of this thesis.
To date, multilayer perceptrons (MLPs) (Ghate and Dudul, 2010; Haykin, 1999; Hornik et al., 1989; Zainuddin and Ong, 2007), support vector machines (SVMs) (Huang and Wu, 2008; Peng et al., 2003; Polat et al., 2008; Shim et al, 2009; Xian and Zeng, 2009; Xu et al., 2009; Zhang et al., 2006), radial basis function neural networks (RBFNNs) (Balasubramanian et al., 2009; Broomhead and Lowe, 1900; Lee and Ko, 2009; Moody and Darken, 1989) and fuzzy neural networks (Dazzi et al., 2001; Juang et al., 2009; Othman and Yao, 2007; Polat and Günes, 2007;) are some of the popular ANNs that have been implemented successfully in a vast variety of applications. Even though MLPs along with the backpropagation learning algorithm are the most popular type of ANNs for practical situations, the deficiencies of a MLP’s multilayer structure and its use of a global activation function and a slow learning algorithm have limited its use in practice. Specifically, MLPs have difficulties reaching the global minimum in a complex search space, are time-consuming and fail to converge when high nonlinearities exist; these issues have deteriorated their generalization capability to achieve superior accuracy (Lin and Tsai, 2008; Yao et al., 1996; Zainuddin and Ong, 2010). Apart from that, there are issues that remain unresolved in selecting the appropriate centers for RBFNNs (Liao, 2010; Staiano et al., 2006; Zainuddin and Lye, 2010), membership function for fuzzy neural networks (Hsu et al., 2008) and kernels for SVMs (Chen et al., 2007; Ju at al., 2009; Kazuhiri, 2008; Wu, 2010).
12
WNNs, as one of the facets of ANNs research filed, had been introduced by Zhang and Benveniste as a vital alternative to MLPs that overcome their shortcomings (Zhang, 1997; Zhang and Benveniste, 1992) where it differs from other ANNs with the constitution of the wavelet activation function in the hidden nodes. They had proven that the proposed WNNs possess the eye-catching uniqueness of (Zhang and Benveniste, 1992):
It preserves the universal approximator property
Explicit link exists between the network coefficients and wavelet transform
It achieves the same quality of approximation with a network of reduced size
Due to the advantages of WNNs as universal approximators, the fact that they have more compact topology than other neural networks and their fast learning speed owing to the constitution of the localized wavelet activation function in the hidden layer, WNNs had received much attention from other researchers and have been used extensively to solve numerous real world problems such as face recognition, time-series prediction, pattern classification and system identification (Alan et al., 2006; Avci, 2007; Becerra et al., 2005; Biswal et al., 2009; Cao et al., 2010; Chaohan et al., 2009; Cui et al., 2005; Gutés et al., 2006; Kumar et al., 2008; Lin, 2009; Pan et al., 2008; Subasi, 2005; Zainuddin and Ong, 2010).
Various issues have been addressed in the WNNs studies, which include adjusting the connection weights by employing different learning algorithms for accelerating the convergence of WNNs (Chen et al., 2006; Lin and Tsai, 2008; Yao et al., 1996; Zhang, 2007), making alterations in the network architecture (Wan et al.,
13
2004), introducing variation in the types of activation functions used in the hidden layer (Mohd Idris et al., 2009; Wajdi et al., 2005, Zainuddin and Ong, 2007), and modifying the wavelet function parameters, a process that involves proper initialization of the translation and dilation vectors (Lin, 2009; Oussar and Dreyfus, 2000; Zhang et al., 2006). In this thesis, optimizing the convergence characteristic and improving the generalization ability of WNNs by emphasizing the choice of a proper wavelet family as the activation functions in the WNNs hidden layer and proper initialization of translation vectors are the main concern.
There is heightened understanding that selecting the appropriate activation function in hidden layer is as crucial as the neural network architecture and learning algorithm (Dutch and Jankowski , 1999; Gougam et al., 2008). Being the first proposed activation function, it had been proven in the universal approximation theorem that a single hidden layer feedforward neural network with sigmoid activation functions can approximate any continuous, multivariate function to any desired degree of accuracy with a finite number of neurons (Cybenko, 1989). However, the main limitation of sigmoid functions is that they span over the whole input space. The alteration of the weight vectors and other parameters involves all the activation functions, and thus its training is time-consuming, and unavoidably, it achieves much more exploration errors. As opposed to the popular sigmoid activation functions, wavelets in hidden layer respond only to a local region of the space of input values. Due to its fast-decaying characteristic in a short finite length interval, fewer non-negligible coefficients are generated. Thus, modification on the weight vectors involves only a small number of parameters and as a result it leads to fast convergence characteristic and generalization
14 capability (Oysal et al., 2005).
Systematic investigation on the suitability of employing various wavelets as the activation functions (for example, B-spline wavelet, Gabor wavelet, Gaussian wavelet, Mexican Hat, Morlet and Shannon wavelet (Banakar and Azeem, 2008; Chaohan et al., 2009; Cui et al., 2005; Esen at al., 2009; Krüger and Sommer, 2002; Lin et al., 2008; Wang et al., 2005;)) for WNNs in the literature showed its feasibility and validity. However, there is no a priori explanation on why they should be the most favorable in all situations. Simulation results are highly relied on the network architecture, learning algorithm, parameter initialization, and also on the dataset used. Unfortunately usually the essential attributes of the dataset is unknown and vary for different problems, a wavelet activation function that is well-suited for all the cases does not exist. The choice of the wavelet families is problem-dependent (Mohd Idris et al., 2009; Zainuddin and Ong, 2007, Zainuddin and Ong, 2010). Since there is no established rule of thumb in determining which particular wavelet to be employed as the activation function, this research hopes to make some suggestions.
WNNs update their connection weights and parameters iteratively through learning. During the learning process of a WNN, the selection of the numbers and the locations of the translation vectors are particularly crucial. An appropriate initialization of the translation parameter will do a good job of reflecting the essential attributes of the input samples, which is important for finding an optimal solution. Increasing the number of hidden nodes leads to over-fitting and computational complexity. Thus, assigning an appropriate number of hidden nodes simplifies the process.
15
Several approaches have been suggested in choosing the appropriate WNNs translation vector, including using an explicit expression (Cao and Lin, 2008; Cao et al., 2010; Cui et al., 2005; Gutés et al., 2006; Gutiérrez et al., 2008; Lin, 2009; Oussar and Dreyfus, 2000; Srivastava et al., 2005; Zhang et al., 2004), hierarchical clustering (Wei et al., 2004), SVMs (Zhang et al., 2006), genetic algorithms (GAs) (Kim et al., 2002) and k-means clustering (Hwang et al., 2000). Although such improvements are certainly noteworthy, initializing the translation vector is always an open question. Therefore, a novel clustering algorithm—the modified point symmetry-based fuzzy c-means (MPSDFCM) was proposed in this study—as an alternative to the existing WNNs translation parameter initialization approaches.
1.4OBJECTIVES OF THESIS
The main thrust of this research is geared towards an improved WNN model, incorporating the MPSDFCM algorithm and different wavelet activation functions, for prediction purposes as well as pattern classification.
The objectives of this thesis are as follows:
To implement different types of activation functions in WNNs for the purpose of improving its generalization ability
To develop and apply a novel method in the parameter initialization of WNNs for the purpose of optimizing its generalization ability
To assess the potential benefits of the proposed enhanced WNNs in heterogeneous cancer detection and blood glucose concentration prediction
16
To develop and implement a new scheme in edge detection based on the hybridization of wavelet transform and clustering algorithm
1.5 SCOPE AND ORGANIZATION OF THESIS
The scope of this research studies the development of an improved WNN model. Particular focus is placed on the translation parameter initialization using MPSDFCM algorithm, and the choice of wavelet activation function in the hidden nodes. The effectiveness of the proposed WNNs with MPSDFCM initialization method in the context of function approximation and classification is examined through empirical approaches, with simulated as well as real-world dataset. The applicability of the proposed WNNs is extended to practical applications in bioinformatics, which include the real-world medical diagnosis, in the domain of heterogeneous cancer classification and the prediction of blood glucose concentration for a diabetic.
The thesis will begin with Chapter 1 with an introduction to the evolvement of ANNs and its development history. The characteristics of the ANNs are explored and examples on its implementation in real-world applications are given. The objectives, scope and organization of this thesis are then described.
Chapter 2 will provide a review of WNNs, which begins with an introduction to wavelet and wavelet transform. The preface for architecture, learning algorithm and parameter initialization of WNNs are given. Its competence is briefly touched on. The characteristics of the WNNs are reviewed and the need to enhance the WNNs from different aspects is then explored. Implementation of WNNs in the real-world applications is then given.
17
A review of the cluster analysis is given in Chapter 3. It begins with the introduction to the classical clustering algorithms, and this is followed by the exploration of their pro and cons. The concept of point symmetry distance (PSD) is introduced, and its improvement over the conventional clustering algorithm is then explored. The merit of a novel operator, i.e. symmetry similarity level (SSL) operator is then described. Motivated by the SSL operator, a novel clustering algorithm- specifically, the modified point symmetry-based fuzzy c-means (MPSDFCM) algorithm is proposed. The description and the implementation of the proposed MPSDFCM, which is the core of this thesis is then given.
Chapter 4 will begin with an overview of the microarray experiment. The research background is then provided, and it will lead to the need of developing an enhanced classifier to address the problems in multiclass cancer classification. Its implementation in the heterogeneous cancer classification using benchmark microarray dataset was studied. Assessment analysis of the proposed enhanced classifier with other well-developed classifiers is then presented. It will be shown that the modification on the WNNs improves its prediction capability effectively and significantly.
The enhancement of the WNNs approximation capability sets the tone for Chapter 5. The proposed WNNs are applied in function approximation problems, where different types of functions are studied. Evaluations by varying types of activation function and initialization approach in terms of mean squared error are made. A real world application, i.e. prediction of blood glucose level for diabetics is then explored. The capability of the proposed WNNs in approximating the blood concentration at the
18
end of interval is assessed further, by comparing its prediction accuracy with other popular ANNs.
Edge detection is one of the main concerns in image analysis. The image quality issue in the microarray experiment needs more improvement. Chapter 6 will begin with an introduction for microarray image analysis. It is followed by a brief review on the edge detection based on the wavelet approach. A new scheme of edge detection with hybridization on the wavelet and clustering algorithm is then proposed. Its implementation in microarray spot segmentation is studied. Comparison of the segmentation results with other existing segmentation method will round up this chapter.
Finally, refinements on WNNs and edge detection are proposed for future research direction. A brief elucidation on recommendations for further research and conclusions of this research work will conclude the thesis. Further details and images are provided as Appendices.
19
CHAPTER 2
WAVELET AND WAVELET NEURAL NETWORKS 2.1 INTRODUCTION
Wavelet analysis has been studied rigorously in a number of disciplines in mathematics, quantum physics and electrical engineering over the past few decades. These active researches have led to the emergence of wavelet as one of the fastest growing fields with vast new applications, ranging from image compression, voice recognition to earthquake prediction. Owing to its fascinating characteristics such as fast-decaying, compact support, smooth and regular, wavelet has been substituted as the activation function in the WNNs, which greatly overcomes the shortcomings in MLPs.
In this chapter, the fundamental aspects of wavelet analysis and WNNs will be reviewed in a number of sections. Specifically, this chapter begins with an overview of the wavelet. The ideas behind discrete wavelet transform (DWT), with the discussion on its improvements over the Fourier transform (FT), windowed Fourier transform (WFT) and continuous wavelet transform (CWT) is presented. Next, we proceed to the brief review of the DWT in a vast variety of practical applications. In the second section, an overview of the theory of WNNs, which includes the architecture design, learning process and parameter initialization of a WNN, is given. Finally, a literature study on the implementation of WNNs in numerous real-world problems is presented at the end of this chapter.
20
2.2 INTRODUCTION TO WAVELET
The word wavelet, originates from French word ondelette which means “small wave”, was introduced by Morlet and Grossman in 1980. The term “small” here refers to the condition that the wavelet function is of finite length, which means compactly supported, whereas the term “wave” implies that the function is oscillatory.
A wavelet is a kind of mathematical function that satisfies certain requirements, such as integrates to zero, oscillates and well localized in time. It is used to represent other functions by cutting it into different frequency components, and then study each component with a resolution that matches its scale. Thus, it has the ability to allow the time and frequency analysis simultaneously, which makes it a suitable tool for studying the transient, non-stationary and time-varying signals.
A wavelet is not identical to a wave. A wave is an oscillating function of time and it is periodic. In contrast, wavelets are localized waves. An example of a wavelet and a wave (sinusoid) is shown in Figure 2.1.
(a) (b)
21
It can be observed that a wavelet has the oscillating wave-like characteristic like a wave (sinusoid). Waves are smooth and regular, but wavelets are irregular and might be asymmetric in shape. Unlike sinusoid which oscillates with equal amplitude from minus to plus infinity, wavelet has a finite length and it decays quickly toward zero when their limits approach minus to plus infinity. Therefore, wavelets have finite energy which concentrates around a point.
Wavelets are generated from a finite-length or fast-decaying oscillating mother wavelet , with an average value of zero
(2.1)
The family of functions can be obtained by shifting and scaling of this mother wavelet as
(2.2)
where and b are scaling and translation parameters,
is energy normalization so that the transformed signal will have the same energy across the scales. The mother wavelet gets its term “mother”, since the functions with different support regions in the transformation process are generated from it. Thus, mother wavelet is the prototype for deriving other window functions, with different values of scaling and translation parameters.
A wavelet function must satisfy the admissibility condition in order for it to be the mother wavelet. A wavelet function is said to be admissible if its Fourier Transform, namely
22
(2.3)
satisfies the admissibility condition
(2.4)
2.3 PROPERTIES OF WAVELETS
There are some important properties of wavelets that make it a useful tool in real world applications.
Vanishing Moment: A wavelet function is said to have p vanishing moments, if (2.5)
If a wavelet function has larger vanishing moments, the wavelet coefficients of a function are much smaller on a larger scale j, where this wavelet is said will have more compressive power.
Regularity: The regularity of a wavelet function is related to the vanishing moments. To have regularity more than n, must has at least n+1 vanishing moments. Hence, the more regularity of a wavelet, the more vanishing moments it has, and the smoother it is.
Smoothness: The smoothness of a wavelet function is determined by the number of vanishing moments, where the smoother a wavelet function is, it has a better reconstruction property. A smoother wavelet function will have fewer non- negligible wavelet coefficients, which means that it produces a large number of wavelet
23
coefficients that are close to zero, which is essential for noise removal and image compression.
Compact Support: The compact support of a wavelet function is the maximal interval of which the wavelet function vanishes outside of this finite interval. If the size of the compact support is smaller, there are fewer of the high amplitude wavelet coefficients.
Symmetry: Symmetry is also called as linear phase in the language if engineering, which is an important characteristic in image processing, where a wavelet which is symmetric in shape produces less visual artifacts than an asymmetric wavelet. The absence of this property can lead to a phase distortion.
2.4 A BRIEF HISTORICAL PERSPECTIVE OF WAVELETS
Pre-1930
Notable contribution to the development of wavelet analysis first originated from Alfred Haar’s work in the early of 20th century, where the Haar wavelet function was first mentioned. Haar wavelet has compact support; however it is not continuously differentiable, where this shortcoming somewhat limits its applications (Burrus, 1998; Eugenio, 1996; Holschneider, 1995).
The 1930s
After Haar’s contribution to wavelets, Paul Levy (1930) discovered that a Haar basis function is a better tool than Fourier basis functions when dealing with the small details in Brownian motion.
24
Post 1980
The next major advancement of wavelets comes from Jean Morlet and Alex Grossman in the year 1981. They found that a signal can be transformed into wavelet forms and then be reverted back into its original signal without loss of information. This property contributes greatly in data compression, where making a small change in the wavelets will cause a small change in the original signal.
Stephane Mallat (Mallat, 1989) continued the work on wavelet analysis by discovering the relationships between the quadrature mirror filters and pyramid algorithms, laying the foundation to the fast wavelet transform (FWT).
The idea of multiresolution analysis of wavelets which was a big jump in the research of wavelet analysis comes from Yves Meyer and Stephane Mallat (Mallat, 1989). The idea of looking at a signal at different scales of resolution is beneficial to the next important discovery by Ingrid Daubechies. The final great salvo in wavelet analysis happened at around 1988, where Ingrid Daubechies created a new family of wavelets, called Daubechies wavelets, by using the idea of multiresolution analysis. Daubechies wavelet families are both continuously differentiable and have compact support. These properties have made it the keystone in wavelet applications today.
The development of wavelet analysis is highly related to the Fourier transform (FT). Before the emergence of wavelet analysis, there are vast applications of FT in signal analysis. However, there are certain shortcomings in FT in addressing the non-stationary signals. To overcome these drawbacks in FT, development of wavelet analysis which takes hints from Fourier analysis appeared as a better resolution than FT in signal processing.