Kempenaar, C.
1a, Lokhorst, C.
1b, Bleumer, E.J.B.
1b, Veerkamp, R.F.
1b,
Been, Th.
1a, Evert, F.K. van
1a, Boogaardt, M.J.
1c,Ge, L.
1c, Wolfert, J.
1c,
Verdouw, C.N.
1c, Bekkum, M.A. van
2, Feldbrugge, L.
2, Verhoosel,J.P.C.
2,
Waaij, B.D. van der
2, Persie, M. van
3, and Noorbergen, H.
3Report 655
Date: 1 september, 2016
Big data analysis for smart farming
Results of TO2 project in theme food security
1 Wageningen University & Research (a WPR, b WLR & c LEI) 2 TNO
Wageningen University & Research, Wageningen Plant Research,
Business Unit Agrosystems Research
Address : P.O. Box 616, 6700 AP Wageningen, The Netherlands
: Wageningen Campus, Droevendaalsesteeg 1, Wageningen, The Netherlands Tel. : +31 317 48 04 98
Fax : +31 317 41 80 94 E-mail : [email protected] Internet : www.wageningenUR.nl/en/pri
Table of contents
page Preface 1 Summary 2 1. Introduction 7 1.1 Rationale 71.2 Precision farming and smart agri-food chains 7
1.3 Big data technology 8
1.4 Objectives, approach and report structure 9
2. Literature study 11 2.1 Introduction 11 2.2 Methodology 11 2.3 Conceptual framework 12 Farm processes 13 2.3.1 Farm management 13 2.3.2 Data chain 14 2.3.3
Network management organization 14
2.3.4
Network management technology 15
2.3.5
2.4 Results 15
Drivers for Big Data in Smart Farming 15
2.4.1 Business processes 16 2.4.2 Stakeholder network 19 2.4.3 Network management 20 2.4.4 Challenges 22 2.4.5
2.5 Conclusions and recommendations 22
3. Description of a dairy farm case 25
3.1 Introduction 25
3.2 Case: Estimation of feed efficiency of individual dairy cows 25
4. Semantics and linked data 28
4.1 Linked data and ontologies 28
Linked data, big data, open data 28
4.1.1
The essence of Linked Data 29
4.1.2
Ontologies: engineering Linked Data 31
4.1.3
4.2 Application to the use case 31
Ontology matching approach 31
4.2.1
Triplification, triple stores and SPARQL queries 33
4.2.2
4.3 Insights 35
5. Analysis with Machine Learning methods 36
5.1 Introduction 36
5.2 Data description 36
Dairy Campus data 36
5.2.1
KNMI data 37
Artificial Neural Networks 37 5.3.1
Support Vector Machines 38
5.3.2
Comparison 39
5.3.3
5.4 Approach feed intake prediction 39
Data inspection 39
5.4.1
Data cleaning 42
5.4.2
Initial parameter determination 43
5.4.3
Data set division 44
5.4.4
Model setup 44
5.4.5
Fine-tuning the model 45
5.4.6
Input investigations 46
5.4.7
5.5 Results 46
5.6 Insights in machine learning techniques for analysis 48
6. Remote sensing based grass growth analysis 49
6.1 Introduction 49
6.2 Source data 49
Dairy Campus grazing experiment 49
6.2.1 Satellite data 50 6.2.2 UAS recordings 51 6.2.3 Field measurements 51 6.2.4
Overview of all measurements 52
6.2.5
6.3 Remote sensing based grass growth monitoring 52
Principle 52
6.3.1
Vegetation index measurement 52
6.3.2
Vegetation index in relation to grass harvest weight 55
6.3.3
Vegetation index in relation to grass growth 57
6.3.4
UAS based height measurement 61
6.3.5
UAS based height in relation to grass growth 64
6.3.6
6.4 Big Data technologies 66
6.5 Conclusions and recommendations 66
7. Dairy Campus ICT infrastructure for the dairy farm case 68
7.1 Introduction 68
7.2 Data infrastructure Dairy Campus 68
7.3 Data for the dairy farm case 69
Animal selection 69 7.3.1 Output 69 7.3.2 Input 69 7.3.3 Data availability 69 7.3.4
7.4 Internet access and expected infrastructure 72
8. General discussion and insights 74
1
Preface
New technologies become available to support agro and food production. New concepts like Smart Farming are driving innovations and the way we work together. Also research has to adapt and be aware what these new technologies, like Big Data and Internet of Things, and new concepts can bring them. There is an increasing need for cooperation according triple helix concepts and multidisciplinary research to tackle complex issues. The basis for this project is coming from the idea of the Ministry of Economic Affairs who would like to stimulate TO2 institutes to work more together. We thank the ministry to support the creation of an arena where the TO2 institutes DLO, TNO and NLR could work together and explore the field of BigData and concepts like Smart Farming.
Summary
In this report we describe results of a one-year TO2 institutes project on the development of big data technologies within the milk production chain. The goal of this project is to ‘create’ an integration platform for big data analysis for smart farming and to develop a show case. This includes both technical (hard/software) and organizational integration (developing business ecosystem) and combining and linking of data and models. DLO, NLR and TNO worked together in 2015 towards the realization of an IT data infrastructure that makes it possible to solve to connect data from different sources and models in an effective and safe way, ontology problems, specific analysis tools develop, opportunities and risks to identify and assess the acquired knowledge and experience and present it in a smart farming show case, from 'grass to glass‘.
In the project we combine domain specific databases with generic ICT- tools and -infrastructure. A data transfer agreement was agreed upon the use of data in the project and to safeguard IP of third parties. NLR contributed data and expertise on (analysis of) satellite and drone data to the project. WLR and PRI contributed domain knowledge, databases (e.g. on genotype and phenotype of cows, feed uptake, milk production and crop management) and models, LEI contributed socio-economic expertise on big data, and TNO provided expertise on ICT-infrastructure, data
protection, ontology (in cooperation with PRI and WLR) and analysis tools.
The project was organised in work packages: (1) literature study on big data and smart farming that is relevant to the project, (2) case definition plus outline of big data research questions and required data-infrastructure, (3) semantics, ontology and Linked Open Data (LOD), (4) analysis tools, and (5) synthesis plus answering of the research questions.
(1) Literature study on big data and smart farming that is relevant to the project
For the literature research a conceptual framework (see figure) was used to analyse both scientific and some grey literature. Based on the findings from the literature review several conclusions can be drawn on the state-of-the-art of Big Data applications in Smart Farming. First of all, Big Data in Smart Farming is still in an early development stage. This is based on the fact there are only limited scientific publications available on this topic and much information had to be derived from ‘grey literature’.
What role does Big Data play in Smart Farming?
Big Data is changing the scope and organisation of farming through a pull-push mechanism. Global issues such as food security and safety, sustainability and as a result efficiency improvement are tried to be addressed by Big Data applications. These issues make that the scope of Big Data applications extends far beyond farming alone, but covers the entire supply chain. The Internet of Things development, wirelessly connecting all kind of objects and devices in farming and the supply chain, is producing many new data that are real-time accessible. Analytics is a key success factor to create value out of these data. Many new and innovative start-up companies are eager to sell and deploy all kind of applications to farmers of which the most important ones are related to sensor deployment, benchmarking, predictive modelling and risk management.
What stakeholders are involved and how are they organized?
There are first of all the traditional players in agriculture such as input suppliers and technology suppliers for which there is a clear move towards Big Data as their most important business model. Most of them are pushing their own platforms and solutions to farmers, which are often proprietary and rather closed environments although a tendency towards more openness is observed. This is stimulated by farmers - organized in cooperatives or coalitions - that are concerned about data privacy and security and also want to create value with their own data or at least want to benefit from Big Data solutions. Beside the traditional players we see that Big Data is also attracting many new entrants which are often start-ups supported by either large private investors or large ICT or non-agricultural tech companies. Also public institutions aim to open up public data that can be combined with private data. These developments raise issues around data ownership, value of data and privacy and security. The architecture and infrastructure of Big Data solutions are also significantly determining how stakeholder networks are organized. On the one hand there is a tendency towards closed, proprietary systems and on the other hand towards more open systems based on open source,
3
standards and interfaces. Further development of Big Data applications may therefore likely effect two supply chain scenarios: one with further integration of the supply chain in which farmers become franchisers; another in which farmers are empowered by Big Data and open collaboration and can easily switch between suppliers, share data with government and participate in short supply chains rather than integrated long supply chains.
What are the expected changes that are caused by Big Data developments?
Big Data will cause major changes in scope and organization of Smart Farming. Business analytics at a scale and speed that was never seen before will be a real game changer, continuously reinventing new business models. It can be expected that farm management and operations will drastically change by access to real-time data, real-time forecasting and tracking of physical items and in combination with IoT developments in further automation and autonomous operation of the farm. It is already visible that Big Data will also cause major shifts in power relationships between the different players in the Big Data farming stakeholder network. The current development stage does however not reveal yet towards which main scenario Smart Farming will be developed.
What challenges need to be addressed in relation to the previous questions?
o Data ownership and related privacy and security issues – these issues have to be properly addressed, but when this is applied too strictly it can also slow down innovations;
o Data quality - which has always been a key issue in farm management information systems, but is more challenging with big, real-time data;
o Intelligent processing and analytics – for Big Data this is also more challenging because of the large amount of often unstructured, heterogeneous data which requires a smart interplay between skilled data scientists and domain experts;
o Sustainable integration of Big Data sources – integration of many different data sources is challenging but because this is crucial for your business model this has to be done in a sustainable manner;
o Business models that are attractive enough for solution providers but that also enable a fair share between the different stakeholders;
o Openness of platforms that will accelerate solution development and innovation in general but also empower farmers in their position in supply chains.
The promise of Big Data in agriculture is alluring, but the challenges above have to be addressed for increased uptake of Big Data applications. Although there are certainly technical issues to be resolved we recommend to focus first on the governance issues that were identified and design suitable business models because these are currently the most inhibiting factors.
(2) Case definition plus outline of big data research questions and required data-infrastructure
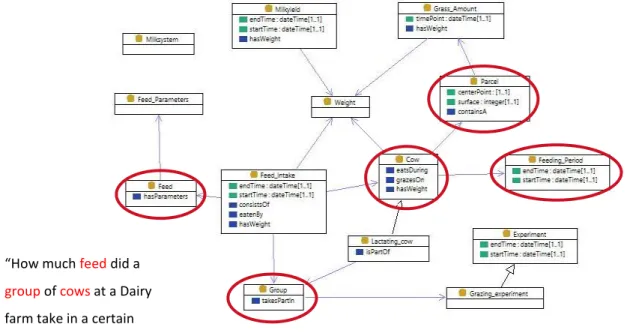
The dairy case that was formulated was based on the question ‘Is it possible to provide genotypic and phenotypic data to estimate the overall feed efficiency of dairy cows?’. The motivation is that feeding costs are a major part of the total costs for the production of milk. Feeding of milking cows consist general of grass, roughage, concentrates and additives. Most detailed information on cow level is known on concentrates. Grass and roughage intake are poorly available and only on group level. So present feed efficiency is based on concentrate efficiency. Feeding efficiency of all feeding components together is getting more and more important to realize an optimal milk production. With the end of the milk quota in 2015 dairy farming is now more soil-based. Therefore emphasis will be on maximizing milk
production given the limited availability of land (and thus grass and roughage). The grass and roughage should be used without wasting. Animal behaviour that implies wasting of feeding should be avoided as much as possible. Therefore in this case we are interested in estimation of feed efficiency for all feed components. The Dairy Campus was used as experimental environment and historical data and infrastructure and observations in 2015 were used in this project. For the data infrastructure of Dairy campus some advices were formulated.
(3) Semantics, ontology and Linked Open Data (LOD)
Theoretically insight are presented on the following aspects of data sets that can be: - Big: the extent to which data has volume, variety, velocity, veracity. - Open: the extent to which data is reusable to others.
- Linked: the extent to which data is accessible (linkable) to other data.
Open data is data that “can be freely used, reused and redistributed by anyone. This means that data can be published and can be made publicly available under an open licence without necessarily linking it to other data sources. Linked Data on the other hand, can be linked to URIs from other data sources, using open standards such as RDF without necessarily being publicly available under an open licence. Both types of data may concern big data sets, but of course
this does not have to be the case. Organizing the data and enrich it by adding additional meaning, is the engineering or modelling part of Linked Data. Modelling makes the data more widely understandable and usable both within and across organizations. When creating linked data, one should employ proper engineering practices in order to create datasets of high quality that possibly make use of existing resources on the Web rather than creating them from scratch, and express the intended semantics correctly so that others (both machines and humans) can properly understand and reuse the datasets. Ontologies are a way to making a conceptual model of the data: they are “used to refer to a shared understanding of a domain of interest”. An ontology embodies a view of the domain of interest expressed in terms of concepts, their definitions in terms of properties and their inter-relationships. An ontology may take a variety of forms, but necessarily it will include a vocabulary of terms and some specification of their meaning (i.e. definition).
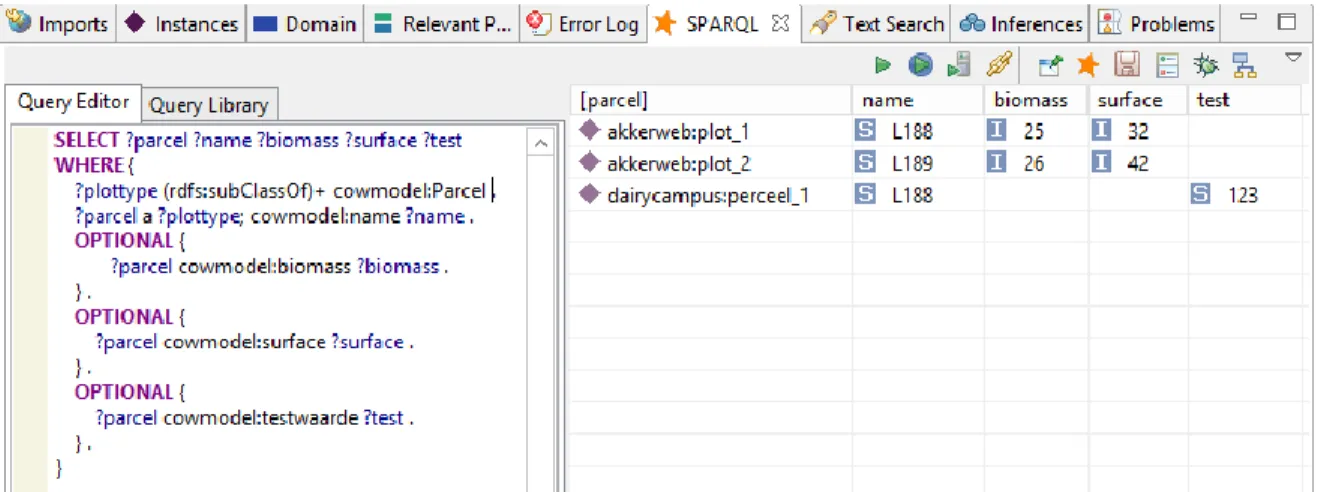
Data from Dairy Campus and Akkerweb were used to explore these different concepts. Summarizing, farmers can pose questions in terms of the concepts in our common ontology instead of the detailed and specific concepts of the Dairy Campus and Akkerweb data sources. The approach is in an experimental phase. We have reached a set-up by filling the triple stores for 3 farms with cow-data of 1 month which adds up to a total of 7 million triples.
(4) Analysis tools Roughage intake
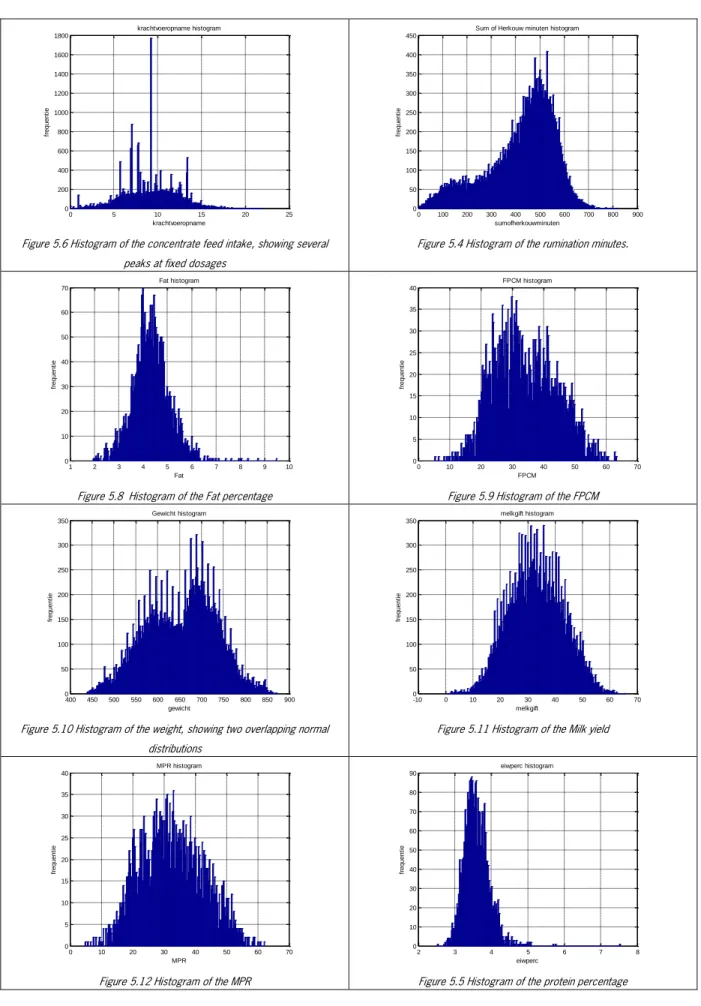
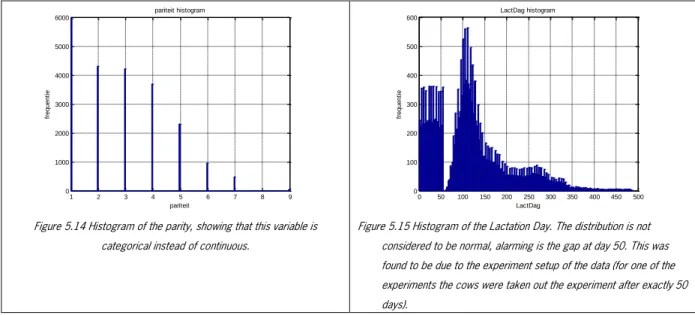
In a world where data is growing, the analysis of data moves from traditional methods to ‘big data’ methods, like data mining and machine learning. In this project we are focusing on modelling a complex process using machine learning techniques. The fields of statistics and machine learning are converging. Where data mining focuses on exploring data, finding correlations that are not apparent with traditional techniques, machine learning focuses on modelling the data, and learning it’s patterns. Machine learning algorithms use large amounts of data to learn algorithms that are able to predict the data. In general they require much more data than standard statistical techniques (since no pre-assumptions about the model are being made). An expected advantages of machine learning techniques is that the amount of domain knowledge required is minimal and that the resulting models (when set up and validated correctly) can model very complex (nonlinear) systems. Because it is possible to model non-linear systems, the models are good at generalizing new data points (inter and extrapolating). There are numerous machine learning algorithms available to choose from. We used a Dairy campus dataset, added KNMI data and we experimented with setting up an Artificial Neural Network. We were able to construct an effective machine learning model to predict the roughage intake of cows. We are able to predict this with a precision of approximately 7.6%. This means that we are able to predict rather accurately the feed intake of cows that do not have labour expensive systems to monitor the roughage intake. These models form a good basis to develop proxies for daily roughage intake of individual dairy cows, based on routinely available data on the dairy farm. These proxies for daily roughage intake can be used in management modules to optimise the feed management of individual or groups of dairy cows or be aggregate to predict full lactation intake, when no or partial feed intake records are available.
Grass intake
In dairy farming grass forms a significant element in the food management and milk production process. The volume and quality of the grass production and consumption (preferably per individual cow) are relevant for the insight in and optimization of the milk production process, but also for the grass production process and in the end also for the investigation of the genotype and phenotype information in the framework of food efficiency and genomic selection. Technology for sensing, location specific treatment and data processing and analysis provide new opportunities for the optimization of the grass production process. In this project research has been done on establishing grass quantity by making use of remote sensing observations. Use has been made of observations from both satellites and drones. For this project a link could be made to a grazing experiment at the Dairy Campus in Leeuwarden. In the framework of this experiment a parcel was subdivided into multiple sub-parcels with varying grass stages. The parcels were observed by a drone on a weekly basis and field measurements of the grass length were collected on a daily basis. Also satellite observations were available at irregular intervals of one to four weeks (depending on the weather circumstances). Big data techniques are relevant as the volume of remote sensing data tend to be large. Remote sensing data consist of a raster of observations covering the whole area. For each pixel reflections in multiple spectral bands may be recorded. For drone observations photos are collected with resolutions of some centimetres and with 60 to 80%
5
overlap. As a consequence in this project the data volume of one drone flight over the Dairy Campus is in the order of 1.5Gb. Big Data techniques can help in the management and processing of these data volumes. Secondly Big Data techniques can help in the combined analysis of multiple types of data: satellite and drone raster observations, field point measurements for height and dry weight, weather conditions, information on the grazing characteristics and cow situation. Relations between these features were investigated.
Multispectral photography, either from satellite or from UAS, can be a valuable instrument for the evaluation of the normalized vegetation index (NDVI) as an indicator for the grass biomass. From this study it can be concluded however that for doing this the radiometric and atmospheric calibration of the sensor data is of big importance. Especially because the NDVI variation for the different grass growth stages is only limited (0.6-0.8). Special points of attention for the calibration are the combination of observations from different sensors (relative calibration of different satellites and UAS) and the radiometric calibration and mosaicking of UAS data, especially when flying under cloudy circumstances. Strategies for calibration and usage of ground truth should be worked out and tested further.
Stereo photography from UAS can be a valuable instrument for the measurement of the actual grass heights. Important however is that the photos will be acquired with sufficient spatial resolution (cm level) and that attention is paid to accurate georeferencing (either by using accurate ground control points and/or by using RTK GPS positioning of the UAS). With the current 12cm photos relative variations in grass height could be observed, but the resolution was too coarse to extract accurate and reliable grass height information. As grass height variations in the order of 1cm are relevant, photos with a pixel size of 1cm need to be acquired which is well possible with current technology. An interesting and promising aspect is that with a single UAS stereo photo flight both information can be obtained on grass NDVI and grass height. The combination of these can be input to obtain more reliable values on the grass biomass. Big data will offer capabilities for the processing of large amounts of data and for the analysis of relations between the measured and other available parameters. The current experiment showed that the amount of remote sensing data easily is in the order of Gigabytes per observation day. When the methodology is expanded to more parcels, farms and higher spatial detail this is scaled up further. Experiments with using Spark/Hadoop technology for raster data management and processing showed that scaling of the processing times is well possible.
(5) synthesis plus answering of the research questions
The creation of an integration platform for big data analysis for smart farming was far too ambitious for a one year activity with emphasis only on one use case. However, by doing this project we brought different kind of expertise and background together to explore parts of the solution. As described in the chapters it is much more complex than expected. Smart farming puts emphasis on the ICT- and decision making part of precision farming. It looks like a buzzword used to describe the concept of intelligent use of data-rich ICT-services and ICT-applications. It is presented as an extra on top of the concepts of precision agriculture and precision livestock farming. Smart farming has the potential to contribute to more sustainable agriculture. And big data use, if established, will support smart decisions and management. Organisations are evaluating to invest in big data technology and use? Big data technology represents a disruptive innovation that market orientated organisations will use to drive competitive advantage and governmental bodies to set and reach policy targets. The value of big data lies in the information and insight that organisations can draw from it, rather than in the data itself. Linking physical and socio-economic data, for example, may generate entirely new insights and market opportunities. So, the impact of big data for smart farming outreaches the impact of a single farmer and his processes, although at farm level maybe most of the big data will be created by implementing new sensing techniques that are high data sensitive.
The perspective arises that use of big data technology has the potential to dramatically change organisations. It will alter data availability, knowledge creation, decision making, production optimization and competitiveness. A fair question is: “Will big data bring real benefits to organisations and society, or will it end up a hype with only one or two companies benefiting from it?”. We can answer this question within ca. 20 years from now. Presently, the authors of this report have positive expectations of big data applications in the field of smart farming.
7
1.
Introduction
1.1
Rationale
FAO (2009) stated that ‘a more sustainable agriculture’ is one of the big challenges of global human population. Agriculture has to produce more food, feed, fuel, flowers, etc., with less use of natural resources and with less adverse side effects on the environment and society and the expectations are that precision agriculture and the acronym smart farming will be necessary to achieve this . More with less, is also a credo of Wageningen UR. Big data applications are likely to contribute to more efficient agro-food chains, and so likely to contribute to a more sustainable agriculture. This report describes a study on the application of big data technology in the context of smart farming in agriculture.
Big data is a buzzword used to describe a massive volume of both structured and unstructured data that is so large that it is difficult to process using traditional database and software techniques. Many public and private organisations are currently evaluating the potential of big data. And a small part of them is already investing in development and implementation of big data technology, or started to create added value with it. The perspective is that use of big data technology has the potential to dramatically change organisations. It will alter data availability, knowledge creation, decision making, production optimization, competitiveness, etc. A fair question is: “Will big data bring real benefits to organisations and society, or will it end up a hype with only one or two companies benefiting from it?” (Needle, 2015). We can answer this question within ca. 20 years from now. Presently, the authors of this report are curious and interested in the potential for big data applications in agriculture.
To make use of the big data mainstream, a lot of technological development and customization still has to take place. Show cases are also needed to demonstrate the benefits and to convince stakeholders. In this report we describe results of a project in which three TO2-institutes (WUR, TNO and NLR) in The Netherlands in 2015 worked together on development of big data technologies within a (show)case of smart farming: the milk production chain, with the expectation that this will contribute to more sustainable agriculture.
1.2
Precision farming and smart agri-food chains
Smart farming is a relatively new concept arising within the more established management concepts of precision farming and precision livestock farming. Precision farming is based on the management concept of observing, measuring and responding to inter and intra-field variability in crops, including aspects related to animal rearing (Kempenaar & Kocks, 2013; Lokhorst & Ipema, 2010). The benefits for farmers and for the environment and society are related to increased yields, increased profitability, better working conditions, increased animal health and welfare and reduction of pesticides and chemicals (sustainable production). Smart farming puts emphasis on the ICT- and decision making part of precision farming (Wolfert & Kempenaar, 2012). It is a buzzword used to describe the concept of intelligent use of data-rich ICT-services and ICT-applications. Smart farming has the potential to contribute to more sustainable agriculture. And big data use, if established, will support smart decisions and management.
Smart Farming extends the Precision Agriculture concept: the existing tasks for management and decision making based on data are enhanced by context, situation and location awareness. A corresponding task can be related to farm operations, farm logistics, food logistics, stakeholder network, etc. Real-time assisting features are necessary to carry out agile actions, especially in cases of suddenly changed operational conditions or other circumstances (e.g. weather or disease alert). Furthermore, the assisting features typically include intelligent assistance in implementation, maintenance and use of the technology. Figure 1.1 visualizes Smart Farming as a cyber-physical cycle of smart sensing
and monitoring, smart analyses & planning and smart control of farm operations that utilizes Big Data in some way. This concept is explained in more detail in chapter 2.
Over the last decades, we see the following trend in modern agriculture. Productivity development in agriculture has incrementally moved from scaling of assets to optimization of assets. Agricultural technologies as well as overall farm enterprises have grown in size and value over the years and a higher degree of input/output management supported by ICT technology has become essential for optimization of farm profitability and minimization of environmental impact. Optimization parameters such as fuel, labour, fertilizer, pesticides, soil and water preservation relative to yield and quality of the crop are just some of the parameters any arable farmer needs to balance on an operational, tactical and strategic level. And dairy farmers are optimizing milk production by considering the livestock properties (genetics), inputs (feed, water, medicines, housing, etc.) and output (milk, manure, calves, ...). As input costs are increasing and in some cases input levels are regulated, the cost of making the right or wrong decisions is increasing correspondingly. Furthermore, the dynamic nature of agriculture which is strongly influenced by external factors such as climate volatility and fluctuating crop prices makes these decisions even more difficult. Figure 1.1 visualizes Smart Farming as a cycle of smart sensing and monitoring, smart analysis & planning and smart control of farm operations that utilizes a cloud-based event management system.
Figure 1.1. The cyber-physical management cycle of Smart Farming enhanced by cloud-based event and data management (Wolfert et al., 2014)
The last decades the relative isolated position of farmers has changed. They have become part of a dynamic chain system in which every part of the chain needs optimization, but also cooperation within the chain needs optimization. Thus farmers have become part of the quality chain control system, of marketing and logistics from basic genetic origin to consumer uptake (Trienekens et al, 2010).
1.3
Big data technology
Big data technology applies to ICT-tools and -infrastructure that allow access to handling, analysis and knowledge creation with big data. In scientific publications, the words electronic science or e-Science are also used when considering this domain. Strictly defined, e-Science is computationally intensive science that involves distributed networks or grid computing (Top et al., 2015, in prep.). E-Science, and also big data technology, allow world-wide collaboration in flexible research teams using advanced, user-friendly and web-based tools, services and repositories.
E-9
science/Big data technology will change how (big) data are generated, how new information and knowledge is created, and how data, information and knowledge is shared and applied.
In the next chapters more will be explained about what is needed to create value with the use of big data. Terms like data volume, velocity, variety, veracity, variability and value of data (six V’s of big data) will be addressed. And data should be FAIR: Findable, Accessible, Interoperable en Reliable. Figure 1.2 depicts the process data make from devices that (autonomously) acquire data to knowledge and value creation to support decisions of users.
Figure 1.2. Schematic flow of data from devices to added value. Source: TNO.
Why are organisations evaluating to invest in big data technology and use? Big data technology represents a disruptive innovation that market orientated organisations will use to drive competitive advantage and governmental bodies to set and reach policy targets. The value of big data lies in the information and insight that organisation can draw from it, rather than in the data itself. Linking physical and socio-economic data, for example, may generate entirely new insights and market opportunities.
Also TO2-institutes participating in this project invest in big data technology. They formulated their big data strategies in strategy documents or position papers (DLO, 2015; TNO, 2015; NLR). A conceptual view on the big data domain by Wageningen UR is depicted in figure 1.3. Figure 1.3 shows examples of the various types of big data related technologies and methodologies and fields of expertise that are relevant for the subsequent higher levels of the Agri&Food knowledge chain. The big data field focuses on the horizontal as well as the vertical exchange of information and interaction. Therefore, strongly technology related infrastructures and fields of expertise are required as well as knowledge and methods in the field of policy analysis and knowledge brokerage are needed for the contextualization of the available data and gathered knowledge.
Figure 1.3. Conceptual view on big data domain. Source: DLO
However, there are also risks, for example those related to regulatory hazards and issues such as ownership and privacy. To secure value from big data technologies, organisations need a holistic and strategic plan for identifying opportunities and overcoming hurdles and managing risks.
1.4
Objectives, approach and report structure
In this report we describe results of a one-year TO2 institutes project on the development of big data technologies within the milk production chain. The goal of this project is to ‘create’ an integration platform for big data analysis for smart farming and to develop a show case. This includes both technical (hard /software) and organizational integration
(developing business ecosystem) and combining and linking of data and models. DLO, NLR and TNO worked together in 2015 towards the realization of an IT data infrastructure that makes it possible to solve to connect data from different sources and models in an effective and safe way, ontology problems, specific analysis tools develop, opportunities and risks to identify and assess the acquired knowledge and experience and present it in a smart farming show case, from 'grass to glass‘.
In the project we combine domain specific databases with generic ICT- tools and -infrastructure. A data transfer agreement was agreed upon the use of data in the project and to safeguard IP of third parties. NLR contributed data and expertise on (analysis of) satellite data to the project. WLR and PRI contributed domain knowledge, databases (e.g. on genotype and phenotype of cows, feed uptake, milk production and crop management) and models, LEI contributed socio-economic expertise on big data, and TNO provided expertise on ICT-infrastructure, data protection, ontology (in cooperation with PRI and WLR) and analysis tools.
The project was organised in work packages: (1) literature study on big data and smart farming that is relevant to the project, (2) case definition plus outline of big data research questions and required data-infrastructure, (3) semantics, ontology and Linked Open Data (LOD), (4) analysis tools, and (5) synthesis plus answering of the big data questions. The conceptual framework is depicted in figure 1.4. Each work packages was led by a coordinator of one of the three institutes most affiliated with the core of the work package. In the chapters 2 to 5 we describe the relevant state of the art of the literature on big data use (chapter 2), the smart dairy farming case, research questions and requirements (chapter 3), semantic challenges and solutions (Chapter 4) and analysis tools (chapter 5 for cow centric data and chapter 6 for remote sensing data for grassland). In chapter 7, we describe what is achieved in one year time by bringing together the different databases and ICT-infrastructure and tools, in order to answer big data research questions in the milk production chain. Chapter 8 describes the general lessons learned.
Figure 1.4 Project framework for integration.
A. Analy
sis
Generic Integration Framework
• Architecture/Infrastructure • Tools for analysis & application • Organizational Infrastructure B. Basic Design Pilo t A Pil ot B Pilo t C ……… C. Iterative Implementation Project fase Opschaling, verbreding in nieuwe PPS-en vervolg Pil ots
11
2.
Literature study
2.1
Introduction
As smart machines and sensors crop up on farms and farm data grow in quantity and scope, farming processes will become increasingly data-driven and data-enabled. Rapid developments in the Internet of Things and Cloud Computing are propelling the phenomenon of what is called Smart Farming (Sundmaeker et al., 2016). Smart Farming goes beyond the concept of Precision Agriculture by basing management tasks not only on location but also on data, enhanced by context- and situation awareness, triggered by real-time events (Wolfert et al., 2014). Real-time assisting reconfiguration features are required to carry out agile actions, especially in cases of suddenly changed operational conditions or other circumstances (e.g. weather or disease alert). These features typically include intelligent assistance in implementation, maintenance and use of the technology. Figure 1.1 summarizes the concept of Smart Farming along the management cycle as a cyber-physical system. In this picture it is already suggested that robots can play an important role in control, but it can be expected that the role of humans in analysis and planning is increasingly assisted by machines so that the cyber-physical cycle becomes almost autonomous. Humans will always be involved in the whole process but
increasingly at a much higher intelligence level, leaving most operational activities to machines.
Big Data technologies are playing an essential, reciprocal role in this development: machines are equipped with all kind of sensors that measure data in their environment that is used for the machines’ behaviour. This varies from relatively simple feedback mechanisms (e.g. a thermostat regulating temperature) to deep learning algorithms (e.g. to implement the right crop protection strategy). This is leveraged by combining with other, external Big Data sources such as weather or market data or benchmarks with other farms. Due to rapid developments in this area, a unifying definition of Big Data is difficult to give, but generally it is a term for data sets that are so large or complex that traditional data processing applications are inadequate (Wikipedia, 2016). Big data requires a set of techniques and technologies with new forms of integration to reveal insights from datasets that are diverse, complex, and of a massive scale (Hashem et al., 2015). Big Data represents the information assets characterized by such a high volume, velocity and variety to require specific technology and analytical methods for its transformation into value (De Mauro et al., 2016). The Data FAIRport initiative emphasizes the more operational dimension of Big Data by providing the FAIR principle meaning that data should be Findable, Accessible, Interoperable and Re-usable (Data FAIRport, 2014). This also implies the
importance of metadata i.e. ‘data about.
Both Big Data and Smart Farming are relatively new concepts, so it is expected that knowledge about their applications and their implications for research and development is not widely spread. Some authors refer to the advent of Big Data and related technology as another technology hype that may fail to materialize, others consider Big Data applications may have passed the ‘peak of inflated expectations’ in Gartner’s Hype Cycle (Fenn and LeHong, 2011; Needle, 2015). This literature study aims to provide insight into the state-of-the-art of Big Data applications in relation to Smart Farming and to identify the most important research and development challenges to be addressed in the future. In studying the literature, attention is paid to both technical and socio-economic aspects. In the analysis there is a primary focus on the socio-economic impact Big Data will has on farm management and the whole network around it. The research questions to be addressed are:
1. What role does Big Data play in Smart Farming?
2. What stakeholders are involved and how are they organized?
3. What are the expected changes that are caused by Big Data developments? 4. What challenges need to be addressed in relation to the previous questions?
To answer these questions and to structure the review process, a conceptual framework for analysis has been developed, which is expected to be useful also for future analyses of developments in Big Data and Smart Farming.
2.2
Methodology
To address the research questions as outlined in the introduction, we surveyed literature between January 2010 and March 2015. This was done in three steps. In the first step we searched two major bibliographical databases, Web of
Science and Scopus, using all combinations of two groups of keywords of which the first group addresses Big Data (i.e.
Big Data, data-driven innovation, data-driven value creation, internet of things, IoT) and the second group refers to farming (i.e. agriculture, farming, food, agri-food, precision agriculture). From these two databases 613 peer-reviewed articles were retrieved. These were scanned for relevance by identifying passages that were addressing the research questions. As a result, 20 were considered most relevant and 94 relevant. The remaining articles were considered not really relevant as they only tangentially touch upon Big Data or agriculture and therefore excluded from further reading and analysis. We found the number of relevant peer-reviewed literature not very high which can be explained because Big Data and Smart Farming are relatively new concepts. Especially the applications are rapidly evolving and expected not to be taken into account in peer-reviewed articles which are usually lagging behind. Therefore we decided to also include grey literature into our review. For that purpose we have used Google Scholar and the search engine LexisNexis for reports, magazines, blogs, and other web-items in English. This has resulted in 3 reports, 225 magazine articles, 319 blogs and 19 items on twitter. Each of the 319 blogs was evaluated on relevance based on its title and sentences containing the search terms. Also possible duplications were removed. The result was a short list containing 29 blogs that were evaluated by further reading. As a result, 9 blogs have been considered as presenting relevant information for our framework. Each of the 225 magazine articles was similarly evaluated on their relevance based on its title and sentences containing the search terms. After removing duplicates, the result is a short list of 25 articles. These 25 articles were then read through for further evaluation. Consequently 9 articles have been considered as containing relevant information for further analysis.
In the second step, we read the selected literature in detail to extract the information relevant to our research
questions. Additional literature that had not been identified in the first step was retrieved in this step as well if they were referred to by the ‘most relevant’ literature. This ‘snow-ball’ approach has resulted in 11 additional articles and web-items from which relevant information was extracted as well. In the third step, the extracted information was analysed and synthesized following the conceptual framework as described in Section 2.3.
2.3
Conceptual framework
For this literature study a conceptual framework was developed to provide a systematic classification of issues and concepts for the analysis of Big Data applications in Smart Farming from a socio-economic perspective. This framework draws upon literature on network management and data-driven strategies.
The often-cited conceptual framework of Lambert & Cooper (2000) on network management comprises three closely interrelated elements: the network structure, the business processes, and the management components. The network structure consists of the member firms and the links between these firms. Business processes are the activities that produce a specific output of value to the customer. The management components are the managerial variables by which the business processes are integrated and managed across the network. The network management component is further divided into a technology and organisation component.
For our purpose the framework was tailored to networks for Big Data applications in Smart Farming as presented in Figure .1.
13
Figure 2.1 Conceptual framework for the literature analysis (adapted from Lambert and Cooper (2000))
In this object system for research, the business processes (lower layer) focus on the generation and use of Big Data in the management of farming processes. For this reason, we subdivided this part into the data chain, the farm
management and the farm processes. The data chain interacts with farm processes and farm management processes through various decision making process in which information plays an important role. The stakeholder network (middle layer) comprises all stakeholders that are involved in these processes, not only users of Big Data but also companies that are specialised in data management. The technology component of network management (upper layer) focuses on the information infrastructure that supports the data chain. The organisational component focuses on the governance and business model of the data chain. Finally, several factors can be identified as key drivers for the development of Big Data in Smart Farming and as a result challenges can be derived from this development.
The next subsections provide a more detailed description of each subcomponents of the business processes layer and network management layer of the framework.
Farm processes
2.3.1
A business process is a set of logically related tasks performed to achieve a defined business outcome (Davenport and Short, 1990). An important foundation of business process approaches was laid by Porter (1985), who introduced the term ‘value chain’. A firm’s value chain is a system of interlinked processes, each adding value to the product or service. Based on this principle, business processes can be subdivided into primary and supporting business processes (Davenport, 1993; Porter, 1985). Primary Business Processes are those involved in the creation of the product, its marketing and delivery to the buyer (Porter, 1985). Supporting Business Processes facilitate the development, deployment and maintenance of resources required in primary processes.
Farm management
2.3.2
Management or control processes ensure that the business process objectives are achieved, even if disturbances occur. The basic idea of control is the introduction of a controller that measures system behaviour and corrects if measurements are not compliant with system objectives. Basically, this implies that they must have a feedback loop in which a norm, sensor, discriminator, decision maker, and effector are present (Beer, 1981; in 't Veld, 2002). As a consequence, the basic management functions are (Verdouw et al., 2015) (see also Figure 1.1):
Sensing and monitoring: measurement of the actual performance of the object system. This can be done manually by a human observer or automated by using sensing technologies such as sensors or satellites. In addition, external data can be acquired to complement direct observations.
RESEARCH OBJECT SYSTEM
NETWORK MANAGEMENT
BUSINESS PROCESSES
D
R
I
V
E
R
S
FARM PROCESSES
STAKEHOLDER NETWORK
ORGANIZATION
TECHNOLOGY
C
H
A
L
L
E
N
G
E
S
FARM MANAGEMENT
DATA CHAIN
Analysis and decision making: compares measurements with the norms that specify the desired performance (system objectives concerning e.g. quantity, quality and lead time aspects), signals deviations and decides on the appropriate intervention to remove the signalled disturbances.
Intervention: plans and implements the chosen intervention to correct the object system’s performance.
Data chain
2.3.3
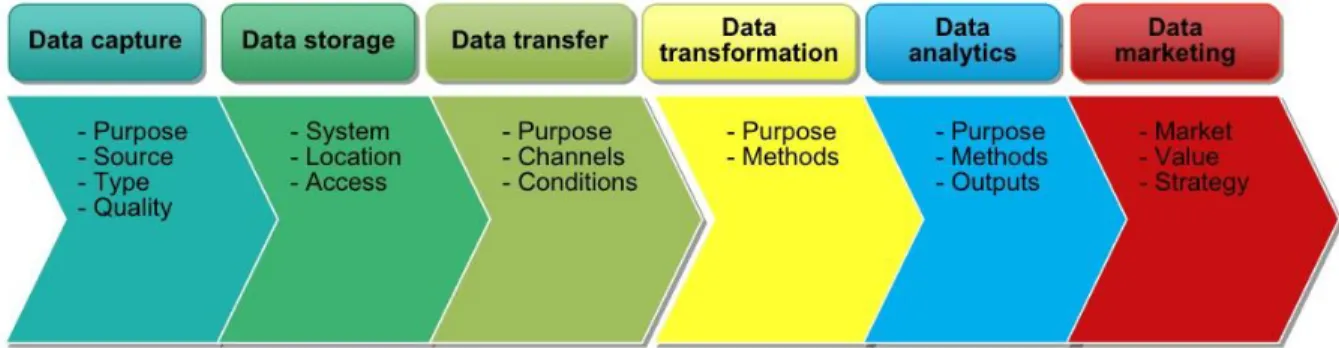
The data chain refers to the sequence of activities from data capture to data marketing. Figure 2.2 illustrates the main steps in this chain.
Figure 2.2 The data chain of Big Data applications, based on Chen et al. (2014b)
Being an integral part of business processes, the data chain consists necessarily of a technical layer that captures raw data and converts it into information and a business layer that makes decision and derives value from providing data services and business intelligence. The two layers can be interwoven in each stage and together they form the basis of what has come to be known as the ‘data value chain’ (Dumbill, 2014) (Table 2.1).
Table 2.1 Key stages of the data chain on technical and business layer Layer of data
chain
Stages of a data chain
Raw material Processing Transport Marketing Technical Data generation and
capture
Data janitorial work, Data transformation Data analytics
Data transfer Data transfer Data analytics
Business Data discovery Data warehousing Interpreting data, Connecting data to decision (Obtaining business information and insight) Information share and data integration Data-driven services
Network management organization
2.3.4
The network management organisation deals with the behaviour of the stakeholders and how it can be influenced to accomplish the business process objectives. For the uptake and further development of Big Data applications, two interdependent aspects are considered relevant: governance and business model. Governance involves the formal and informal arrangements that govern cooperation within the stakeholder network. Lambert & Cooper (2000) identify the following components: management methods, power and leadership structure, risk and reward structure and culture and attitude. This includes the governance structure, which is a major issue in Network Theory. Three basic forms of network governance can be distinguished (Lazzarini et al., 2001):
• Managerial Discretion: discretionary actions by a coordinating agent, who centrally plans the flow of products and information;
• Standardization: standardized rules and shared mechanisms to orchestrate transactions;
• Mutual Adjustment: alignment of plans through mutual feedback processes and joint problem solving and decision making.
15
These forms correspond with the three forms of network governance presented by Provan and Kenis (2008): lead organisation-governed network, network administrative organisation, and shared participant-governed network. The choice of a particular network governance structure aims at mitigating all forms of contractual hazards found between the different contracting parties in such a way that transaction costs are minimized (Williamson, 1996). When studying hybrid forms of organization such as supply chain networks, two main dimensions should be identified: the allocation of decision rights, i.e., who has the authority to take strategic decisions within the supply chain network, and the inter-organizational mechanisms aiming at rewarding desirable behaviour and preventing undesirable behaviour (risk and rewarding mechanisms).
Despite agreement on the importance of business model to an organization's success, the concept is still fuzzy and vague, and there is little consensus regarding its compositional facets. Osterwalder (2004) defines business model as “… a conceptual tool that contains a set of elements and their relationships and allows expressing a company's logic of earning money”. It is a description of the value a company offers to one or several segments of customers and the architecture of the firm and its network of partners for creating, marketing and delivering this value and relationship capital, in order to generate profitable and sustainable revenue streams.” This definition reflects a so-called firm-centric view of business model. Another view on business model is the network-centric business model which builds upon value network theories (Al-Debei and Avison, 2010). The value network theories consider both financial and non-financial value of business transactions and exchanges. Both views are relevant to the network management of Big Data applications.
Network management technology
2.3.5
The network management technology includes all computers, networks, peripherals, systems software, application packages (application software), procedures, technical, information and communication standards (reference information models and coding and message standards) etc., that are used and necessary for adequate data management in the inter-organizational control of farming processes (van der Vorst et al., 2005). Components to be mentioned here encompass:
Data resources stored in shared databases and a shared understanding of its content (shared data model of the database).
Information systems and services that allow us to use and maintain these databases. An information system is used to process information necessary to perform useful activities using activities, facilities, methods and procedures.
The whole set of formalised coding and message standards (both technically and content-wise) with associated procedures for use, connected to shared databases, which are necessary to allow seamless and error-free automated communication between business partners in a food supply chain network.
The necessary technical infrastructure. None of the above can work if we don’t have the connected set of computers (workstations of individual associates or people employed by or interested in the network and the database, communication and application servers and all associated peripherals) that will allow for its usage. In conclusion, this framework now provides a coherent set of elements to describe and analyse the developments of Big Data in Smart Farming. The results are provided in chapter 2.4.
2.4
Results
Drivers for Big Data in Smart Farming
2.4.1
There has been a significant trend to consider the application of Big Data techniques and methods to agriculture as a major opportunity for application of the technology stack, for investment and for the realisation of additional value within the agri-food sector (Noyes, 2014; Sun et al., 2013; Yang, 2014). Big data applications in farming are not strictly about primary production, but play a major role in improving the efficiency of the entire supply chain and alleviating food security concerns (Chen et al., 2014a; Esmeijer et al., 2015; Gilpin, 2015). Big data is the focus of in-depth, advanced, game-changing business analytics, at a scale and speed that the old approach of copying and cleansing all of it into a data warehouse is no longer appropriate (Devlin, 2012). Opportunities for Big Data applications in agriculture include benchmarking, sensor deployment and analytics, predictive modelling, and using better models to manage crop failure risk and to boost feed efficiency in livestock production (Faulkner and Cebul, 2014; Lesser, 2014). In conclusion, Big Data is to provide predictive insights to future outcomes of farming (predictive yield model, predictive feed intake
model, etc.), drive real-time operational decisions, and reinvent business processes for faster, innovative action and game-changing business models (Devlin, 2012). Decision-making in the future will be a complex mix of human and computer factors (Anonymous, 2014b). Big data is expected to cause changes to both the scope and the organisation of farming (Poppe et al., 2015). While there are doubts whether farmers’ knowledge is about to be replaced by algorithms, Big Data applications are likely to change the way farms are operated and managed (Drucker, 2014). Key areas of change are real-time forecasting, tracking of physical items, and reinventing business processes (Devlin, 2012). Wider uptake of Big Data is likely to change both farm structures and the wider food chain in unexplored ways as wat happened with the wider adoption of tractor and the introduction of pesticides in the 1950s.
As with many technological innovations changes by Big Data applications in Smart Farming are driven by push-pull mechanisms. Pull, because there is a need for new technology to achieve certain goals. Push, because new technology enables people or organisations to achieve higher or new goals. This will be elaborated in the next subsections.
Pull factors
From a business perspective, farmers are seeking ways to improve profitability and efficiency by on the one hand looking for ways to reduce their costs and on the other hand obtaining better prices for their product. Therefore they need to take better, more optimal decisions and improve management control. While in the past advisory services were based on general knowledge that once was derived from research experiments, there is an increasing need for information and knowledge that is generated on-farm in its local-specific context. It is expected that Big Data
technologies help to achieve these goals in a better way (Poppe et al., 2015; Sonka, 2015). A specific circumstance for farming is the influence of the weather and especially its volatility. Local-specific weather and climate data can help decision-making a lot (Lesser, 2014). A general driver can be the relief of paper work because of all kind of regulations in agri-food production (Poppe et al., 2015).
From a public perspective global food security is often mentioned as a main driver for further technological
advancements (Gilpin, 2015; Lesser, 2014; Poppe et al., 2015). Besides, consumers are becoming more concerned about food safety and nutritional aspects of food related to health and well-being (Tong et al., 2015). In relation to that, Tong et al. (2015) mention the need for early warning systems instead of many ex-post analyses that are currently being done on historical data.
Push factors
A general future development is the Internet of Things (IoT) in which all kinds of devices – smart objects - are connected and interact with each other through local and global, often wireless network infrastructures (Porter and Heppelmann, 2014). Precision agriculture can be considered as an exponent of this development and is often mentioned as an important driver for Big Data (Lesser, 2014; Poppe et al., 2015). This is expected to lead to radical changes in farm management because of access to explicit information and decision-making capabilities that were previously not possible, either technically or economically (Sonka and IFAMR, 2014). As a consequence, there is a rise of many ag-tech companies that pushes this data-driven development further (Lesser, 2014).
Wireless data transfer technology also permits farmers to access their individual data from anywhere – whether they are at the farmhouse or meeting with buyers in Chicago – enabling them to make informed decisions about crop yield, harvesting, and how best to get their product to market (Faulkner and Cebul, 2014).
Business processes
2.4.2
Farm processes
Agricultural Big Data are known to be highly heterogeneous (Ishii, 2014; Li et al., 2014). Data collected from the field or the farm include information on planting, spraying, materials, yields, in-season imagery, soil types, weather, and other practices. Table 1.2 provides an overview of current Big Data applications in relation to different elements of Smart Farming in key farming sectors.
17
Table 1.2 Examples of Big Data applications/aspects in different Smart Farming processes (cf. Figure 1.1) Cycle of Smart
Farming
Arable Livestock Horticulture Fishery
Smart sensing and monitoring Robotics and sensors Biometric sensing, GPS tracking Robotics and sensors (temperature, humidity, CO2, etc.), greenhouse computers Automated Identification Systems (AIS)
Smart Analysis and Planning
Seeding, Planting, Soil typing, Crop health, yield modelling
Breeding, monitoring Lighting, energy management
Surveillance, monitoring
Smart Control Precision farming Milk robots Climate control, Precision control
Surveillance, monitoring
Big Data in the Cloud
Weather/climate data, Yield data, Soil types, Market information, agricultural census data Livestock movements Weather/climate, market information, social media,
Satellite data, Market data
There are in general three categories of data generation (Devlin, 2012; UNECE, 2013): (i) process-mediated (PM), (ii) machine-generated (MG) and (iii) human-sourced (HS). PM data, or the traditional business data, result from agricultural processes that record and monitor business events of interest, such as purchasing inputs, feeding, seeding, applying fertilizer, taking an order, etc. PM data are usually highly structured and include transactions, reference tables and relationships, as well as the metadata that define their context. Traditional business data are the vast majority of what IT managed and processed, in both operational and business information systems, usually structured and stored in relational database systems. MG data are derived from the vast increasing number of sensors and smart machines used to measure and record farming processes; this development is currently boosted by what is called the Internet of Things (IoT). MG data range from simple sensor records to complex computer logs and are typically well-structured. As sensors proliferate and data volumes grow, it is becoming an increasingly important component of the farming information stored and processed. Its well-structured nature is suitable for computer processing, but its size and speed is beyond traditional approaches. For Smart Farming, the potential of unmanned aerial vehicles (UAVs) has been well-recognized (Faulkner and Cebul, 2014; Holmes, 2014). Drones with infrared cameras, GPS technology, are transforming agriculture with their support for better decision making, risk management (Anonymous, 2014c). In livestock farming, smart dairy farms are replacing labour with robots in activities like feeding cows, cleaning the barn, and milking the cows (Anonymous, 2012). On arable farms, precision technology is increasingly used for managing information about each plant in the field (Vogt, 2013). With these new technologies data is not in traditional tables only, but can also appear in other formats like sounds or images (Sonka, 2015). In the meantime several advanced data analysis techniques have been developed that trigger the use of data in images or other formats (Lesser, 2014; Noyes, 2014). HM data is the record of human experiences, previously recorded in books and works of art, and later in photographs, audio and video. Human-sourced information is now almost entirely digitized and stored everywhere from personal computers to social networks. HM data are usually loosely structured and often ungoverned. In the context of Big Data and Smart Farming, human-sourced data have rarely been discussed except in relation to the marketing aspects (Verhoosel et al., 2016). Limited capacity with regard to the collection of relevant social media data and semantic integration of these data from a diversity of sources is considered to be a major challenge (Bennett, 2015). From the business perspective, the main data products along the Big Data value chain are (predictive) analytics that provide decision support to business processes at various levels. The use or analysis of sensor data or similar data must somehow fit into existing or reinvented business processes. Integration of data from a variety of sources, both traditional and new, with multiple tools, is the first prerequisite.
Farm management
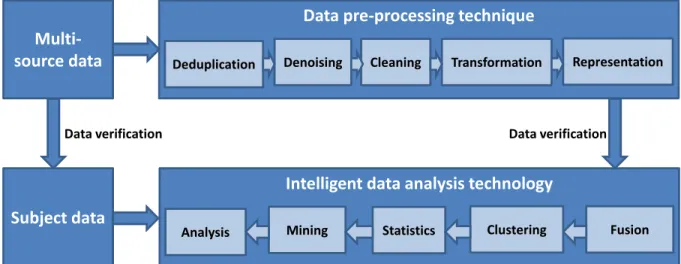
As Big Data observers point out: big or small, Big Data is still data (Devlin, 2012). It must be managed and analysed to extract its full value. Developments in wireless networks, IoT, and cloud computing are essentially only means to obtain data and generate Big Data. The ultimate use of Big Data is to obtain the information or intelligence embodied or enabled by Big Data. Agricultural Big Data will have no real value without Big Data analytics (Sun et al., 2013). To obtain Big Data analytics, data from different sources need to be integrated into ‘lagoons of data’. In this process, data quality issues are likely to arise due to errors and duplications in data. As shown in Figure 2.3, a series of operations on the raw data may be necessary to ensure the quality of data.
Figure 2.3 The flowchart of intelligent processing of agricultural Big Data (Source: Li, Chen, & Guo, (Li et al., 2014)
Since the advent of large-scale data collections or warehouses, the so-called data rich, information poor (DRIP)
problems have been pervasive. The DRIP conundrum has been mitigated by the Big Data approach which has unleashed information in a manner that can support informed - yet, not necessarily defensible or valid - decisions or choices. Thus, by somewhat overcoming data quality issues with data quantity, data access restrictions with on-demand cloud computing, causative analysis with correlative data analytics, and model-driven with evidence-driven applications (Tien, 2013). Big data on its own can offer ‘a-ha’ insights, but it can only reliably deliver long-term business advantage when fully integrated with traditional data management and governance processes (Devlin, 2012). Big Data processing depends on traditional, process-mediated data and metadata to create the context and consistency needed for full, meaningful use. The results of Big Data processing must be fed back into traditional business processes to enable change and evolution of the business.
Table 2.2 State of the art of Big Data applications in Smart Farming and key issues Stage of the data State of the art Key issues Data capture Sensors, Open data, data captured by
UAVs,
Biometric sensing, Genotype information, Reciprocal data
Availability, quality, formats
Data storage Cloud-based platform, Hadoop Distributed File System (HDFS), hybrid storage systems, cloud-based data warehouse
Quick and safe access to data, costs
Data transfer Wireless, cloud-based platform, Linked Open Data
Safety, agreements on responsibilities and liabilities, costs, wireless network
Data transformation Machine learning algorithms, normalize, visualize, anonymize
Heterogeneity of data sources, automation of data cleansing and preparation
Data analytics Yield models, Planting instructions, Benchmarking, Decision ontologies, Cognitive computing
Semantic heterogeneity, real-time analytics, scalability
Data marketing Data visualisation Ownership, privacy, new business models
Data pre-processing technique
Deduplication Denoising Cleaning Transformation Representation
Multi-source data
Intelligent data analysis technology
Analysis Mining Statistics Clustering Fusion
Data verification Data verification
19
Data chain
Table 2.2 summarizes the state-of-the-art features of Big Data applications in Smart Farming and the key issues corresponding to each stage of the Big Data chain that were found in literature.
Stakeholder network
2.4.3
In view of the technical changes brought forth by Big Data and Smart Farming, we seek to understand the stakeholder network around the farm. The literature suggests major shifts in roles of and power relations among different players in existing agri-food chains. We observed the changing roles of old and new software suppliers in relation to Big Data and farming and emerging landscape of data-driven initiatives with prominent role of big tech and data companies like Google and IBM. In Figure 2.4, the current landscape of data-driven initiatives is visualized.
The stakeholder networks exhibits a high degree of dynamics with new players taking over the roles played by other players and the incumbents assuming new roles in relation to agricultural Big Data. As opportunities for Big Data have surfaced in the agribusiness sector, big agriculture companies such as Monsanto and John Deere have spent hundreds of millions of dollars on technologies that use detailed data on soil type, seed variety, and weather to help farmers cut costs and increase yields (Faulkner and Cebul, 2014). Other players include various accelerators, incubators, venture capital firms, and corporate venture funds (Monsanto, DuPont, Syngenta, Bayer, DOW etc.) (Lane, 2015).
Monsanto has been pushing big-data analytics across all its business lines, from climate prediction to genetic engineering. It is trying to persuade more farmers to adopt its cloud services. Monsanto says farmers benefit most when they allow the company to analyse their data - along with that of other farmers - to help them find the best solutions for each patch of land (Guild, 2014).
While corporates are very much engaged with Big Data and agriculture, start-ups are at the heart of action, providing solutions across the value chain, from infrastructure and sensors all the way down to software that manages the many streams of data from across the farm. As the ag-tech space heats up, an increasing number of small tech start-ups are launching products giving their bigger counterparts a run for their money. In the USA, start-ups like FarmLogs (Guild, 2014), FarmLink (Hardy, 2014) and 640 Labs challenge agribusiness giants like Monsanto, Deere, DuPont Pioneer (Plume, 2014). One observes a swarm of data-service start-ups such as FarmBot (an integrated open-source precision agriculture system) and Climate Corporation. Their products are powered by many of the same data sources,
particularly those that are freely available such as from weather services and Google Maps. They can also access data gathered by farm machines and transferred wirelessly to the cloud. Traditional agri-IT firms such as NEC and Dacom are active with a precision farming trial in Romania using environmental sensors and Big Data analytics software to
maximize yields (NEC, 2014).