Journal of Chemical and Pharmaceutical Research, 2016, 8(12):22-33
Research Article
ISSN : 0975-7384
CODEN(USA) : JCPRC5
22
Synthesis, Characterization and Thermal Studies of Schiff Bases derived from
2-Pyridinecarboxaldehyde and Benzaldehyde and their Complexes with Cupper (II)
and Cobalt (II)
Zainab A. Mohammed Salih1, Mariam Abdul-bary Auribic2 and Abduljleel Mohammed Abduljleel1
1Department of Chemistry, College of Education for pure sciences, University of Basrah, Iraq 2
Department of Food Science, College of Agriculture, University of Basrah, Iraq
_______________________________________________________________________________________
ABSTRACT
Two new Schiff base ligands (L1, L2) derived from 2-pyridinecarboxaldehyde, benzaldehyde and 5-amino-1,3,4-thiadiazol-2-thiol have been synthesized. These ligands were treated with Cu (II) and Co (II) chloride with a metal : ligand ratio of 1:1 to afford the four new complexes [CuL1(H2O)2]Cl2, [CoL1Cl2], [CuL2(H2O)2]Cl2 and [CoL2(H2O)2]Cl2.These ligands
and complexes have been characterized by IR, UV-visible absorption, molar conductance, magnetic measurements and atomic absorption . The data shows that the ligands are coordinate to metal atom by nitrogen to form square planer or tetrahedral complexes with Cu (II) and Co (II). The thermal properties were studied by TGA and DTG to discover the thermal stability of the complexes. The thermal behaviours of all the metal complexes were studied from room temperature to 700 oC in nitrogen atmosphere. The TGA and DTG studies of complexes expose that the decomposition continues in three steps.
Keywords: Schiff bases; Transition metal complexes; Spectrophotometric; Conductivity; Thermal analysis
_______________________________________________________________________________________
INTRODUCTION
Schiff bases are first known by Hugo Schiff [1] since 1864 and they are produced by condensation of a primary amine with carbonyl compounds [2]. The azomethine group is common structural feature of these compounds with a general formula RHC=N-R1, where R and R1 are alkyl, aryl, or heterocyclic groups which might be variously substituted [3, 4]. These compounds are also significant class of ligands in coordination chemistry [5]. Schiff base ligands have been used to synthesis a large number of the metal complexes with different electronic structures [6]. In recent years, metal complexes of Schiff bases have been presented to exhibit a broad range of biological and pharmaceutical activities, counting antibacterial, antioxidative and antitumor activities [7]. The metal complexes of Schiff bases resulted from 4- hydroxy salicylaldehyde and amines have strong anticancer activities. The Schiff base Ligand, Tetradentate N2S2, achieved by the
condensation of thiophene-2- carboxaldehyde and 1,8-diaminonaphthalene, has been used to synthesize a complex of the type, [CuL] (NO3)2 [6]. A series of new 2,5-disubstituted-thiadiazole hitched 1,2,4-triazole, thiadiazole,
1,3,4-oxadiazole and Schiff base derivatives were manufactured. All these compounds were separated for their antibacterial, antifungal and antiproliferative activity [8]. The thermal behaviours of metal complexes of Schiff bases were explored [9, 10]. The thermal analysis techniques, such as (DTG, TGA, and DTA) show a significant role in studying the thermal behaviour and the structure of metal complexes [11]. In the present work, we report the synthesis and structural studies of the complexes isolated from the reactions of copper (II) and cobalt (II) chloride with (L1), (L2).
MATERIALS AND METHODS
Physical measurements
23
[Co(NCS)4] as calibrant. The molar ratio of metals - ligands was determined by atomic absorption apparatus (A Analyst 200 Atomic Absorption Spectrometer). The thermal experiments were performed from room temperature to 700 oC in N2
atmosphere at a heating rate of 10 oC min-1using AL2O3 crucibles. A concurrent TGA and DTG have been achieved by a
model TGA Q50V20.13 Build 39 thermal analyser at College of Science.
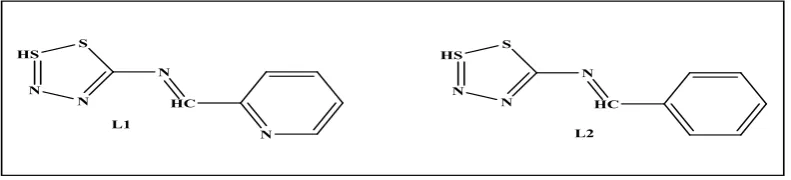
Figure 1: Chemical structure of the prepared Schiff base ligands
Synthesis of 5-amino-1, 3, 4-thiadiazole-2-thiol
To thiosemicarbazide (4.5 gm, 49.37 mmol) suspended in ethanol (20 ml) were added anhydrous sodium carbonate (5.23 gm, 49.37 mmol) and carbon disulphide (3 ml, 49.37 mmol). The reaction mixture was heated with stirring under reflux for1 hr, and then heated on steam bath for 4 hrs. The solvent was removed and the residue was dissolved in ice-water and acidified with concentrated hydrochloric acid. The product was recrystallized from ethanol to give yellow precipitate, m.p.233 C.
Synthesis of the Schiff base (L1)
5-amino-1,3,4-thiadiazol-2-thiol (0.5 gm, 3.75 mmol) in 20 ml hot ethanolic solution was added drop wise into a solution of 2-pyridinecarboxaldehyde (0.35 ml, 3.75 mmol), the mixture refluxed for 5 hours. The resulting deep orange colored precipitate was filtered and washed with ethanol followed by petroleum ether, then dried at room temperature, the purity of L1was tested by TLC.
Synthesis of the Schiff base (L2)
5-amino-1,3,4-thiadiazol-2-thiol (0.5 gm, 3.75 mmol) in 20 ml hot ethanolic solution was added drop wise into a solution of benzaldehyde (0.38 ml, 3.75 mmol), the mixture refluxed for 5 hours. After cooling the achieved precipitate was filtered and recrystallized from ethanol. The resulting solid washed with petroleum ether, then dried to obtain yellow precipitate, the purity of L2 was tested by TLC.
Synthesis of Cu (II) and Co (II) complexes of Schiff base (L1)
The preparation of the complexes were performed by adding a hot solution of each of (0.16 g, 0.951 mmole) copper chloride CuCl2.2H2O and (0.23g, 0.951 mmole) cobalt chloride CoCl2.6H2O in absolute ethanol (5 ml) to (0.20g, 0.951
mmole) of L1 in absolute ethanol (10 ml). The mixtures were refluxed with stirring for four hours, the resulting precipitates were filtered and washed with diethyl ether and recrystallized from hot ethanol, and it was then dried at room temperature. Table (1) shows the physical properties of the ligand and metal complexes.
Synthesis of Cu (II) and Co (II) complexes of Schiff base (L2)
These complexes were prepared by adding a hot solution of each of (0.16 g, 0.955 mmole) copper chloride CuCl2.2H2O
and (0.23g, 0.955 mmole) cobalt chloride CoCl2.6H2O in absolute ethanol (5 ml) to (0.20g, 0.955 mmole) of L2 in absolute
ethanol (10 ml). The mixtures were refluxed with stirring for four hours, the resulting precipitates were filtered and washed with diethyl ether and recrystallized from hot ethanol, and it was then dried at room temperature. Table (1) shows the physical properties of the ligand and metal complexes.
Table 1: Physical properties of the (L1, L2) ligands and their metal complexes
Symbols Formula Color M.P
oC Yield %
L1 C7H6N4S2 Deep orange 192-194 85
Cu L1 CuC7H6N4S2 Dark green 284-286 65
Co L1 CoC7H6N4S2 Reddish brown 335-337 74
L2 C8H7N3S2 yellow 173-175 78
Cu L2 CuC8H7N3S2 Green 272-274 73
[image:2.595.96.492.142.232.2]24
RESULTS AND DISCUSSION
The synthesized ligands and their complexes were characterized based on IR, UV-Vis spectra, magnetic susceptibility and conductivity measurements and thermal studies.
Infrared spectra
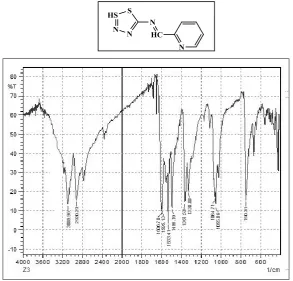
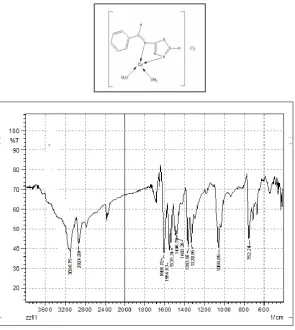
The FT-IR spectra of the Schiff base ligands L1, L2 and their complexes are given in Table 2 and figures (2-7). The azomethine vibration of the ligand (L1) at 1606 cm-1 was shifted to a higher frequencies in thecomplexes (CuL1 and CoL1) because of back bonding and decreasing the planar property after complexation [12, 13] .
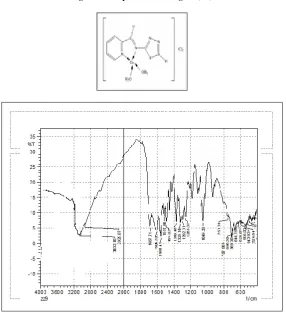
[image:3.595.146.440.219.500.2]The most signification differences in the IR spectra of the ligand (L2) and their complexes (CuL2 and CoL2) was the shift of C=N stretching frequencies to lower frequencies due to metal-ligand coordination [14,15].
Table 2: Characteristic IR bands (cm-1) of the ligands (L1) and (L2) and their complexes
Symbols Formula νC-H Alph cm-1 νC-H Arom cm-1 C=N str.cm-1 C=C str.cm-1 C-N str.cm-1
L1 C7H6N4S2 2920m 3089m 1606s 1533m 1367m
Cu L1 CuC7H6N4S2 2929w 3032w 1687s 1560m 1369m
Co L1 CoC7H6N4S2 3026w 3099w 1647m 1481m 1319m
L2 C8H7N3S2 2895w 3072w 1687s 1556m 1327m
Cu L2 CuC8H7N3S2 2987w 3001w 1606s 1523m 1356m
CoL2 CoC8H7N3S2 2924m 3095m 1606s 1564m 1363m
25
[image:4.595.157.429.416.721.2]Figure 2: I.R Spectrum of the ligand (L1)
26
Figure 4: I.R Spectrum of the complex (CoL1)
[image:5.595.150.437.373.710.2]27
Figure 6: I.R Spectrum of the complex (CuL2).
Figure 7: I.R Spectrum of the complex (CoL2).
Electronic Spectra
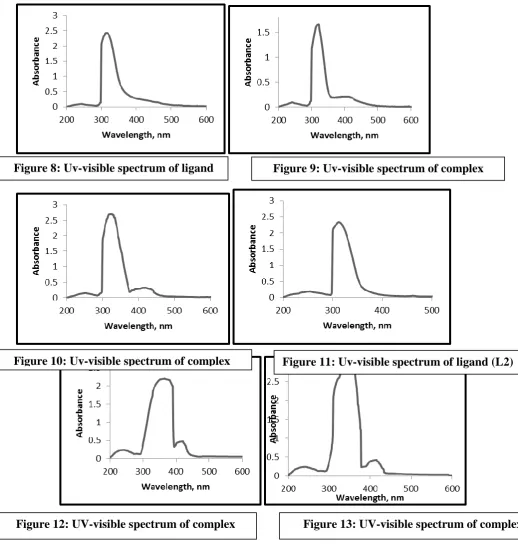
The electronic spectral data for the ligands and their complexes are presented in Table 3 and figures (8-13).The aromatic band of the ligand L1 at 242 nm is attributed to pyridine ring n → π* transition, while the band at 312 nm is ascribed to the n–π* transition of the non-bonding electrons present on the nitrogen of the azomethine group in the Schiff base [16, 17]. The ligand L2 showed aromatic band at 226 nm is attributed to benzene ring π–π* transition, while the band at 343 nm is ascribed to the n–π* transition of the non-bonding electrons present on the nitrogen of the azomethine group in the Schiff base [16, 17]. For ML1 complexes, the spectra of the complexes, showed that the azomethine chromophore n–π* transitions shifted to 322 and 330 nm for CuL1 and CoL1 complexes. The [CuL1] complex showed a broad band with maximum at 412 nm due to metal to ligand charge transfer [18, 19].
Table 3: U.V-Visible spectra of the ligands (L1) and (L2) and their complexes in DMF
λMax nm
Symbols Formula Band I Band II Band III Solvent
L1 C7H6N4S2 242 312 - Dimethyl formamide
Cu L1 CuC7H6N4S2 240 322 412 Dimethyl formamide
Co L1 CoC7H6N4S2 254 330 420 Dimethyl formamide
L2 C8H7N3S2 226 343 - Dimethyl formamide
Cu L2 CuC8H7N3S2 241 365 421 Dimethyl formamide
[image:6.595.136.454.595.756.2]28
[image:7.595.29.548.149.696.2]The [CoL1] complex displayed band at 420 nm due to metal to ligand charge transfer. On the other hand, the spectra of the complexes of ML2 showed that the azomethine chromophore n–π* transitions shifted to 365 and 354 nm for CuL1 and CoL1 complexes. Similarly, the [CuL1] complex showed a broad band with maximum at 421 nm due to metal to ligand charge transfer. The [CoL1] complex exposed band at 416 nm due to metal to ligand charge transfer (MLCT) transirions [18, 19].
Magnetic Susceptibility and Molar Conductivity Analysis
The magnetic susceptibilities and molar conductivities are listed in Tables 4. The magnetic moment μeff of the ligand complexes was measured by Faraday method [20] at room temperature. The μeff values for the complexes CuL1 and CoL1 were 1.663 and 1.721 BM respectively indicating these complexes are square planar geometry [21, 22]. While the magnetic
Figure 9: Uv-visible spectrum of complex
(CuL1)
complex.
Figure 8: Uv-visible spectrum of ligand
(L1)
Figure 10: Uv-visible spectrum of complex
(CuL1) (CuL1)
Figure 11: Uv-visible spectrum of ligand (L2)
Figure 12: UV-visible spectrum of complex
(CuL2)
29
moment values for the complexes CuL2 and CoL2 were 1.862 and 2.731 BM respectively indicating these complexes are tetrahedral [23, 24, 25]. The molar conductivities of the complexes were measured using Johns and Brad Method [26, 27] at room temperature (1x10⁻³ M) in DMF. The molar conductance values of the complexes were high indicating their electrolytic nature (Table 4).
Table 4: Magnetic measurements and molar conductance dataof the complexes
Molar conductivity Ω-1 cm2
mol-1 Effactive magnetic moment μeff (B.M.) Atomic magnetic susceptiblity XA.10-6 Correc. factor D.10-6 Molar magnetic susceptiblity Xm.10-6 Mass magnetic susceptiblity Xg.10-6 Formula of complexes Symbol of complexe s 120 1.663 1160.01 269- 891.01 1.547 [CuL1(H2O)2]Cl2 CuL1 31 1.721 1240.12 327- 913.13 1.811 [CoL1Cl2] CoL1 91 1.862 895.6 273.5- 622.1 1.146 [CuL2(H2O)2]Cl2 CuL2 73 2.731 3127.15 274.5- 2853.15 5.301 [CoL2(H2O)2]Cl2 CoL2 Atomic absorption
The molar ratio of the metals in the complexes (CuL1, CoL1, CuL2 and CoL2) was calculated by (Rast’s Camphor Method) [28] indicating that practical data were in good agreement with the suggested general formula of complexes with 1:1 molar ratio (metal : ligand).
Table 5: Atomic absorption data of the complexes
M:L ratio Metal %
Concentration from AAS ppm M.wt Complex found calculated 1:1 11.9 12.02 0.026 380.75 [CuL1(H2O)2]Cl2 1:1 11.57 11.69 0.028 340.11 [CoL1Cl2] 1:1 9.14 9.28 0.051 379.76 [CuL2(H2O)2]Cl2 1:1 10.31 10.54 0.035 375.15 [CoL2(H2O)2]Cl2
Thermal analysis of the complexes
In order to give more acumen into the structure of the complexes, the thermal behaviour of the prepared complexes has been studied to establish different decomposition process and to approve the suggested stoichiometry. The thermal behaviour of synthesised complexes was characterized on the basis of TGA and DTG method. Thermal analysis shows a significant role in studying the stability, melting point, structure and decomposition properties of the metal complexes. TGA of complexes were recorded in the temperature range between 25 to 700 oC in N2 atmosphere.
[CuL1(H2O)2]Cl2 complex
TGA and DTG curves of the [CuL1(H2O)2]Cl2 complex were represented, and the thermal decomposition takes place in
three stages. In the first stage of thermal dehydration of the complex takes place in a single step that is between 120-220 oC with mass loss 8.95% (calculated 9.1%). The two coordinated water molecules were removed in this step, and the maximum rate of mass loss indicated by DTG peak at 134.76 oC and 171.28 oC [29]. The second stage which accounts in the temperature range 220-378 oC with DTG peak observed at 315.41 oC, and the observed mass loss was recorded as 9.6% (calculated 9.8%), corresponded to the elimination of Cl atom of HCl [30, 31]. The final stage, which correspond to removal of Cl atom with a part of ligand L1 of CH3N3S2Cl [32, 33] in the temperature range 378-700 oC with the DTG
peak observed at 502.89 oC, and the observed mass loss was recorded as 39.3% (calculated 41.34%) (Figure14).
[CoL1Cl2] complex
The [CoL1Cl2] complex showed almost the same two stage decomposition process. The first stage occurred in the
30
Figure 14: TGA and DTG curves of [CuL1(H2O)2]Cl2 complex
Figure 15: TGA and DTG curves of [CoL1Cl2] complex
[CuL2 (H2O)2]Cl2 complex
[image:9.595.112.471.356.610.2]31
Figure 16: TGA and DTG curves of [CuL2 (H2O)2]Cl2 complex.
[CoL2(H2O)2]Cl2 complex
The thermal behaviour of this complex has been studied in three stages. In the first stage occurred in the temperature range 100-210 oC with mass loss 9.31% (calculated 9.23%). The two coordinated water molecules were removed in this step, and the maximum rate of mass loss indicated by DTG peak at 195.45 oC [29]. The second stage occurred in the temperature range 210-380 oC with mass loss 8.89 % (calculated 9.02 %), and the DTG peak was observed at 337.48 oC, this range correspond to the decomposition of Cl atom of HCl [30, 31]. The third stage was decomposition of ligand L2 in temperature range of 380-700 oC with mass loss 41.3% (calculated 42.34%) indicated to loss CH3N3S2Cl [32, 33] with the
DTG peak was observed at 589.77 oC (Figure 17).
[image:10.595.99.489.463.735.2]32
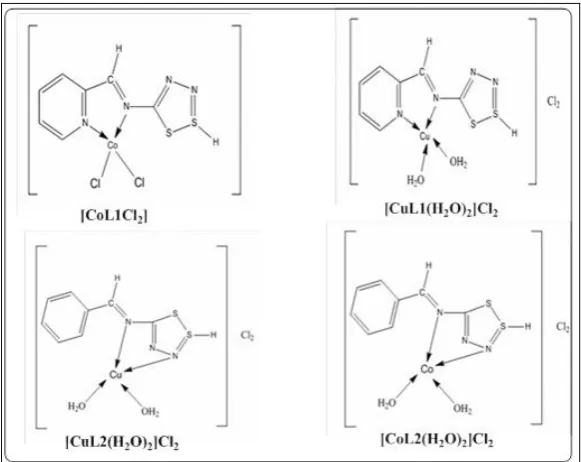
[image:11.595.147.438.105.336.2]Based on the above analytical, spectral and magnetic data together with the thermal decomposition studies, the structural formulas are proposed.
Figure 18: the expected structures of the synthesis complexes
CONCLUSION
In this paper reported the preparation and characterization of a new bidentate Schiff bases namely: (E)-N -(1,2λ4,3,4-dithiadiazol-5-yl)-1-(pyridin-2-yl) methanimine (L1) and (E)-N-(1,2 λ4,3,4-dithiadiazol-5-yl)-1-phenyl methanimine (L2) and their complexes. All the complexes are coloured, stable in air and insoluble in water and common solvents but soluble in polar solvent like DMF and DMSO. The analytical data obtained suggested 1:1(M: L) stoichiometry for all complexes. The prepared complexes have electrolytic nature. Based on the above observations of FTIR, electronic spectral data, magnetic, conductance measurements, thermal behaviours and high melting points, proposed the square planar structure for CuL1 and CoL1 complexes and tetrahedral structure for CuL2 and CoL2 complexes.
ACKNOWLEDGEMENTS
The authors are thankful to Prof. Dr. S. Shakir, Science College, Hesham for encouragement during the process of carrying out this work.
REFERENCES
[1] P. G. Cozzi ;"Chem. Soc. Rev.", 2004, 33, 410.
[2] Z. Cimerman, S. Miljanic and N. Galic, Croatica Chemica Acta, 2000, 73 (1), 81- 95.
[3] G. W. Wilkinson, R. D. Gillard and J. A .Mc. Cleverly," Comprehensive Coordination Chemistry " .Ist.ed., Pergamon press ,Oxford , England , 1987, 715-735.
[4] B. F. Perry, A. E. Beezer, R. J. Miles, B. W. Smith, J. Miller and M. G. Nascimento, Microbois., 1988, 45, 181. [5] U. Markandan, and R. Rangappan., J. Chem. Bio. Phy. Sci. Sec. A., 2012, 2 (2), 677-682.
[6] A. N. M. Salem, A. Shawky, I. H. A. Badr and M. M. H. Khalil, Egy. J. PureAppl. Sci., 2012, 063-070. [7] S. Chandraleka and G. Chandramohan, Afr. J. Pure Appl. Chem., 2014, 8 (10), 162-175.
[8] N. Rezki, A. M. Al-Yahyawi, S. K. Bardaweel, F. F. Al-Blewi and M. R. Aouad, Molecules2015, 20, 16048-16067. [9] E. T. G. Cavalheiro, F. C. D. Lemos, J. Zukerman Schpector and E. R. Dockal, Thermochim. Acta., 2001, 370, 129. [10] M. Donia, H. A. El-Boraey, M. F. El-Samalehy, J. Therm. Anal. Calorim., 2003, 73, 987.
[11] M. Amirnasr, R. Houriet, S. Meghdadi, J. Therm. Anal. Calorim., 2002, 67, 523. [12] B. Ahmed and M. Yusuf, Ind. J. Chem., 2010, 49B, 241-246.
[13] A.K. Narula, B. Singh, and P.N. Kapoor, J. Ind. Chem. Soc., 1982, 59, 1296-1302. [14] E. Giesbrecht, Pure Appl. Chem., 1979, 51, 925-947.
33
[17] P. Jayaseelan, S. Prasad, S. Vedanayaki and R. Rajave, Int. J. Chem. Environmental and Pharmaceutical Research,
2010, 1, 80-88.
[18] R. G, J. MolecularStructure, 1985, 129, 180-181.
[19] M. Usharani , E. Akila and R. Rajavel, Int. J. Advanced Scientific Technical Research , 2013, 5 ,198-206. [20] N. F. Curtis, J. Chem. Soc., 1960, 10, 4409-4413.
[21] Figgis, B. N. Lewis, J. In Lewis, J. Wilkins, R. G, Eds, Modern Coordination Chemistry; Interscience Publishers Inc.: New York, 1960, 400-454.
[22] S. S. Tandon , L. K. Thompson , J. N. Bridson and J. C. Dewan, Inorg. Chem., 1994, 33 (1), 54-61. [23] H. A. Bayoui, M.A. Alaghaz and M. S. Aljahdali, Int. J. Electrochem. Sci., 2013, 8, 9399 - 9413. [24] J. Anacona and J. Santaella, Molecular and Biomolecular Spectroscopy, 2013,115, 800-804. [25] S. Ur-Rehman, M. Ikram, S. Rehman and N. Jan, J. Mex. Chem. Soc., 2011, 55(3), 164-167. [26] J. Kohout and J. K. Smogrovic, ChemickeZvesti, 1968, 22, 481-492.
[27] G. Jones and B. C. Bradshaw, J. Am. Chem. Soc., 1933, 55, 1780-1800. [28] S. Wawzonek , J. Chem. Educ., 1972,49, 399 .
[29] K. W. Pratt, W. F. Koch and Y. C. Wu, PureAppl. Chem., 2001, 73, 1783-1793.
[30] K. T. Joshi1, A. M. Pancholi1, K. S. Pandya and A. S. Thakar, J. Chem. Pharm. Res., 2011, 3,(4),741-749. [31] P. M. Alex and K. K. Aravindakshan, E. J. Chem., 2009, 6 (2), 449-458.

![Figure 14: TGA and DTG curves of [CuL1(H2O)2]Cl2 complex](https://thumb-us.123doks.com/thumbv2/123dok_us/8737661.889131/9.595.112.471.356.610/figure-tga-dtg-curves-cul-h-cl-complex.webp)
![Figure 17: TGA and DTG curves of [CoL2(H2O)2]Cl2 complex](https://thumb-us.123doks.com/thumbv2/123dok_us/8737661.889131/10.595.110.476.70.326/figure-tga-dtg-curves-col-h-cl-complex.webp)