Ecosystem Controlling Using Identification of Animal
Based on Deep Learning and GLCM (Gray Level
Co-occurrence Matrix) Method
Ari Purno Wahyu
*, Feri Sulianta
Widyatama University, Indonesia
Copyright©2019 by authors, all rights reserved. Authors agree that this article remains permanently open access under the terms of the Creative Commons Attribution License 4.0 International License
Abstract
Indonesia is the largest country in Southeast Asia. Plantations in Indonesia are still traditionally and use irrigation systems that are housed in reservoirs and ponds. While plantations in West Java generally averaged near springs and near nature preserve locations, which has a benefit impact of the available amount of water. The negative impact is entry on areas by animals and pests, which will damage Plantation grounds and other agricultural land. The animals generally go down at night when the time of the harvest season arrives. Currently, prevention of destructive animals is done by making a trap, but it is very dangerous for animals and farmers. This can lead to more severe death and destruction, especially if the dead are protected animals. One of the safe technologies, which can be used is by installing camera in the plantation area. This system is connected with the computer remotely and can operate automatically. This system is equipped with data on all types of animals that are protected. The data is processed with the Deep Learning Method and GLCM. The system will identify the animal in the category of pests or not by recognizing the pattern, texture and posture of the animal, for example if the system distinguished the wild boar. This system is considered effective and does not interfere the ecosystem and animal habitat. The addition of thermal camera and remote sensing are very effective to monitor the condition of the plant. This system is effective reduce and avoid animals killing and able to control stability the ecosystem.
Keywords
Ecosystems, Deep Learning, GLCM1. Introduction
Maintaining ecological balance in an ecosystem is an important thing in the modern era, where human development and mobility towards development is
2. Theoretical Basis
Observation techniques for wild herds are an important task in safeguarding the ecology. Increasing population growth has pushed the development and economic sectors to exploit the wild nature, disrupting the habitat of animal populations and their natural habitat. More dangerous is the destruction of animal species that live in their natural habitat. The wildlife monitoring and guarding system are intended as a regulatory process to balance resource use and conservation and can be sustainable. [1]
The type of technology that has been used for animal monitoring is using radio waves and WSN Band the use of GPS (Global Positioning system). This is used for tracking systems that put on cameras to capture moving objects, while the most popular and easy for implementation. [2]
Each visual data which has been taken can be used as evidence of research by scientists to answer the interrelation between science and ecological systems. With the help of technology, we can monitor protected species, for example fox species begin to be rarely found, because rabbits that are prey are rarely seen. The key answer is the answer to the importance of maintaining the ecosystem, so that the animal population is maintained and balanced. [3]
Pattern recognition and selection of animals are still considered difficult. Now researchers are still developing new patterns and methods that are considered effective and the right solutions. In general, this system is detected by animal recognition and matching with binary methods for classification data. [4]
Measurement of plant growth and productivity is important for the future. The survey and monitoring system used today can use UAV technology to capture photogrammetry images. The image data can be used for spatial measurements of plants, which are measured randomly. Photogrammetric images have a standard that can capture 785 images and display visual data in 3D form and can be used for growth and the purpose of crop productivity and maintain ecological balance. [5]
In previous studies survey, techniques for forest and plant areas used visual and aerial photographic display data, but they were not very accurate, the data could not recognize plant characteristics and stock quantities in previous studies of forest and plant area survey techniques using visual and image data aerial photography, but the data is not very accurate, the data cannot recognize the characteristics of plants and the amount of stock, in a large area, aerial photographs are able to detect grass accuracy but still dependent on altitude. [6]
3. Research Method
The process of selection in animals is not only on the body of the animal itself but also very dependent on the
heat of the sun. And the distance is very influential. This factor makes a segmentation process, which need to be overcome and used. The holding process will always be used for reading each frame by calculating the temperature (t) at an image so that the threshold value becomes. [7]
th = ~t + c
where the value (c) ensures that an object is hotter than the background monitoring tools. Such infrared tomography has been widely used in various fields, such as civil engineering, security, rescue operations, border patrols, humanity, health, biology and ecology. These tools can real-time present the temperature to conditions below -273 Celsius, the radiation produced by an object will be emitted from the body, for example it can be calculated by the formula Stefan-Boltzmann´s law. [8]
Qrad = Radiated heat by object A = Surface (m2)
σ = Stefan- Boltzmann´s constant
(5, 67·10-8 W/m2/k4)
ξ = Emissivity (0, 95) Ts = Surface temperature (K) Trefl = Reflected temperature (K)
For several decades, remote sensing technology has become a mainstay and effective tool for irrigation system monitoring, weather conditions and location. In the concept of modern agriculture, the benchmark of success is able to increase the quality of crop production. This can be supported by accurate weather and information sources, where the weather is very affect the condition of plants that depend on water and irrigation systems.[9]
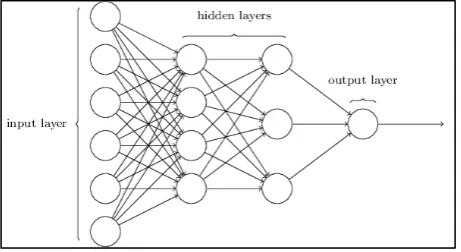
[image:2.595.307.538.598.724.2]Selecting the characteristics of an image can use a neural network algorithm. This feature will be an input that is adjusted to the number of nodes. The number of neurons is itself a neural network algorithm, which can produce several hidden layers by matching the input type that is non-linear processing.[10]
Figure 2. Contrast formula Explanation:
Contrast is a calculation of data from a matrix element, in which the object is taken. This value is calculated from the amount of spread of intensity in an image.
4. Implementation System
In testing this system, image research and processing were analyzed using neural network algorithms, where all input and weighting data were taken from datasets of image of plants and animals that had been formatted from the original image into Gray Level Co-Occurrence Matrix and RGB data. That value was then multiplied by the number of neurons in the network algorithm.
Figure 3. Correlation Formula
Explanation:
Correlation is used to determine the degree of grayness of an image to be taken. Correlation value is taken from the number of pixels that convert to linear values of each pixel of data taken.
Explanation:
Table 1 is the stage of the neural network algorithm. This algorithm will be used to calculate the Gray Level Co-Occurrence Matrix (GLCM) data feature taken from an extraction of animal and plant data. This feature will compare texture data that has been converted into binary numbers into neurons that will be stored in a database. Each neuron will represent one type of characteristic and texture of animals and plants.
Table 1. GLCM Data for Leaf Texture
Table 2. LCM data for animal Texture
Explanation:
Table 2 above is the process of reading the GLCM value on animal objects taken by value in random. The data will be used as sample data to be compared with other objects as data tanning.
Figure 4. Function camera configuration Explanation:
Figure 4 above is the setting process and camera configuration that is used to be able to connect with the microcontroller. Setting starts from pixel width, the camera ID is used. The ‘Id’ usage system is very useful when it will be installed in parallel, then the 'getCameraInfo' function serves to display Id and the type of camera used.
Explanation:
Figure 5 is the process of converting input data from a camera into several frames. Frames containing animal or plant objects will be processed by using the GLCM technique and changing the image format to RGB
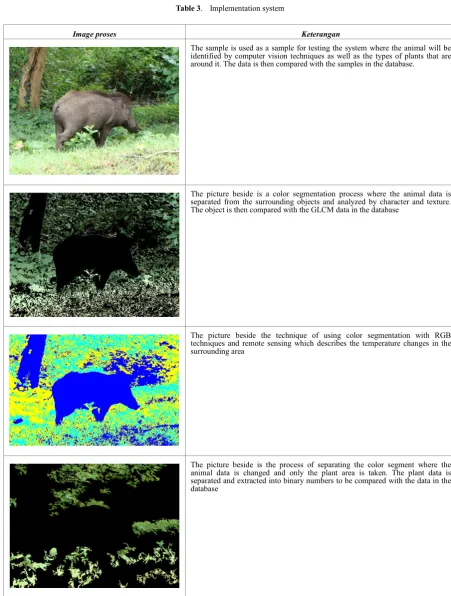
Table 3. Implementation system
Image proses Keterangan
The sample is used as a sample for testing the system where the animal will be identified by computer vision techniques as well as the types of plants that are around it. The data is then compared with the samples in the database.
The picture beside is a color segmentation process where the animal data is separated from the surrounding objects and analyzed by character and texture. The object is then compared with the GLCM data in the database
The picture beside the technique of using color segmentation with RGB techniques and remote sensing which describes the temperature changes in the surrounding area
5. Conclusions
In the above research, the implementation of the GLCM technique from recognizing an ecosystem pattern can be applied by simply using the camera. The system compares two objects at the same time in recognizing the types of animals and plants with comparative data in the database, namely matrix number data. The suggestion for further research is to add more GLCM data types, so that the system can recognize varied objects
REFERENCES
[1] Ozuomba, S., Enyenihi, J., & Rosemary, N. C. (2018). Characterisation of Propagation Loss for a 3G Cellular Network in a Crowded Market Area Using CCIR Model. Review of Computer Engineering Research, 5(2), 49-56. [2] Hung Nguyen; Sarah J. Maclagan; Tu Dinh Nguyen,
"Animal Recognition and Identification with Deep Convolutional Neural Networks for Automated Wildlife Monitoring," in Conference Paper, 2017.
[3] A. F. O’Connell; J. D. Nichols; K. U. Karanth, "Camera traps in animal ecology: Methods and Analyses.," Springer Science & Business Media, 2010.
[4] XIE, Z., A. SINGH;J. UANG, K. S. NARAYAN ; P. ABBEEL., "Multimodal blending for high-accuracy instance recognition," IEEE/RSJ International Conference
on Intelligent Robots and Systems., Vols. ISBN
978-1-4673-6356-3., no. DOI: 10.1109/IROS.2013.669666 6., p. 2214–2221, 2013.
[5] Udaya Vepakomma; Denis Cormier; Nelson Thiffault, "POTENTIAL OF UAV BASED CONVERGENT PHOTOGRAMMETRY IN MONITORING REGENERA TION STANDARDS," The International Archives of the Photogrammetry, Remote Sensing and Spatial Information Sciences, Vols. XL-1/W4, 2015.
[6] Murcinkova, Z., Murcinko, J., & Adamcik, P. (2016). The Multi-Parameter on-Line Monitoring System Applied for Rotating Machinery. Review of Industrial Engineering Letters, 3(2), 19-28..
[7] "Systems, F.C.V. Thermal Imaging," 2014. [Online]. Available: http://www.flir.com/uploadedfiles/eng_01_how far.pdf.
[8] ASHISH; VIJAY, "REVIEW ON THERMAL IMAGE PROCESSING TECNIQUES FOR MACHINE CONDITION MONITORING," International Journal of Wireless Communications and Networking Technologies, vol. 3, no. 3, 2014.
[9] Dami, A., Inuwa Kuchali, B., & Ayuba, H. K. (2017). The Influence of Climate Variability on Hadejia-Nguru Wetlands, Yobe State, Nigeria. International Journal of Geography and Geology, 6(5), 105-112.
[10]Mahmud, M. A. R., Rahman, M. M., & Miah, M. S. (2016). Performance Analysis of Routing Protocols for CBR Traffic in Mobile Ad-Hoc Networks. Journal of Information,