Journal of Chemical and Pharmaceutical Research, 2014, 6(7):409-414
Research Article
CODEN(USA) : JCPRC5
ISSN : 0975-7384
China stock market correlation mining algorithm based on FP-Tree
Xu Tiansheng*, Qin Aiming and Sun Ruiqi
Capital University of Economics and Business, China
_____________________________________________________________________________________________
ABSTRACT
The research is based on FP-Tree algorithm for mining frequent phase sets that use hash tables and conditional probability formula to get stock correlation rules between the ups and downs. Ten different China A stocks of a quarter in 2013 are used for testing the FP tree method developed in this paper. The results show that there are correlations in different categories in China A stocks using FP-Tree algorithm. The correlations found in this paper can be used for the investors to make a decision. The algorithm proposed can be applied to stock arbitrage, long-term buying and selling contracts, and composing investment portfolios.
Key words: FP-Tree; Stock association rules; Smallest frequent item set; Hash table
_____________________________________________________________________________________________
INTRODUCTION
Through a number of domestic and foreign stock analysis distribution system research we found that there are few researches using different stocks’ correlation to analyze China A stock [1]. Especially stock negative correlation among the analysis is really rare [2]. Although there are some researches for data mining which use the Apriori algorithm, these studies are not as efficient as expected so that we chose the FP-Tree algorithm to get a better correlation to study the correlation of different China A stock. For example, the rise of China Oil (China A stock NO.601857) price may cause a decline of Water Fisheries (China A stock NO.000798). On the other hand, China Sinopec (China A stock NO.600028) and China Oil price raise more than 80% in correlation. The correlation between stocks is very important for the investment. The association probability of two or more stocks in price changes can be approximated as the correlation coefficient. This correlation coefficient can be used to build a portfolio or to make some combination of non-systematic risk minimization [3]. Furthermore, it is also a material for the investors or experts in financial area to analyze the stock market. By using the algorithm proposed in this paper, they could get an appropriate ratio of investment and risk which can be used for making a better set of stocks.
RESEARCH METHOD
First, the stock analysis method in this paper use relational database to generate the data, clean the warehouse and then separate transaction database from data warehouse. With the new transaction database, support degree is generated for setting the corresponding item header table. Then FP-Tree is constructed through multi-iterations to get the smallest frequent item sets. The smallest frequent item sets stored in database are called to set confidence with relation method and construct hash table to perform statistical and computational calculation. Finally, the correlation rules can be acquired [7-8].
GENERATING TRANSACTION DATABASE
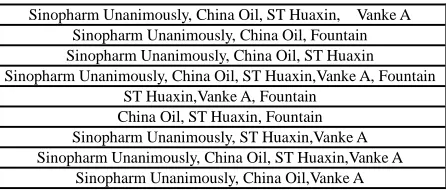
[image:2.595.196.419.508.603.2]For data mining we need to export data from the database to restore the data in the form of transaction. Then the minimum support degree is set as Min-sup. Exported data have a certain format for the need of data mining as shown in Table 1. For example, a comma or a space is set between every two stocks. Table 1 shows some transaction records representing risen stock in a day (Vanke A China A stock NO.000002; ST Huaxin China A stock NO.000010; Sinopharm Unanimously China A stock NO.000028; Pingan Bank China A stock NO.000001; Fountain China A stock NO.000005).
Table 1: Typical transaction dataset
Vanke A, China Oil, ST Huaxin, Sinopharm Unanimously China Oil, Water Fisheries, Sinopharm Unanimously, Fountain
China Oil, ST Huaxin, Sinopharm Unanimously
VanKe A, China Oil, ST Huaxin, Water Fisheries, Sinopharm Unanimously, Fountain VanKe A,ST Huaxin, Fountain
China Oil, Huaxin, Fountain VanKe A, ST Huaxin, Sinopharm Unanimously
VanKe A, China Oil, ST Huaxin, Ping An Bank, Sinopharm Unanimously VanKe A, China Oil, Ping An Bank, Sinopharm Unanimously
OBTAINING FREQUENT ITEM SET
Scan transaction database, order each stock by frequency of occurrence and remove the stock whose frequency less than the preset minimum support degree Min-sup. It needs to scan the database twice in this process. It is supposed that default value of Min-sup mentioned above is 3, and the frequency of occurrence of each stock in the transaction databases will be
{Sinopharm Unanimously:7, China Oil:7, ST Huaxin:7, Vanke A:6,
Fountain:4,Water Fisheries:2(deleted), Pingan Bank:2(deleted)}.
After deleting the shares whose frequency is less than the minimum support degree, the remaining part is first frequent item set, called as F1.
SORTING FREQUENT ITEM SET
The database is scanned again and data records in each of their shares should be ordered by F1. During the process those stocks which do not appear in the F1 will be removed. After the scanning process, the arranged result is shown below in Table 2.
Table 2: Sorted frequent item set
Sinopharm Unanimously, China Oil, ST Huaxin, Vanke A Sinopharm Unanimously, China Oil, Fountain Sinopharm Unanimously, China Oil, ST Huaxin Sinopharm Unanimously, China Oil, ST Huaxin,Vanke A, Fountain
ST Huaxin,Vanke A, Fountain China Oil, ST Huaxin, Fountain Sinopharm Unanimously, ST Huaxin,Vanke A Sinopharm Unanimously, China Oil, ST Huaxin,Vanke A
Sinopharm Unanimously, China Oil,Vanke A
The selection of variables is based on the t test of Student or F test of Snedecor for significance of the regression coefficients. We used the same level of significance for the introduction and the exclusion of a variable in the model. Two theoretical levels were retained: 0.15 and 0.05.
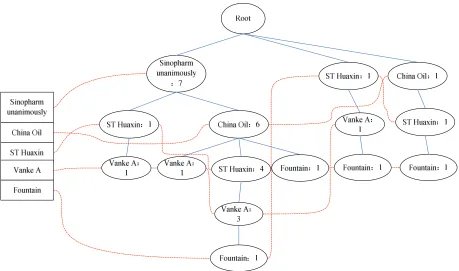
FP-TREE CONSTRUCTION
of the tree from F1 and traverse to the root node. The FP-Tree structure is shown in Figure 1.
Figure 1. Constructed FP-Tree object head
TRAVERSING FP-TREE
Find frequent item in FP-Tree. Every item in frequent item header table is traversed and the each traversed item is called suffix pattern (post-model). All the correspondent nodes to current suffix pattern in the FP-Tree can be found. Use them as starting points and the ancestral root nodes as end points. The traversal track of the nodes in the process from the starting point to the end forms the path. If Starting point is M, the corresponding path is also M. During traversing the path, it is necessary not only to output the stock leaf node name but also to output their suffix count. It should also be noted that the output of each path should be reversed as from the end to the beginning. For example, start from "VanKe A" to traverse FP-Tree, and then find every "VanKe A" node. Traversal path results are as Table 3.
Table 3: "Vanke A" node traversal results
Sinopharm Unanimously: 1, ST Huaxin: 1, Vanke A: 1 Sinopharm Unanimously: 1, China Oil: 1, Vanke A: 1 Sinopharm Unanimously: 3, China Oil : 3, ST Huaxin: 3, Vanke A: 3
ST Huaxin: 1, Vanke A: 1
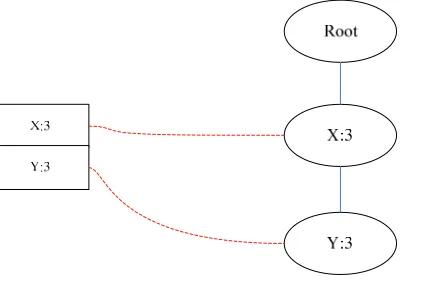
CONDITIONAL PATTERN BASE
The results can be found from the above table is each path contains stock "Vanke A". That means "Vanke A" can be omitted. The result obtained is called Conditional Pattern Base (CPB). CPB obtained from the above table is shown as Table 4.
Table 4: "Vanke A" CPB
Sinopharm Unanimously: 1, ST Huaxin: 1 Sinopharm Unanimously: 1, China Oil: 1
Sinopharm Unanimously: 3, China Oil: 3, ST Huaxin: 3, ST Huaxin: 1
[image:3.595.77.536.93.364.2]Figure 2. single branch FP-Tree
There will be only one path found after the traversal process has been executed many times at this point. All combinations of the tree with its suffix pattern can be output. If the current suffix pattern is H, the output is expressed as (3, X, H), (3, Y, H), (3, X, Y, H). Each element in this collection is a part of item sets what we're looking. At this point the recursion for this stager ends.
With this algorithm in the above example all frequent item sets can be calculated. It is supposed that the Min-sup value is set to 3, the results using FP-Growth algorithm to execute recursive iteration are shown in the following Table 5.
Table 5: Mining results of frequent item sets
Support
Degree Item sets results
5 ST Huaxin China Oil
6 China Oil Sinopharm Unanimously 5 ST Huaxin Sinopharm Unanimously 4 China Oil ST Huaxin Sinopharm Unanimously
5 ST Huaxin Vanke A
5 Sinopharm Unanimously Vanke A
4 China Oil Vanke A
4 ST Huaxin Sinopharm Unanimously Vanke A 4 Sinopharm Unanimously China Oil Vanke A
3 ST Huaxin China Oil Vanke A
3 Sinopharm Unanimously ST Huaxin China Oil Vanke A
3 ST Huaxin Fountain
3 China Oil Fountain
ASSOCIATION RULES
Association rules can be generated after the excavation of all frequent items. It is necessary to explain the following possibilities before describing the method of generating association rules. Suppose one frequent item is (A, B, C, D) and its support degree is 3, then all proper subsets of the frequent item sets are bound in this frequent item sets and the support degree of the proper subsets are greater than 3 or equal to 3. Mathematical formula can be described as (1).
)
(
sup
)
of
subset
proper
(
sup
port
A
>=
port
A
(1)Proper subset of every frequent item except the empty ones must be calculated to generate correlation rules. Assume a certain proper subset of set I is M, the correlation rules as well as its strength is shown in (2):
)
(
sup
)
(
sup
))
(
(
M
port
I
port
M
I
M
P
−
>
−
=
(2)RESULTS
During the data mining experiment, the first step is to set up the correlation to up or down , and then set the mining’s minimum support degree and the minimum changing rate. after submitting the above data, set up the minimum confidence level. The last step is to calculate the correlation rule. The data used in the experiment is 20 stocks data of three months in China A stock to dig up correlation between rising and falling of the stock. The support degree is set 3 and the minimum changing rate is set 0.2. The confidence degree is set 0.4, which means that minimum probability is 40%.
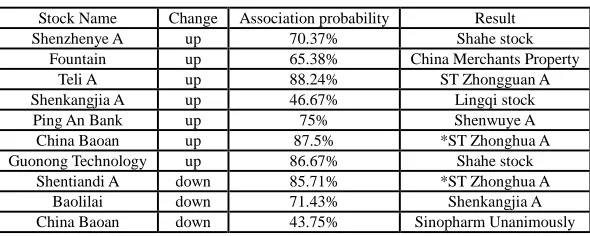
[image:5.595.159.454.225.343.2]The most important correlation rules are shown as Table 6. (Shenzhenye A China A stock NO.000006; Teli A China A stock NO.000025; etc.)
Table 6: Major mining results
Stock Name Change Association probability Result
Shenzhenye A up 70.37% Shahe stock
Fountain up 65.38% China Merchants Property
Teli A up 88.24% ST Zhongguan A
Shenkangjia A up 46.67% Lingqi stock
Ping An Bank up 75% Shenwuye A
China Baoan up 87.5% *ST Zhonghua A
Guonong Technology up 86.67% Shahe stock
Shentiandi A down 85.71% *ST Zhonghua A
Baolilai down 71.43% Shenkangjia A
China Baoan down 43.75% Sinopharm Unanimously
According to Table 6, the correlation rules can be seen apparently. For example, Teli A and ST Zhongguan A's association probability is 88.24%, which means that Teli A stock rises when ST Zhongguan A stock rises mostly. Baolilai's decline also seriously affects the Shenkangjia A. oppositely the association probability of Shenkangjia A and Lingqi stock is much less than 50%, which means that the correlation of the two stocks is week. China Baoan also has little influence to the Sinopharm Unanimously because that the association probability is only 43.75%.
Investors can use the correlation probability to calculate the peak of the ratio of revenue and risk in Markowitz's best investment formula. According the peak value gained the optimal portfolio for trading and market can be acquired correctly. In the meantime, the correlation rules can also be applied for the investors to find the relations of different sectors and industries in stock market.
DISCUSSION
The priority of this research is to get the correlation of the stock's rising and falling based on FP-Tree algorithm. The general correlation rules that are excavated from the algorithm may bring some economic benefits. The data warehouse used in the experiment is constructed after cleaning and sorting the original database and then the database is converted into the transaction database for data mining. The stock’s correlation rules are calculated from the transaction database. The historical data of China A stock data of three months are used to obtain the stock’s correlation rules. This correlation results for financial speculation and traders holding are very meaningful. It can tell us how to joint two different stocks to find their correlation for trading and how to predict the trend. The most important is that association probability can be approximately regarded as the price movement relation between two different stocks. The relation can be seen as a positive correlation coefficient, so that we can use Markowitz portfolio theory to calculate the optimal portfolio for each investor. At the same time, it can also be used to minimize the risk of non-system and make the revenue risk ratio reach the summit. The proposed algorithm plays an important role for not only stock trading but also futures business and hedging.
The correlation rules acquired based on the algorithm proposed in the paper may help find some inner connection among different shares. The rules of various sections or different industries imply some inner relationship. For example, an oil company may have a negative correlation with auto industry. Through the stock association we could have a rough prospect of sector industries in different areas and find the underlying reasons.
of FP-Tree posed is. The scale of FP-Tree can decreased to some extend by increasing the support degree. But constantly increasing support degree is not a good solution to control FP-Tree scale. The solution suggested is that it should be output with direct recursion when there is a single node tree branch. Server clusters can be used to share memory pressure.
CONCLUSION
The algorithm to study the correlation between different stocks is developed in this paper. Based on the association rule, Pareto optimal portfolio can be achieved. Income risk ratio can be set to the highest value. The generated correlation rules that are excavated may be used to guide the investors to make a correct decision in Chinese stock trading, futures business, and hedging. The correlation rules acquired based on the algorithm proposed in the paper may help find some inner connection among different shares. Although it is based on data from China A stock, the proposed algorithm is not limited to China stock trading but other countries. The algorithm can be applied for risk management and futures trade in other countries.
Acknowledgments
This research was supported by the Funding Project for Research Improvement by CUEB(No. 2014XJG022), and the Beijing Municipal Education Commission Foundation of China (No. KM201110038002). It was also supported by Level of Scientific Research Improving Project of Beijing Municipal Education Commission and Beijing philosophy and social science project(No. 13SHB015).
REFERENCES
[1]Zhu Hong. Mining and updating algorithm based on FP-Tree maximum frequent item sets, Southeast University Computer , 2011.
[2]Zheng Xiaoling. Information Systems Analysis and Design, People Post Press, 2006.
[3]Li Yun. Research and application of data mining association rule mining method, Xi'an University of Electronic Science and Technology University, a master's degree thesis, October 2007.
[4]Lily Kuang. Apriori algorithm and deep discussion Fp algorithm, Hefei University master's degree thesis, July 2010.
[5]Du Zhang. Machine Learning and Software Engineering.Department of Computer Science, California State University, Department of Computer Science, University of Illinois, 2003.
[6]Li Shuqing. JAVA development of generic examples Golden, Electronic Industry Press, 2009.
[7]Nico de Wet. Using UML Models for the performance analysis of network system, Data Network Architectures Group, Computer Science Department, University of Cape Town, South Africa, 2005.
[8]Andrea De Lucia. An experimental comparison of ER and UML class diagrams for data modelling, Department of Mathematics and Informatics, University of Salerno, 2010.