2017 2nd International Conference on Computer, Mechatronics and Electronic Engineering (CMEE 2017) ISBN: 978-1-60595-532-2
Crop Disease Identification Research Based on Image
Segmentation Technology
Lei-lei DENG, Bo GU and Hui ZHOU
*College of Information Technology, Jilin Agricultural University, Changchun 130118, China
*Corresponding author
Keywords: Image segmentation, Regional location, Crop, Recognition processing.
Abstract. The image processing and pattern recognition technology of identifying the crop disease are rapid and simple in order to provide the required information by taking measures in time. The paper will use the crop disease based on image segmentation processing centered to utilize the segmentation theory of theshold segmentation and edge detection represented, and the segmentation method by combination of mathematical morphology, fuzzy clustering and specific theory for research. The data shows that the proposed algorithm keeps fit within the large image retireval system about the disease of the crop.
Introduction
In the practical production, the crop disease is an important factor limiting the growth of farmers, which causes huge loss and a direct influence on the crop market. Farmers mostly depend on its own experience to restore the crop disease. And having gained some effect, but due to farmers are not experts and recognition capability is limited. The traditional disease detection method not only time consuming, but also impacts the forecasted accuracy of the crop disease. With the rapidly developing of computer image processing and identification technology, it is possible for the crop disease to accurately identify, timely detection, adopt right measures and reduce losses.
The Definition of Image Segmentation
The computer programing technique might prefer the image segmentation, which provides the service locators to describe. R is set to the image to be split in a set. Description (1) says that the subset combination is equal to the collection of image. Description (2) says that the two of these subsets are necessary to be disjointed, which the each segmentation is independent. Description (3)
shows that all elements of the each subset are connected [1]. Description (4) says that all elements of
the different subset are disconnected. Description (5) says that the each subset must be non-null. It
is truly successful when the useful region can be extracted [2, 3].
=R (1)
i, j, i j, Ri Rj= (2)
i=1, 2, ……, N, P(Ri)=T (3)
i, j, i j, P(Ri Rj)=F (4)
i=1, 2, ……, N, Ri is not empty (5)
Threshold Segmentation Method
The threshold segmentation method is the earliest method to study the image identification of the
divide the sagittifolia disease leaf of micronutrients such as calcium, magnesium and iron. On the basis of it, the domestic Chen Jiajuan try to use the local threshold method to extract the bar chart feature and adopt local threshold segmentation to segment the cotton disease image from the background in a laboratory environment. In 2009, the British scholar in the plant disease recognition identification system, taking the banana and plantain black leaf streak as an example, and using the optimal threshold of the bar chart segmentation method, the lesion and the background of the leaves are successfully separated. The characteristic of the threshold segmentation method are that is both simple and space-efficient, the difficulty lies in the selection of threshold.
Different Identification Methods
Edge Detection Method
In 2011, Baumt uses the Soble edge detection algorithm to separate the wheat plaque from the background. In 2012, He Dandan uses the algorithm is designed by combining the minimum external rectangle algorithm with the median filter and the Canny operator to propose the rice leaf edge detection algorithm based on multi-strategy fusion technology. The edge detection method is based on the change of the gray value of the pixel on the edge in between the different region. Although the edge detection method has such features as easy operation, the disadvantage of the
segmentation efficiency depends on the edge detection operator and the robustness is poor [5].
The regional information provides important information for the main location of the image, which provides the important basis for the segmentation of the target object. The study found that the region where the gray value of the image violently would normally be the edge of the object. The edge of the image is the important and useful information in the image segmentation. The characteristic of the pixel of the image along the edge becomes incontinuous, which can be a great
help by finding the edge of the object in the image [6].The researchers found that the signal
presented along the edge of the form can be roughly classified into three ways. The three types are the stepped edge, the roof-edge and the linear edge. The characteristic of the stepped edge is that the gray value of changing abruptly up and down in the steady state, and the balance is maintained after it complete the change. The roof-edge is characterized by the fact that the gray value in the state is slow rising and slow descending. And the characteristic of the linear edge is that the gray value in the steady state suddenly upward and downward after the dramatic change, however, the gray value
of the state has gone through a series of changes can return to the original state soon [7, 8].
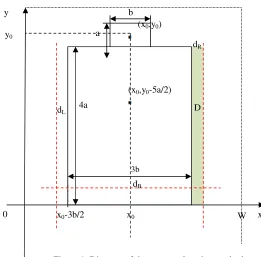
Accurate Location Method
Figure 1. Diagram of the accurate location method.
Fuzzy Clustering Method
Ruspin first proposed the fuzzy clustering theory in 1969 based on the unsupervised learning of
pattern recognition [9]. In 2012, JawareTH utilizes the Otsus algorithm to calculate, and the edge of
the infected image is eliminated by using the optimized K-means clustering method [18]. The
algorithm is proved to be an efficient and high-precision segmentation algorithm. In 2012, Li Zhen uses the model of Lab color based on k-means clustering method to identify the color image of the red spider. The fuzzy clustering method dictates the parent-child relationship of the each pixel of image has fuzziness, and the fuzzy clustering method has been used abroad in recently years. A massive amount of the crop disease image data will get the feature of ambiguity and uncertainty. The membership function of the fuzzy clustering will be modeled with the feature of ambiguity and uncertainty, therefore it is not only suitable for still the image segmentation. The fuzzy clustering method also has flaws, the sensitivity of the noise and initialization data and the calculation of algorithm are the practical application of the agricultural production to become further improvement and optimization.
Image Segmentation Algorithm
The Flow Diagram of Segmentation Algorithm
We will illustrate the image segmentation algorithm by considering the simple process shown in Figure 2.
D (x0,y0)
(x0,y0-5a/2)
0 x
y b
a
4a
3b
x0
y0
x0-3b/2 W
dL
dR
Figure 2. Flow chart of the diseased Image Segmentation Algorithm based on pre-detection.
Segmentation Result
The paper experiments with the 1500 images to choose the disease image in the actual marketing network system consist of the disease image, not diseased image, simple background image, complex background image and the color of the black and gray. The maximum between-cluster method of the divisions, shown in the diagram as below. Firstly, the size of the segmented image (unfilled) for calculation. Then, the target area is filled with the segmented image and the disease is filled. The degree of crop disease can be calculated by the corresponding image pixel spot, where M and N are the width of the image in pixel and the height of the image in pixel, and the maximum number of the black and white pixels in the binary image is divided by the maximum between-cluster method. The binary image of the disease in the black pixel filled with the black pixel, and called the binary image in Matlab. The disease area has been filled, the white pixel of the disease area is filled again and the full black pixel is filled after the statistical filling. Finally, can
obtain the percentage of the leaf disease is L = (X1 - X2) / X3 × 100%.
Evaluation of the Result
The size of the crop disease is calculated by the gray processing of the image, the removal of the background quantity, the image segmentation, the filling of the pixels in the crop disease area. Experimental results show that the average danger degree of tomato, pepper, rice, citrus and maize
Start
End Enter the image
Whether for the disease?
Disease No disease
Image edge detection Image edge detection
Precise face location No face location
Initialization of Crabcut algorithm
The iterative segmentation method for energy minimizing of Crabcut
The output
disease accurately. According to the segmentation results, the maximum between-cluster is not ideal for the segmentation effect. As the lesion area to deal with, so the algorithm optimization needs to be further improved.
Conclusions
The paper consider finding the available method of image processing to resolve the problem by measuring the damaged degree of crop leaves. Firstly, the sample image is executed to pre-process. Then, using the maximum between-cluster segmentation algorithm to catch the pest and pest-free areas of crop leaves. Finally, a method to the pest area is used to filling of picture element, the crop disease degree percentage is calculated. The method is suitable for the determination of many kinds of crop diseases, but leaf disease spot is still indivisible, which need to be futher perfected.
Reference
[1] Zhang Shuifa, Wang Kaiyi, Zu Qin, et al, Algorithm for Damaged Leaf Segmentation Based on Block Mark. J. Transactions of the Chinese Society of Agricultural Engineering (Transaction of the CSAE). 30, (2014).
[2] Zhang Fang, Wang Lu, Fu Lisi, Recognition of Cucumber Leaf Disease Based on Support Vector Machine. J. Journal of Shenyang Agricultural Uinversity. 45, (2014).
[3] Diao Zhihua, Wang Huan, Song Yinmao, et al, Segmentation Method for Cotton Mite Disease Image under Complex Background. J. Transactions of the Chinese Society of Agricultural Engineering (Transaction of the CSAE). 05, (2013).
[4] Chen Jinwei, Wu Bing, A Otsu Threshold Segmentation Method Based on Rebuilding and Dimension Reduction of the Two-Dimensional Histogram. J. Journal of Graphics. 36, (2015).
[5] Zheng Jiaming, Chen Zhaojiong, Connectivity Constrained Graph-Cut for Fast Interactive Image Segmentation. J. Journal of Computer-Aided Design & Information Technology. 03, (2011)
[6] Han Shoudong, Zhao Yong, Tao Wenbing, Sang Nong, Gaussian Super-Pixel Based Fast Image Segmentation Using Graph Cuts. J. Acta Automatica Sinica. 01, (2011).
[7] Li Shuanqiang, Feng Qianjin, Liver Tumor Segmentation Using Graph Cuts Based on CUDA. J. Chinese Journal of Biomedical Engineering. 05, (2011).
[8] Chen Xiaodan, Li Siming, Research Progress on Image Segmentation. J. Modern Computer (Professional Edition). 33, (2013).