© 2016, IRJET | Impact Factor value: 4.45 | ISO 9001:2008 Certified Journal | Page 373
PAPR Reduction techniques in OFDM System Using Clipping & Filtering
and Selective Mapping Methods
Okello Kenneth
1, Professor Usha Neelakanta
21
P.G. Student, Department of Electronics & Telecommunication Engineering, Ahmedabad Gujarat, India
2
Department of Electronics & Telecommunication Engineering, Ahmedabad Gujarat, India
---***---Abstract -
Due to multiple application of OFDM signal likemilitary HF radio links, BRAN, DAB and DVB-T and there was need to change from analogy domain data sending to digital domain data sending, also changing of single carrier to multiple sub carriers’ data transmission. Orthogonal frequency division multiplexing (OFDM) plays tremendous advantages including channel conversion due it orthogonality of the sub carriers, special efficiency and robustness against ISI and ICI. One worst disadvantage of OFDM is high PAPR at the transmitter which reduces the peak power for transmission. Several techniques to reduce high PAPR including clipping and filtering, selective mapping (SLM), Partial transmit sequence (PTS), companding and Tone injection have been proposed. In this article two effective methods for multi efficiency PAPR reduction are discus and compared in terms of percentage reduction level to lowest PAPR using Mathlab simulation with QAM modulation techniques.
Key Words: OFDM,PAPR,Clipping and Filtering,Selective
Mapping (SLM), Partial Transmit Sequence (PTS), Tone Injection (TI).
1. INTRODUCTION
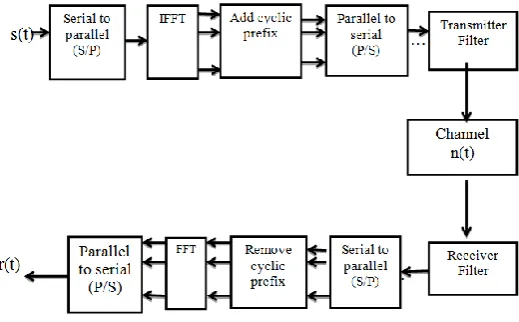
Orthogonal frequency division multiplexing (OFDM) is the key technology which is employed in 4G wireless communication systems such as Long Term Evolution (LTE), worldwide interoproperbility for microwave access (WiMAX) and Long Term Evolution Advanced (LTE-A) . OFDM are forms of multicarrier transmission for broadband wireless communication systems i.e. it has a large bandwidth up to about 20MHz. The background behind OFDM is that it divides the frequency spectrum into subcarriers and the subcarriers are made mutually independently orthogonal to each other to avoid interference. The data in each subcarrier are transforming from serial to parallel channel for simultaneous transmission in different channel. The Inverse fast Fourier transform (IFFT) is used to produce orthogonal data subcarriers where the input data samples are modulated either by (e.g. QAM or PSK) and after they are jointly correlated. The FFT transform the cyclic prefix time domain signal to it equivalent frequency spectrum. OFDM has significant challenge due to symbol time been less than
the delay spread leading to InterSymbol interference (ISI) which is overcome by cyclic prefix or guard band concept.
Fig -1: Block diagram of OFDM system
1.1 Mathematical formula of OFDM signal.
In OFDM systems, let consider data block of length
vector
,
and the duration ofany symbol in the set is which
represents one of the subcarriers set. As the N subcarriers transmit the signal in orthogonal way as in the fig (2), we
can have, where and is the
duration of the OFDM data block X. The data block for the OFDM signal is given by equation (1).
[image:1.595.311.571.280.441.2]© 2016, IRJET | Impact Factor value: 4.45 | ISO 9001:2008 Certified Journal | Page 374
Fig -2:
Frequency spectrum of original OFDM
An OFDM symbol in baseband is defined as in equation (2).
Where
,
in equation (2) denotes the complexsymbol modulating the carrier, is the time
window function defined in the interval n is the
number of subcarriers, and
is the OFDM symbol period.
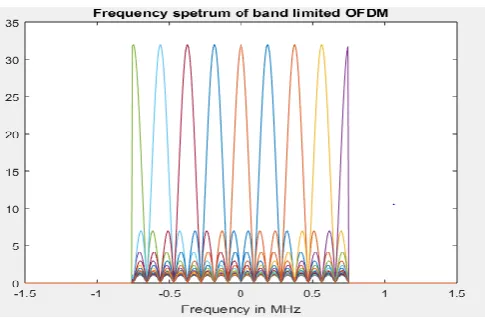
Subcarriers are space
d
apart and it isrepresented in figure (3).
Fig -3: Frequency spectrum of band limited OFDM
2. PEAK TO AVERAGE POWER RATIO (PAPR) FOR
OFDM SIGNAL:
In OFDM system, the main drawback is high peak to average power ratio (PAPR).The high PAPR is significantly caused due IFFT operation where data symbols across subcarrier add up to produce high peak power value. This causes the signal amplifiers to operate into the nonlinear region leading to in
band distortion and out of band radiation. The in-band distortion degrades system performances and out of band radiation causes the adjacent channel interference (ACI) due to neighbor band effect and degradation of bit error rate (BER) performance.
The peak to average power ratio (PAPR) of a continuous time signal is given by
PAPR=
=
(3)
And for the discrete time signal PAPR
=
(3)
Where denotes peak value,
means
average output power. E denotes the expected value; denotes the transmitted OFDM signals. If the number of subcarriers (N) is increased, the PAPR power also increases. Large
are zero mean Gaussian random variables. And
for complex Gaussian the OFDM signal is Rayleigh
distributed with variance
,
and the phase of the signal isuniform
(4)
The fixation of threshold value ranges from zero to maximum value. To calculate the threshold value the equation (5) below is used.
Threshold value is updated regularly and a CCDF curve is drawn
(6)
[image:2.595.37.280.471.630.2]© 2016, IRJET | Impact Factor value: 4.45 | ISO 9001:2008 Certified Journal | Page 375
2.1
Reduction Technique
Several techniques approaches have been proposed and implemented to reduce PAPR problem into different categories i.e. distortion and without distortion.
Distortion method includes clipping and companding whereas distortionless methods also include clipping and filtering, selective mapping, partial transmit sequence, tone injection etc.
In this section, we mainly discuss two typical techniques such as Selective Mapping and Amplitude clipping and filtering for PAPR reduction in OFDM systems.
A. Amplitude Clipping and Filtering
Amplitude clipping is one of the simplest reduction techniques for PAPR. Amplitude Clipping reduces the peak level of the input signal to a predetermined value. According to S. H. Han and J. H. Lee [1] the basic idea of this technique is to clip the parts of the signals that have high peak outside of the allowed region. The following equation (7) shows the amplitude clipping.
(7)
Where is passband clipped signal, L is pre- specified
clipping level and is passband signal
.
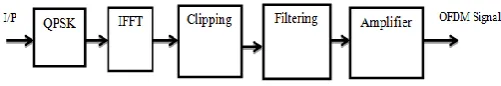
[image:3.595.302.525.177.318.2]Clipping is performed always at the transmitter; receiver signal depends on the clip signal estimated. In general, since the receiver has to calculate two important parameter like location and size of the clipping signals at one clipping per OFDM symbol. Clipping method may cause in band distortion or out of band radiation into the OFDM system leading to peak regrowth especially in nonlinear system. This may affect the bit error rate performance (BER) and increases signal to noise ratio (SNR).The outof-band signals caused can be reduced by filtering. However when the signal is clip at a certain level, some peak power reduces lower and filtering the clipped signal can reduce out-of band radiation at the cost of peak re-growth and hence as explained in fig (4).
[image:3.595.35.286.681.724.2]Fig -4:Block Diagram of Clipping and filtering process
Table -1: Parameters used for clipping and filtering
Parameter Value
Modulation QAM
Channel Models AWGN
FFT Size 256
Sub Carriers 200
Clipping Level 0.79
Phase Sequence 8
B
.
Selective Mapping Technique (SLM):The propose method for the reduction of peak to average transmit power of multicarrier modulation systems with selected mapping in 2013[7]. In selected mapping (SLM) the whole set of information symbol are loaded into the subcarrier and turn in serial and parallel after, the data block are form and then the most favorable signal with less PAPR is chosen and transmitted. The basic idea of this technique is based on the phase rotation sequence. The lowest PAPR signal shall be selected for transmission from a number of different data blocks independently.
In figure (5), Consider each data block
multiplied by U phases of length N, u=1, 2, 3…..U, resulting in U modified data blocks. To include the unmodified data block in the set of modified data blocks, take set as the only one vector
of length N. The modified data block for the phase
sequence,
,
© 2016, IRJET | Impact Factor value: 4.45 | ISO 9001:2008 Certified Journal | Page 376
Fig -5:The Block Diagram of Selected Mapping Technique
This scheme, statistically independent symbol sequence 1≤u≤U, is generated by multiplying the input data
symbol sequence and the phase rotation matrix 1≤ u ≤ U, where U is the number of candidate OFDM signals. Therefore PAPR can be expressed as equation (8)
(8) [image:4.595.323.574.134.313.2]
Where N is the sub carrier and U is the phase sequence.
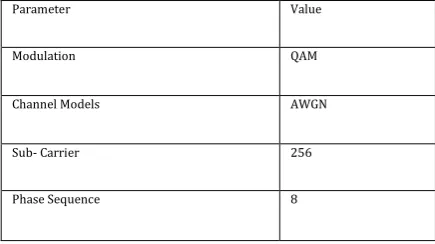
Table -2: Parameters used for Selective Mapping
Parameter Value
Modulation QAM
Channel Models AWGN
Sub- Carrier 256
Phase Sequence 8
We apply parameter in table (2) in the equation (7) to determine the reduction amplitude peak power level and the threshold value using equation (5) where the lowest PAPR is experienced.
[image:4.595.30.248.505.627.2]C
.
Simulation ResultsFig -6: Results for clipping and Filtering
In figure (6) before applying clipping and filtering, the normal OFDM signal peak power is within 0.5 with normal PAPR 7.3 After the signal is clipped the peak amplitude reduces within the range of 0.4 with different amplitude level still with distortion and peak regrowth. After filtering the signal, the peak power level decreases to 2.4 along with increase in the sampling number without any distortion. The Power of 2 and less than number of Symbols preferably < 32, gives better PAPR reduction ratio than other phases.
[image:4.595.309.561.526.666.2]© 2016, IRJET | Impact Factor value: 4.45 | ISO 9001:2008 Certified Journal | Page 377
The result in fig (7) shows that, before selective mapping theamplitude peak level is very high at 0.6 with original PAPR of 22.8 By applying Selective Mapping the peak power reduces to approximately 0.02 and hence low PAPR is experienced
3
.
CO
MPARISON BETWEEN CLIPPING AND FILTERINGWITH SELECTIVE MAPPING
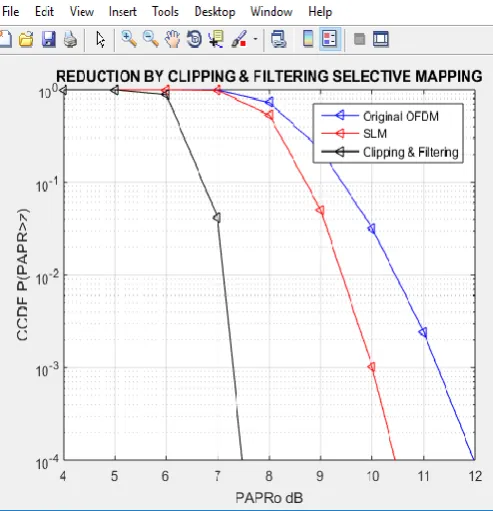
[image:5.595.301.570.172.341.2]In comparing the two methods, the efficiency of Clipping and Filtering is 61.9 % and the efficiency of selective mapping is about 21.9%. So we conclude that clipping and filtering gives more reduction in PAPR than selective mapping of about 39.9%.
Fig -8:CCDF comparing clipping&filtering with selective mapping (SLM).
[image:5.595.37.284.324.580.2]As seen from the above fig (8) clipping and filtering gives a better reduction ratio in dB using complementary cumulative distribution function (CCDF) as compared with that of selective mapping. Hence clipping and clipping methods is give preferred lowest PAPR for transmission.
Table -1: comparisons between clipping & filtering and selective mapping
Reduction techniques
Parameters Operation required at transmitters(TX) and
receiver (RX) Decrease
distortion Power
raise
Defeat Data rate
Clipping and Filtering (C&F)
No No No TX: Clipping
RX: None
Selective Mapping (SLM)
Yes No Yes TX:M times IDFTs
operations RX: Side information extraction inverse SLM
4. CONCLUSIONS
In this paper we simulate OFDM with clipping and filtering and selective mapping. Both methods reduces the peak amplitude level leading to increase sampling number, data rates, better spectral efficiency and good performance of Bit error rate (BER).
Two different modulation techniques such as QAM and QPSK are used to determine the separation distance hence, clipping & filtering and selective mapping methods lead to low PAPR.
REFERENCES
[1] S. H. Han and J. H. Lee, “An overview of peak-to-average
power ratio reduction techniques for multicarrier transmission,” IEEE Wireless Comm, vol. 12, no.2, pp.56-65, Apr. 2005.
[2] Sanjeev Saini and Dr. O.P. Sahu, “ Peak to Average Power
Ratio Reduction in OFDM System by Clipping and Filtering”, International Journal of Electronics Communication and Computer Technology (IJECCT) Volume 2 Issue 3,May 2012.
[3] R. van Nee and R. Prasad, “OFDM Wireless Multimedia
communications,” Artech House, Boston, MA, 2000.
[4] R.W.Bauml, R.F.H.Fischer, and J.B. Huber, “Reducing the
peak-to-average power ratio of multi carrier modulation by selective mapping,” IEE Electron. Lett., vol.32, pp. 20562057, Oct. 1996
[5] Malhar Chauhan, Saurabh patel, Hardik patel “ Different
© 2016, IRJET | Impact Factor value: 4.45 | ISO 9001:2008 Certified Journal | Page 378
[6] Amos Gilat, ‘MATLAB An Introduction with Application’,
Wiley India Edition 2004 [2] Foomooljareon P., and Fernando W.A.C., ‘PAPR Reduction in OFDM Systems’, Thammasat Int. J. Sc.Tech.Vol.7, No.3, September-December 2002.
[7] YasirRahmatallah, Seshadri Mohan, Member,
“Peak-To-Average Power Ratio Reduction in OFDM Systems: A Survey and Taxonomy”, IEEE Communications surveys & tutorials, vol. 15, no. 4, fourth quarter 2013.
[8] Yajun Wang, Wen Chen, Chintha Tellambura, ‘’A PAPR