© 2018, IRJET | Impact Factor value: 6.171 | ISO 9001:2008 Certified Journal | Page 3850
A
NALYSIS AND
D
ATA
C
LASSIFICATION
M
ETHODOLOGY
F
OR
D
ATA
M
INING
P
ATTERN
Dr.M.Prabakaran
1. Mrs.K.Vasuki
2Mrs.K.Rajeswari
3 1,2,3Assistant Professor.Department of Computer Science, Govt Arts College ,Ariyalur.
---***---
Abstract -
A plethora of big data applications are emerging and being researched in the computer science community which require online classification and pattern recognition of huge data pools collected from sensor networks, image and video systems, online forum platforms, medical agencies etc. However, as an NP hard issue data mining techniques are facing with lots of difficulties. To deal with the hardship, we conduct research on the novel algorithm for data mining and knowledge discovery through network entropy. We firstly introduce necessary data analysis techniques such as support vector machine, neural network and decision tree methods. Later, we analyze the organizational structure of network graphical pattern with the knowledge of machine learning methodology and graph theory. Eventually, our modified method is finalized with decision and validation implementation. The simulation results of our approach on different databases show the feasibility and effectiveness of our proposed framework. As the final part, we provide our conclusion and prospect.Key Words: Pattern Analysis and Machine Intelligence,
Data Classification Technique, Data Mining, Knowledge Discovery, Big Data and Information Security
1.INTRODUCTION
A plethora of big data applications are emerging and being researched in the computer science community which require online classification and pattern recognition of huge data pools collected from sensor networks, image and video systems, online forum platforms, medical agencies etc. However, as an NP hard issue data mining techniques are facing with lots of difficulties. These difficulties could be classified in the following parts:
(1)Pre-processing of the data in the wild. (2) Choice of proper data classification algorithm. (3) The time-consuming problem. To overcome these draw-backs, we will analyze the issue in the paper. The applications of data mining technique vary from subjects to other areas, the most essential applications and related researches could be categorized as the following parts. (1) Image, video and speech processing. In [1], Anyela et al. conducted research on objective definition of rosette shape variation using a combined computer vision and data mining approach. The pipeline provides a cost-effective and scalable way to the analysis of inherent rose shape change. Image acquisition does not require any special equipment and a computer program to realize the image processing and data analysis using open source software. In [2], Borhan, et al., design and implemented a novel tutoring
system based on data classification. In their research, they propose supervised machine learning (SML) models for speech act classification in the context of an online collaborative learning game environment. (2) Business related studies. In [3], Ryan, et al., combine the data mining technique to the educational analysis and related business model. They pointed out that analysis has become a trend in the past few years, reflected in a large number of graduate program commitment to the analysis of the analytical skills of the declaration of providing lucrative jobs, and the airport lounge waiting to be filled with advertisements from different consulting company by analyzing the commitment to a big increase in profits. In [4], Stavros, et al., designed intelligent E-business for online commerce, the combination of financial models and data analysis enhance the performance of traditional business. Business intelligence is becoming an important factor, can help organizations in the management, development and exchange their valuable information and knowledge and so on. Data mining is the main goal of the relations and the different models, but they exist in the data set between the "hidden" large amounts of data. (3) Medical Assistance and Auxiliary Medical. Shamsher’s group [5] conduct review on data-guided medical applications, they conclude that all kinds of current or potential applications of data mining technique in health informatics through some case studies published literature. In(6)Feng, et al., pointed out that medical information mining is crucial for diagnosis. Their review indicates that A large number of studies have shown that the real world research has strong external validity than conventional randomized controlled trials, evaluating the effect of intervention measures in the actual clinical, open a new path in coronary heart disease (CHD) comprehensive medical research. Comprehensive medical clinical data, however, great in number and complex data types in coronary heart disease, to explore suitable methodology of a hot topic. Data analysis and knowledge discovery from the clustered data acts as significant roles. More related applications of data mining could be found in the following literatures [7-15].
© 2018, IRJET | Impact Factor value: 6.171 | ISO 9001:2008 Certified Journal | Page 3851
2. Prior Knowledge on Data Classification
Data and pattern classification is used to classify each item in a set of cluster of data into one of predefined set of groups. Classification is a function of data mining, distributed collection in a project goal category or class. Classification is the purpose of accurately predicting each case of target class data. Classification task begins in a data set of class assignments are known. Classification of discrete doesn't mean order. Continuous, floating-point values will display a numeric value, rather than absolute, and goals. Target using regression forecast model and numerical algorithm, is not a classification algorithm. The simplest type of classification problem is binary classification. In binary classification, target attributes only two possible values: for example, the credit rating in either high or low credit rating. In the following subparts, we analyze the popular mining algorithms.
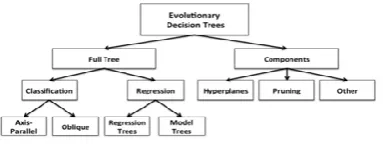
2.1. Decision Tree (DT) based Approach
[image:2.595.342.458.358.406.2]Decision tree is a kind of commonly used data mining methods. Our goal is to create a model, the predicted value of the variable target based on multiple input variables. Each internal node corresponding to one input variable, with every possible input variable values at the edge of the children. This is shown in Figure 1. Each leaf represents a target value of the variable given the value of the input variable represents the path from root to leaf. Decision tree induction algorithm is a recursive function. First of all, should choose a basic attributes as conditioned the root node. Then in order to create the most effective the most accurate tree, the root node must effectively integrate data segmentation. Each division tried to cut a set of instances, until they have the same classification. The best division is a so-called the information gain. In the following Figure 1, we show the basic components of decision tree (DT) through flow chart.
Figure 1. The Basic Component of Decision Tree (DT)
We introduce the famous C4.5 as an example. C4.5 is an algorithm used to generate a decision tree developed by Ross Quinlan [16-18]. Generation of decision tree C4.5 can be used for classification, for this reason, the C4.5 is often referred to as a statistical classifier. The detailed steps are shown in the Table 1.
Table 1. The Pseudo-code of C4.5 Algorithm
2.2. Neural Network (NN) based Approach
In more practical terms neural networks are nonlinear statistical data modeling tools. There are plenty of researches focused on the neural network theory and methodology [19-22]. They can be used to simulate the complex relationship between input and output or finding patterns in data. Using neural network as a tool, a data warehouse companies collect information from the data set is referred to as the process of data mining. The Figure 2 shows the structure.
Figure 2. The Basic Structure of Neural Network (NN)
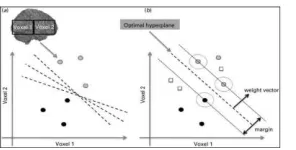
2.3. Support Vector Machine (SVM) based Approach
[image:2.595.74.266.527.599.2]© 2018, IRJET | Impact Factor value: 6.171 | ISO 9001:2008 Certified Journal | Page 3852 Figure 3. The Basic Structure of Support Vector
Machine (SVM)
The target data for classification is denoted as the formula 1. The objective function waiting to be solved is expressed in the formula 2.
2.4. Bayesian Network (BN) based Approach
[image:3.595.52.245.558.651.2]Bayesian network known as the tradition data classification algorithm win great attention from the research community. Bayesian networks known as the bayesian network is a directed acyclic graph (DAG) nodes represent random variables of bayesian sense: they may be observed that the number of latent variables, or assumed unknown parameters. Edge said conditional dependence; Node connection represents no conditionally independent variables. And the probability of each node function is denoted as input for a particular node's parent variables and values to variables are expressed as the probability of the node. The figure 4 shows the general example of the network.
Figure 4. The Traditional Structure of Bayesian Network (BN)
3.
Our Proposed Framework for
Data Mining and Knowledge
Discovery
3.1. Network Formation Procedure
Initially, an undirected and weighted network with a single connected component is built for each class. In the initial model, Gl presents the basic
class l 1,2,...,L . Therewill be a connection between two vertices, if they are between the feature vectors of the Euclidean distance (ED) of less than a predefined threshold. In addition, the connection should be inversely proportional to the weight of the vertex distance the closer, the more must connect. Therefore, the weight parameter between nodes is expressed as the formula 4.
In the constructed network, all the nodes are inner-connected under the guideline of adjacent matrix. If there is a d attribute in each data item, is said to be a dimensional data set. The second part of the i-th tuple characteristics associated with the class label of data items. The purpose of machine learning is to create a mapping from x to y, this mapping is called classifier. It is important to note that each class needs to have a network connection component, so the choice of parameters of must reflect the situation. After the step, we successfully build up our network, which is also expressed in the formula 5.
l
G i , l 1,2,..., L , i 1,2,...,u (5)
All of the prior structure of networks will be adopted in the next phase of the classification process which will be discussed in detail in the next sections.
3.2. Calculation of Network Entropy
© 2018, IRJET | Impact Factor value: 6.171 | ISO 9001:2008 Certified Journal | Page 3853
the same time respect these
interconnection model. Network entropy is the entropy of a stochastic matrix associated with the adjacency matrix [28-32]. We thereby set up the definition of stochastic matrix in the formula 6.
With this advanced a new method, we can calculate the network using the stochastic process of the proportion of pij
dynamic entropy describes the transition i j and it is the stationary distribution of
p . Joint optimization of the performance of distributed data mining system, we design a distributed online learning algorithm, and its long-term average reward the best distributed solution convergence, can get online data classification problem gives a complete knowledge of the characteristics and their classification function is applied to the data accuracy and cost. We define the regret of the difference between the total expected return best distributed classification scheme is given full knowledge classification function of the precision and the expected total return each learners use of the algorithm. We make H
p to be the dynamical entropy. The detailed induction is defined in the formula 7.
H p i H i,
where H i pijlog pij
3.3. The Regret of Learning Phase
In this subsection we define the regret as a
performance measure of the learning algorithm used by the learners. Simple, it is a pity that lost because of the unknown system dynamics. I regret that the learners' learning algorithm defined for me the best
k * x learners. The object function for the phase
is defined as the formula 8.
T T
R T
k xt x t
E I
yti yt
dk xt (8)
t 1
t
1
Data collected by the distributed processing a set of distributed heterogeneous learners with the precision of classification function is unknown. Communicate in this setting, calculation and sharing of costs make it is not possible to use the centralized data mining technology in a learners can access the entire data set. Will limit first learn a single classifier for each view example of using the tags. The most confident on the predictions of each classifier unlabeled data and then use the iteration construct additional labeled training data. By considering the different views of the same data set, the relation of certain types of data from the predefined views may be found. Another related technical committee machine, it is composed of the classifier of the object. The description is shown in the Figure 5.
Figure 4. The Description of the Learning Phase
3.4. The Decision and Validation Procedure
Finally, we will define the fuzzy classifier C that decides what class the data item belongs to. The idea to explain the property of the network to deal with random changes, so the data item does not belong to a certain class will not affect the respective network.
Therefore, the project classification is the importance of class. The SVN algorithm is a “soft” clustering method in which the objects are assigned to the clusters with a degree of belief. Therefore, an object can belong to more than one cluster with different degrees of belief. It tries to find the feature points in each cluster, named as the center of a cluster, then calculating the membership of each object in the cluster. The mathematical expression is shown as follows.
expression is shown as follows.
H Gl
i
C i
© 2018, IRJET | Impact Factor value: 6.171 | ISO 9001:2008 Certified Journal | Page 3854
k L k
i
e i
H Gl
4. Experimental Analysis and
Simulation
In order to verify the effectiveness and feasibility of our proposed methodology, we conduct numerical and experimental simulation in this section. Firstly, we introduce the experimental environment and later, we present three simulations in order to illustrate the efficiency of the proposed high level classification method when applied in real and artificial data sets and compare its results with traditional classification techniques.
4.1. Environment of the Experiment
The simulation environment is set up into the following conditions. Four physical machines (Macbook Pro) with 4 TB hard disk and 6 GB of RAM, and the simulation software is installed on Windows Win7 platform. The datasets adopted by us vary a lot. The following dataset are just examples: (1) the Seeds Data Set; (2) database from UCI;
(3) Iris data set; (4) databased from Cornell University; (5) databased from Harvard University.
(4) 4.2. Simulation through the Harvard datasets
[image:5.595.298.541.113.495.2]Harvard dataset is a database which contains 3 classes (Iris Setosa, Iris Versicolour, Iris Virginica) and 150 instances, where each class refers to a kind of plant. The Figure 5 shows our result, we could conclude that our method is robust. The separate results are shown in the Figure 6-Figure 8.
Figure 5. The Result in the Harvard Database
Figure 6. The Iris Setosa Sub-part Result
Figure 7. The Versicolour Sub-part Result
Figure 8. The Iris Virginica Sub-part Result
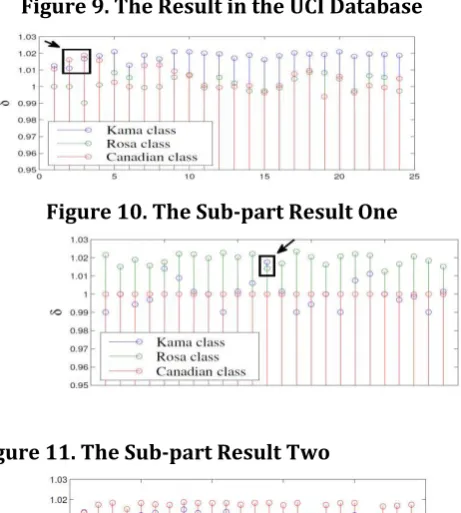
4.3. Simulation through the UCI Datasets
© 2018, IRJET | Impact Factor value: 6.171 | ISO 9001:2008 Certified Journal | Page 3855 Figure 9. The Result in the UCI Database
Figure 10. The Sub-part Result One
Figure 11. The Sub-part Result Two
Figure 12. The Sub-part Result Three
5. Conclusion and Summary
A plethora of big data applications are emerging and being researched in the computer science community which require online classification and pattern recognition of huge data pools collected from sensor networks, image and video systems, online forum platforms, medical agencies etc. However, as an NP hard issue data mining techniques are facing with lots of difficulties. In this paper, we propose a novel pattern analysis and data classification methodology for data mining and knowledge discovery. We adopt the network to modify the traditional methods. The result shows the effectiveness of our work, in the future, we plan to do more experimental analysis and mathematical research for the optimization part.
References
A. Camargo, D. Papadopoulou, Z. Spyropoulou, K. Vlachonasios, J. H. Doonan and A. P. Gay, "Objective definition of rosette shape variation using a combined computer vision
and data mining approach”, PloS one, vol. 9, no. 5, (2014), pp.
e96889.
B. Samei, H. Li, F. Keshtkar, V. Rus and A. C. Graesser, “Context-based speech act classification in intelligent tutoring systems”, In Intelligent Tutoring Systems, Springer International
Publishing, (2014),
pp.236-241.
B. Samei, H. Li, F. Keshtkar, V. Rus and A. C. Graesser, “Context-based speech act classification in intelligent tutoring systems”, In Intelligent Tutoring Systems, Springer International
Publishing, (2014),
qq.236-241.
S. Valsamidis, I. Kazanidis, S. Kontogiannis and A. Karakos, “A Proposed Methodology for E-Business Intelligence Measurement Using Data Mining Techniques”, In Proceedings of the 18th Panhellenic Conference on Informatics, ACM, (2014), pp. 1-6.
D. P. Shukla, S. B. Patel and A. K. Sen, “A literature review in health informatics using data mining techniques”, Int. J.
Softw. Hardware Res. Eng. IJOURNALS, (2014).
M. J. Berry and G. Linoff, “Data mining techniques: for marketing, sales, and customer support”, John Wiley & Sons,
Inc., (1997).
L. Vaughan and Y. Chen, “Data mining from web search queries: A comparison of google trends and baidu index”, Journal of the Association for Information Science and
Technology, vol. 66, no. 1, (2015),
rr. 13-22.
N. Sonawane and B. Nandwalkar, “Time Efficient Sentinel Data Mining using GPU”, In International Journal of Engineering Research and Technology, ESRSA Publications, vol. 4, no. 02, (2015) February.
L. E. Barrera, A. B. Montes-Servín, L. A. Ramírez-Tirado, F. Salinas-Parra, J. L. Bañales-Méndez, M. Sandoval-Ríos and Ó. Arrieta, “Cytokine profile determined by data-mining analysis set into clusters of non-small-cell lung cancer patients according to prognosis”, Annals of Oncology, vol. 26, no. 2, (2015),
pp.428-435.
J.-H. Kao, H.-I. Chen, F. Lai, L.-M. Hsu and H.-T. Liaw, “Decision Tree Approach to Predict Lung Cancer the Data Mining Technology”, In Ubiquitous Computing Application and
Wireless Sensor, Springer Netherlands, (2015), pp. 273-282.
S. García, J. Luengo and F. Herrera, “Data Sets and Proper Statistical Analysis of Data Mining Techniques”, In Data Preprocessing in Data Mining, Springer International
Publishing, (2015), pp. 19-38.
J. Moeyersoms, E. J. de Fortuny, K. Dejaeger, B. Baesens and D. Martens, “Comprehensible software fault and effort prediction: A data mining approach”, Journal of Systems and
Software, vol. 100, (2015),
qq.80-90.
M. Fujimoto, T. Higuchi, K. Hosomi, M. Takada, L. Manchikanti,
V. Pampati, R. M. Benyamin, et al., “Association between Statin
© 2018, IRJET | Impact Factor value: 6.171 | ISO 9001:2008 Certified Journal | Page 3856 Database and a Claims Database”, International Journal of
Medical Sciences, vol. 12, no. 3, (2015), pp. 223-233.
M. Maucec, A. P. Singh, S. Bhattacharya, JYarus, D. D. Fulton and J. M. Orth, “Multivariate Analysis and Data Mining of Well-Stimulation Data by Use of Classification-and-Regression Tree with Enhanced Interpretation and Prediction Capabilities”,
SPE Economics & Management Preprint, (2015).
S. García, J. Luengo and F. Herrera, “A Data Mining Software Package Including Data Preparation and Reduction: KEEL”, In Data Preprocessing in Data Mining, Springer International
Publishing, (2015),
rr. 285-313.
Y. Li, Q. Yang, S. Lai and B. Li, “A New Speculative Execution Algorithm Based on C4. 5 Decision Tree for Hadoop”, In Intelligent Computation in Big Data E.
S. Sathyadevan and R. R. Nair, “Comparative Analysis of Decision Tree Algorithms: ID3, C4. 5 and Random Forest”, In Computational Intelligence in Data Mining, Springer India, vol. 1, (2015), pp. 549-562.
S. J. Zhang, X. S. Zheng, Q. Wang, Y. W. Fan, X. DMa and X. O. Hao, “New satellite image associative classification algorithm based on gabor texture”, Remote Sensing and Smart City, vol. 64, (2015), pp. 257.
F. Hussain and J. Jeong, “Efficient Deep Neural Network for Digital Image Compression Employing
Rectified Linear Neurons”, Journal of Sensors, (2015).
W. Hung, M. Yang and D. Chen, “Parameter selection for suppressed fuzzy c-means with an application to mri segmentation”, PATTERN RECOGNITION LETTERS, vol. 27,
no. 5, (2006), pp. 424–438.
M. Gong, L. Su, M. Jia and W. Chen, “Fuzzy clustering with a modified mrf energy function for change detection in synthetic aperture radar images”, Fuzzy Ym Ranaon on, vol.
22, no. 1, (2014), pp. 98 - 109.
F. Wang, Y. Xiong and Z. Weng, “Neural Network Modeling of Submarine Shell”, In Vibration Engineering and Technology of Machinery, Springer International
Publishing, (2015), pp. 1055-1064.
H. Wang and J. Wang, “An effective image representation method using kernel classification”, in Tools with Artificial Intelligence (ICTAI), 2014 IEEE 26th International Conference on, (2014) November, pp. 853–858.
P. Chen, X. Fu, S. Teng, S. Lin and J. Lu, “Research on Micro-blog Sentiment Polarity Classification Based on SVM”, In Human Centered Computing, Springer International
Publishing, (2015), pp. 392-404.
U. Dellepiane and L. Palagi, “Using SVM to combine global heuristics for the Standard Quadratic Problem”, European
Journal of Operational Research, vol. 241, no. 3, (2015), pp.
596-605.
S. Sumit, “High performance EEG signal classification using classifiability and the Twin SVM”, Applied Soft Computing,
vol. 30, (2015), pp. 305-318.