Journal of Theoretical and Applied Information Technology 31st July 2013. Vol. 53 No.3
© 2005 - 2013 JATIT & LLS. All rights reserved.
ISSN: 1992-8645 www.jatit.org E-ISSN: 1817-3195
485
MINING STUDENTS’ ACADEMIC PERFORMANCE
1AZWA ABDUL AZIZ, 2NUR HAFIEZA ISMAIL, 3FADHILAH AHMAD
1 Lecturer, Fakulti Informatik, Universiti Sultan Zainal Abidin (UniSZA)
Kampus Gong Badak, 21300 Kuala Terengganu, Terengganu, Malaysia
2Master Candidate, Fakulti Informatik, Universiti Sultan Zainal Abidin (UniSZA)
Kampus Gong Badak, 21300 Kuala Terengganu, Terengganu, Malaysia
3 Assoc Prof., Fakulti Informatik, Universiti Sultan Zainal Abidin (UniSZA)
Kampus Gong Badak, 21300 Kuala Terengganu, Terengganu, Malaysia
E-mail: [email protected], [email protected], [email protected]
ABSTRACT
Data Mining techniques are widely used in educational field to find new hidden patterns from student’s data. The hidden patterns that are discovered can be used to understand the problem arise in the educational field. This paper surveys the three elements needed to make prediction on Students’ Academic Performances which are parameters, methods and tools. This paper also proposes a framework for predicting the performance of first year bachelor students in computer science course. Naïve Bayes Classifier is used to extract patterns using the Data Mining Weka tool. The framework can be used as a basis for the system implementation and prediction of Students’ Academic Performance in Higher Learning Institutions.
Keywords:Data Mining, Educational Data Mining, Prediction, Students’ Academic Performance
1. INTRODUCTION
Data Mining (DM), or Knowledge Discovery in Databases (KDD), is an approach to discover useful information from large amount of data [1]. DM techniques apply various methods in order to discover and extract patterns from stored data. The pattern found will be used to solve a number of problems occurred in many fields such as education, economic, business, statistics, medicine, and sport. The large volume of data stored in those areas demands for DM approach because the resulting analysis is much more precise and accurate.
In recent years, there has been increasing interest in the use of DM to investigate educational field [1, 2, 3, 4]. Educational Data Mining (EDM) is concerned with developing methods and analysing educational content to enable better understanding of students’ performance [3, 4]. It is also important to enhance teaching and learning process.
There are various EDM methods and algorithms used to discover hidden patterns and relationships which include prediction, clustering and relationship mining. The goal of prediction is to develop a model which can infer a single aspect of the data (predicted parameter) from some combination of other data (predictor parameters).
Classification, which is one of the prediction types classifies data (constructs a pattern) based on the training set and uses the pattern to classify a new data (testing set). Clustering is the process of grouping records in classes that are similar, and dissimilar to records in other classes. In relationship mining, the goal is to discover the relationship between variables [1, 3].
Patterns that are discovered by DM methods from educational data can be used to enhance decision making in terms of identifying students at risk, decreasing student drop-out rate, increasing student's success, and increasing student's learning outcome [2]. The extracted patterns can also discover students’ learning behaviours and characteristics which influence their academic performances. These aspects need to be looked into very closely so that the application of DM technique in the educational field produces a promising result.
486 (NBC) is adopted for pattern extraction using Waikato Environment for Knowledge Analysis (Weka) DM tool. All these components make up the proposed framework for SAP prediction.
2. PREDICTION
Prediction on SAP is one of the hottest topics in Higher Learning Institutions (HLI). Prediction methods in EDM have two main objectives; to study what features of a model are important for predicting, and to give information about underlying construct [1]. There have been numerous studies done in constructing predictive models for various purposes in the education field. For example, the study has been done by attempting to cluster students into three groups such as strong ability, medium ability, and low ability. The 'strong ability', students with a high probability of succeeding until the last semester, the 'medium's ability' and 'low ability', students who may need help from educators. For example, if the prediction results show that certain students would be 'low ability', the educators can pay more attention to them by giving them extra lesson and assignment to improve their performances [5]. The DM prediction technique is used to classify the most effective factors to determine a SAP and then applied these factors to improve the SAP in the particular subjects and courses. To produce an effective predictive model, it requires good input data (parameter), suitable DM methods and tools for the data.
2.1
ParametersThere have been many studies conducted to identify the possible parameters that contributed to the successfulness of student grade in academic especially in computer science course. Previous achievement in Mathematics subject [6, 7, 8, 9, 10], English language subject [6, 7, 8, 10], demographic information content such as age [8, 10, 11, 12], gender [5, 6, 7, 8, 10, 12], race [7, 12] and hometown location [7] are the common parameters that contributed to the students’ success. The family income parameter also were highly correlated with the SAP [13, 14, 15].
The parameter such as a university entry mode or admission type has become the selected parameter to be explored by some researchers [5, 16]. The examples of university entry mode parameter for bachelor students in the Malaysia case study are Matriculation, Diploma and Malaysian Higher School Certificate (MHSC).
The students' ability and status in studies can be shown based on Grade Point Average (GPA) and Cumulative Grade Point Average (CGPA) obtained in every semester. These two parameters are the common parameters used to measure the SAP [4, 7, 9, 11, 12]. During the data preparation stage in DM process, the numerical values of these parameters can be categorized into several groups such as excellent, average and weak. Besides, the course assessment parameter is also an important predictor used for measuring SAP [5, 12, 17]. Course assessment is the continuous assessment throughout the semester for the lesson activities such as quizzes, assignments, tests, exams and projects. Normally, the students’ lesson activities are measured and graded based on the awarded marks. The research revealed that continues assessments and examination scores were contributing to the students’ final grades in a particular subject, which also in some cases related to their performance in other subjects, and the final grade status before graduation. It is significantly beneficial if DM could be adopted to assist students to get better grades throughout their learning processes.
Nowadays, the researchers also show their interest in non-technical parameters such as students’ personality types [6, 7, 8, 18], learning styles [11, 18] and their behaviours [19]. The data are normally collected by using several instruments: Felder Index of Learning Styles (ILS), the Kolb Learning Styles Inventory II ’85, the Keirsey Temperament Sorter, and The Soloman-Felder Index of Learning Styles. Previous studies showed that learning styles and personality types could affect students’ performance in computer science courses.
Based on the past research, six parameters were selected for the SAP which include:
1. GPA, 2. Race, 3. Gender, 4. Hometown, 5. Family income and 6. University entry mode.
These parameters are selected to determine whether they affect the SPA of the first year bachelor students in computer science course at the FIT, UniSZA.
2.2
MethodsJournal of Theoretical and Applied Information Technology 31st July 2013. Vol. 53 No.3
© 2005 - 2013 JATIT & LLS. All rights reserved.
ISSN: 1992-8645 www.jatit.org E-ISSN: 1817-3195
487 knowledge, which would improve the quality of educational processes [20]. Many studies have applied DM methods to predict SAP using some current popular DM methods such as classification, clustering, and association rule [20]. The primary goal of using EDM methods for SAP prediction is to develop a prediction model for the overall performance of the students in a selected course using their performance in prior courses as predictor parameters. Then, the model can be used by the lecturers to assist the students to identify their problems and hence excel in their studies [17].
The goal of classification method is to classify the students’ dataset to the predefined classes or groups. The method is a supervised technique and it is also called direct learning because the classes are predefined before extracting patterns on the target data [21, 22]. Classification techniques such as Decision Tree [8, 11, 13, 19], NBC and Neural Network are the most frequently applied techniques in EDM. The Decision Tree model is actually mimicking a tree structure. Decision Tree is used to make a classification by traversing the tree branches on satisfied condition from the root until reaching a leaf of the tree, which will correspond to a class label assigned to the leaf. This method can be applied to the students’ data set to classify students into various groups of successful and unsuccessful students. By identifying these students, HLI can decide which types of students are more successful than others. Consequently, academic help can be provided to the students who are less potential to be successful [20]. Decision Tree becomes a popular method in EDM because it provides an intuitive and human friendly explanation of the result [23] for decision makers to make further action.
NBC uses the Bayes’ probability theory which assumes that the effect of an attribute value of a given class is independent of the values of the other attributes. It represents a descriptive and predictive approach to predict the class membership for a target tuple [24]. NBC is easy to use, capable to predict the unseen data, work well in various mediums with less error rate, and gives the highest accuracy compared to other methods [13, 14, 24, 25]. When applied to the existing students’ data sets, predictive models can be generated to assist in the management of students’ dropout and to predict the performance of the new intake students [15].
Artificial Neural Network (ANN) is based on the human brain architecture that consists of multiple processing layers connected with nodes. ANN
method is used in the educational field for predicting and classifying SAP [5, 8, 9, 12].
Outstanding ability to derive meaning from complex data, extract patterns and detect data trends are among the capability of ANN [9]. These operations are sometimes too arduous to be carried out by human or ordinary calculation.
Clustering is a descriptive and unsupervised learning task. Clustering is quite similar to classification except that the groups or classes are not predefined [22]. In clustering, no parameter is selected as a target but the relationship between parameters can be discovered based on the formed clusters. The most popular method for prediction in clustering is K-means. K-means clustering algorithm is used to automatically cluster the students. This method is used to classify the students’ performance according to learning style which is visual, active and sequential [11]. However, the cluster model has a drawback that is no clear rules to define each cluster [8]. This drawback can be solved by combining several methods which are statistical methods, decision trees and association rules. These last two methods are part of DM techniques. Statistical methods are used to define weight for each selected parameter that is useful in developing decision tree. The finding from this study shows that the percentage of correctness in predicting breast cancer disease are 96.57% [26].
Association Rule (AR) tends to determine which parameters are closely related to each other and have relations among them [23]. Apriori algorithm is one of the popular methods in AR. AR has been applied in EDM for student profiling and grouping based on the students’ academic records to predict their academic trends and patterns [6, 27]. There are many studies that combine different EDM methods for the investigation of SAP [8, 20, 27]. The advantage of combining methods is to support each other’s drawback in order to produce good/accurate result.
488
2.3
ToolsDM tools are among the variety of analytical tools for data analysis. Users are allowed to analyse a large database from many different dimensions, categorize it, and summarize the identified relationships [28]. The tools are powerful because they can provide the right information which users can benefit from. The tools can be divided into two types, which are open source/non-commercial software and commercial software. Among the several open sources tools that are commonly used are Weka, RapidMiner, Keel, ROSETTA, and Knime. While, the tools for commercial purpose are Clementine, Neuro Shell Classifier, and ANOVA. These tools have their own strengths and weaknesses such as in terms of data types and the application methods.
Weka tool is a collection of machine learning algorithms used for data classification, clustering, association rule, and evaluation [6, 11, 13, 15, 27]. Its algorithms can either be applied directly to a dataset from their own interface or be used in user own Java code. All of them contain tools for data pre-processing, classification, regression, clustering, association rule and visualization [29]. In education, Weka has been widely used to make prediction due to its efficiency in exploring, analysing and predicting the students’ behaviour [6, 11, 13, 14, 15, 24, 25, 27].
RapidMiner or formerly called Yet Another Learning Environment (YALE) is another popular DM tool. It also provides a rich variety of DM methods and has an operator that optimizes the feature selection. It has the capability to assist in choosing the right parameter that are best describe the model by obtaining the best possible performance of a given model [14]. It also can be used to graph a picture of student group according to their performance [19].
Another non-commercial DM tool is Knowledge Extraction based on Evolutionary Learning (Keel) built using Java codes. Keel is normally designed more for power and flexibility than for simplicity, and provides flexibility for supervised or unsupervised learning methods [29]. ROSETTA is a rough classifier tool used as a pattern extraction tool. This toolkit is also applied in education which is to mining the students’ programming performance [7]. Open source software Konstanz Information Miner (Knime) is used to predict the students’ results using NBC method [25]. Knime is the one of the good open source DM systems because it has excellent performance [30].
Clementine, Neuro Shell Classifier, ANOVA, SPSS, and Matlab are also software products that are commonly used in DM. There are numerous DM techniques available in Clementine, such as Apriori algorithm, Decision Tree, K-means clustering, ANN, etc. For EDM, Clementine desktop software provides an effective methodology to compare the various classifications of the training data and evaluate the test and validation datasets [12]. Another tool like Neuro Shell Classifier can be employed as one of the ANN data mining tools and be used to predict the performance of students in a computer programming [9]. ANOVA the statistical software analysis is used to predict academic performance [10].
Among the DM tools presented in this paper, Weka is chosen for this study. The choice is due to its open source nature which can be easily downloaded from the internet. The tool is written in Java code complete with a suite of Java packages which are portable to all computer platforms.
2.4
Review Of Main Components In SAPPrediction
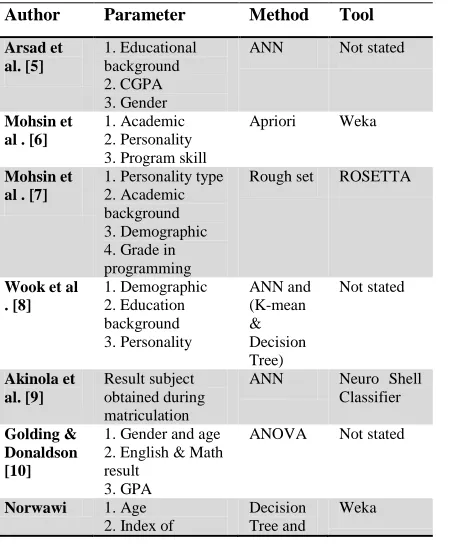
[image:4.612.311.544.460.734.2]There are three main components in prediction which are parameter, method and tool. Table 1 summarizes, the main components in prediction that are used to discover patterns in SAP.
Table 1: Example Of Main Components In Prediction From Previous Papers
Author Parameter Method Tool
Arsad et al. [5]
1. Educational background 2. CGPA 3. Gender
ANN Not stated
Mohsin et al . [6]
1. Academic 2. Personality 3. Program skill
Apriori Weka
Mohsin et al . [7]
1. Personality type 2. Academic background 3. Demographic 4. Grade in programming
Rough set ROSETTA
Wook et al . [8]
1. Demographic 2. Education background 3. Personality
ANN and (K-mean & Decision Tree)
Not stated
Akinola et al. [9]
Result subject obtained during matriculation
ANN Neuro Shell
Classifier
Golding & Donaldson [10]
1. Gender and age 2. English & Math result
3. GPA
ANOVA Not stated
Norwawi 1. Age
2. Index of
Decision Tree and
Journal of Theoretical and Applied Information Technology 31st July 2013. Vol. 53 No.3
© 2005 - 2013 JATIT & LLS. All rights reserved.
ISSN: 1992-8645 www.jatit.org E-ISSN: 1817-3195
489
et al. [11] learning style
dimension 3. Result on programming subject
K-means
Ogor [12] 1. Demographic
2. Course assessment data
ANN and Decision Tree
Clementine
Shana & Venkatach alam. [13]
1. Family background 2. Schooling information 3. Academic information 4. Personal information
NBC and Decision Tree
Weka
Sembiring et al. [19]
1. Interest 2. Study behaviour 3. Engage time 4. Believe 5. Family support 6. Demographic 7. CGPA
SSVM, K-Means and Decision Tree
Rapidminer
Various authors had applied parameter, method and tool in their studies [5, 6, 7, 8, 9, 10, 11, 12, 13, 19]. Sembiring, et al [19] conducted a SAP study on 1000 students in the third semester of 2007/2008 with three different majors in the Faculty of Computer System and Software Engineering at Universiti Malaysia Pahang (UMP). This study tends to categorize students based on CGPA obtained into five groups which are excellent, very good, good, average, and poor. The parameter used were interest, study behaviour, engage time, believe, and family support. Using Rapidminer tool, the Smooth Support Vector Machine (SSVM) classification and Kernel K-means clustering techniques were applied to students’ data to analyse the relationships between students’s behavioural and their success. The highest accuracy obtained is for the prediction of “poor” performance which is 93.7%.
NBC and Decision Tree using the Weka tool is also applied to build a model to predict the result of students in ‘C’ Programming [13]. There were 182 records from student dataset had been collected from year 2008 to 2010. 13 parameters were used from four initial categories which are family background, schooling information, academic information, and personal information. The outcome of their result shows that NBC gives the highest accuracy (82.4%) while Decision Tree based algorithm showed considerable accuracy (80.2%).
Another study done by Mohsin, et al [6] to investigate the significant factors that may influence students' programming performance using
the DM technique at Universiti Utara Malaysia. Students’ information from 4 different bachelor programs which were Bachelor in Information Technology, Bachelor in Multimedia, Bachelor in Decision Science and Bachelor in Education specializing in IT were collected. The dataset consist of 419 records and the parameters used are students’ personality type, academic background, demographic information and grade obtained in programming subject. The extracted result revealed that the student who had been exposed to programming, and scored well in Mathematics and English prior to entering university were among the strong indicators that contributed to good programming grades.
This study focuses on all of the three main components discussed in this section. The data for each of the component is gathered, experimented and analysed in order to make a prediction for SAP at UniSZA.
3.
CURRENT PROBLEM490 the first year bachelor students at FIT. The development of effective systems to predict SAP is very important to provide more information about the students to the educators. Therefore, the educators would know how the first year students’ will perform in their academic from the earliest moment. A prototype system will be developed using the discovered patterns that are extracted from the DM process. In additional, the system can work as a helping tool for educators to plan the teaching materials in order to improve students’ performance, and to decrease the failure rate in computer science course.
4.
THE PROPOSED FRAMEWORK FORPREDICTING SAP
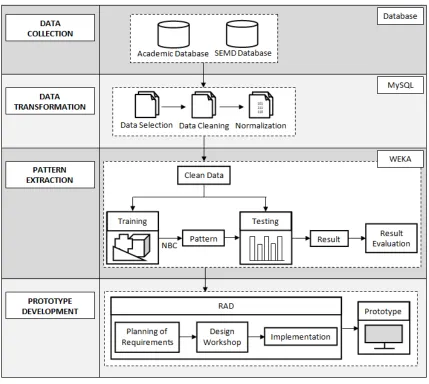
This section will present the new proposed framework in predicting SAP by using EDM technique. The proposed framework is based on Mohsin et al.[6] DM model development phases. This model is selected for two reasons: 1) Using the same steps in extracting patterns from databases. 2) The parameters are collected from two different locations. The newly proposed framework takes into consideration for different parameters, DM method, and tool. The framework consists of four stages, which are data collection, data transformation, pattern extraction, and prototype development.
[image:6.612.93.522.320.704.2]The detail explanation about all stages will be described in the next subsections.
491
4.1
Data CollectionIn this stage, the data is collected from two different databases. First, the main(most of the parameters are taken) data is collected from the Academic Department of the UniSZA database. Second, the additional parameters are taken from SEMD database or widely known as a University Center Unit (UCU). This data contains the information about Bachelor of Computer Science students, FIT, UniSZA. In this stage, the parameters that are stored in different databases will be joined in a single table using MySQL/PHP programming.
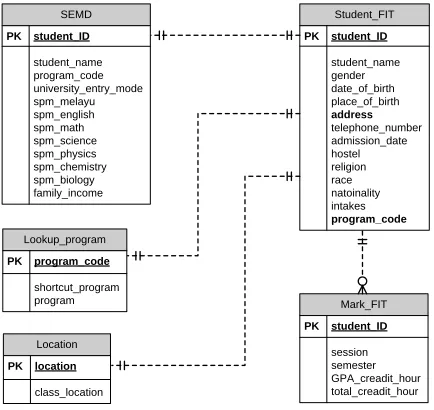
The figure 2 below show the tables involve in managing students’ information data using the Entity Relationship Diagram (ERD).
Lookup_program
PK program_code
shortcut_program
program Mark_FIT
PK student_ID
session semester GPA_creadit_hour total_creadit_hour Location
PK location
class_location SEMD
PK student_ID
student_name program_code university_entry_mode spm_melayu spm_english spm_math spm_science spm_physics spm_chemistry spm_biology family_income
Student_FIT
PK student_ID
student_name gender date_of_birth place_of_birth
address
telephone_number admission_date hostel religion race natoinality intakes
[image:7.612.90.307.307.512.2]program_code
Figure 2: The ERD for students’ data
4.2
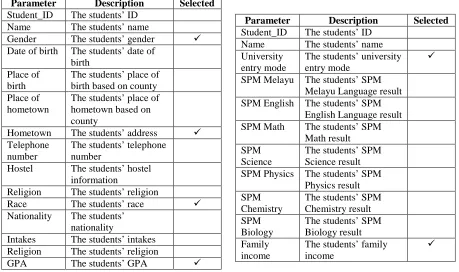
Data TransformationTo improve the input data quality for mining, the data transformation stage is carried out. This stage consists of data selection, data cleaning, and normalization. In data selection phase, only a number of parameters are selected for DM. The parameters extracted from Academic Department, UniSZA database are gender, hometown, race, and GPA (Table 2) while the parameters extracted from SEMD database are students’ university entry mode and family income (Table 3). The data cleaning process will remove and fill in the missing or incomplete data. The next phase is normalization where the data will be transformed into categorical values (Table 4). For example, the
parameter for hometown will be categorized into two ranges Town, and Rural.
Below is a Relational Database Schema that is interpreted from MySQL/PHP programming in the data selection process. The steps are:
Step 1:
Select the Bachelor of Computer Science programme students' data from the raw data that contained all the FIT students’ information taken from the Academic Department database. The FIT raw data named is “student_FIT” and Bachelor of Computer Science programme code is “c10”. The new extracted data were saved in the new table named “c10”.
σcode=c10(student_FIT) (1)
Step 2:
The students’ ID from c10 table are matched with the students’ ID from Mark_FIT table to obtain the students’ GPA during 1st semester and the new selected data were saved in the new table named “c10_1”.
c10 ⋈c10.id=mark.id(σsem=1mark_FIT) (2)
Step 3:
The students’ address in table c10_1 was matched with location table to categorize the students’ hometown location into “Town” or “Rural” . After that, the selected data were saved in the new table named “c10_sem1”.
c10_1 ⋈c10_1.hometown=�'%',location.class,'%'�town (3)
Step 4:
By using students’ ID as a matching key, all the attributes in SEMD table is combined with all attributes c10_sem1 table and saved it’s in the new table named “c10_sem1_town”.
c10_sem1 ⋈c10_sem1.id=SEMD.idSEMD (4) Step 5:
At last, 6 parameters are selected to be mined. The parameters are gender, race, hometown, GPA, family income and university mode entry.
∏gender,race,hometown,GPA,income,admission (5)
492
Parameter Description Selected
Student_ID The students’ ID Name The students’ name
Gender The students’ gender
Date of birth The students’ date of birth
Place of birth
The students’ place of birth based on county Place of
hometown
The students’ place of hometown based on county
Hometown The students’ address Telephone
number
The students’ telephone number
Hostel The students’ hostel information
Religion The students’ religion
Race The students’ race
Nationality The students’ nationality
Intakes The students’ intakes Religion The students’ religion
[image:8.612.83.542.120.392.2]GPA The students’ GPA
Table 2: The Selected Parameters From The Unisza Academic Department Database
Parameter Description Selected
Student_ID The students’ ID Name The students’ name University
entry mode
The students’ university entry mode
SPM Melayu The students’ SPM Melayu Language result SPM English The students’ SPM
English Language result SPM Math The students’ SPM
Math result SPM
Science
The students’ SPM Science result SPM Physics The students’ SPM
Physics result SPM
Chemistry
The students’ SPM Chemistry result SPM
Biology
The students’ SPM Biology result Family
income
The students’ family income
Table 3: The Selected Parameters From The SEMD Database
Parameter Category
Gender Male, Female
Race Malay, Chinese, Indian
Hometown Town, Rural
University entry mode
STPM, Diploma, Matriculation Family income 0- no income
1- RM1– RM500 2- RM5001– RM1000 3- RM1001 – RM2000 4- RM2001 – RM3000 5- RM3001 – RM4000 6- RM4001 – RM5000 7- RM5001 – RM7500 8- RM10001 and above GPA in 1st semesters Poor - 0.00 – 1.99
Average - 2.00 – 2.99 Good – 3.00 – 4.00
[image:8.612.192.450.423.691.2]493
4.3
Pattern ExtractionIn pattern extraction stages, Weka DM open source tool will be used to predict the SPA of each student which is based on his GPA. The “arff” file format is created to be used in the NBC and to generate predictive patterns for SAP. This stage consists of five phases which are training, pattern, testing, result, and result evaluation. In this stage, the cleaned data will be divided into two parts, training data and testing data. The objective of training data is to construct a pattern using NBC the DM classification method. After that, the pattern which extracts from training set will be applied on testing data to produce a result. The result received from the testing data process will be evaluated by estimating the pattern accuracy. If the result accuracy is acceptable, then the prediction pattern can be implemented in the prototype.
4.3.1 NBC algorithm
The NBC algorithm works as follows (See [31]):
Let D be a training set of tuples and their associated class labels. As usual, each tuple is represented by an n-dimensional attribute vector, X=(x1, x2,…, xn), depicting n measurements made on the tuple from n
attributes, respectively, A1, A2,….., An.
Suppose that there are m classes, C1, C2,,…,Cm. Given a tuple, X, the classifier will predict that X
belongs to the class having the highest posterior probability, conditioned on X. That is, the NBC predicts that tuple X belongs to the class Ci if and only if
P (Ci|X) > P (Cj|X) for 1 ≤ j ≤ m, j ≠ i (1)
Thus we maximize P(Ci|X). The class Ci for which
P(Ci|X) is maximized is called the maximum
posteriori hypothesis. By Bayes’ theorem,
P (Ci|X)=
P(X|Ci)P(Ci)
P(X) (2)
As P(X) is constant for all classes, only P(X|Ci)
P(Ci) need be maximized. If the class prior probabilities are not known, then it is commonly assumed that the classes are equally likely, that is,
P(C1)=P(C2)=…=P(Cm), and we would therefore maximize P(X|Ci). Otherwise, we maximize
P(X|Ci)P(Ci). Note that the class prior probabilities may be estimated by P(Ci)=|Ci,D|/|D|, where |Ci,D| is the number of training tuples of class Ci in D.
Given data sets with many attributes, it would be extremely computationally expensive to compute
P(X|Ci). In order to reduce computation in evaluating P(X|Ci), the naïve assumption of class conditional independence is made. This presumes that the values of the attributes are conditionally
independent of one another, given the class label of the tuple (i.e., that there are no dependence relationships among the attributes). Thus,
P(X|Ci)=�P(xk|ci)
n
k=1
=P(𝑥1|Ci)×P(𝑥2|Ci)×…×P(xn|Ci) (3)
We can easily estimate the 𝑃(𝑥1|𝐶i) ×𝑃(𝑥2|𝐶i) ×
… ×𝑃(𝑥n|𝐶i) from the training tuples. Recall that here Xk refers to the value of attribute Ak for tuple X. For each attribute, we look at whether the attribute is categorical or continuous-valued. For instance, to compute P(X|Ci), we consider the following:
• If Ak is categorical, then P(𝑥Rk|Ci) is the number of tuples of class Ci in D having the value xk for Ak, divided by |Ci,D|, the number of tuples of class Ciin D.
• If Ak is continuous valued, then we need to do a bit more work, but the calculation is pretty straightforward. A continuous-valued attribute is typically assumed to have a Gaussian distribution with a mean μ and standard deviation σ, defined by
g(x,µ,σ)= 1
√2πσe
-(x-µ)2
2σ2 (4)
So that
P(xk|Ci)=g(xk,μci,σci) (5)
We need to compute 𝜇ci and 𝜎ci, which are the mean and standard deviation, of the values of attribute Ak for training tuples of class Ci. We then plug these two quantities into the above equation together with 𝑥k to estimate 𝑃(𝑥k|𝐶i).
In order to predict the class label of X,
P(X|Ci)P(Ci) is evaluated for each class Ci. The classifier predicts that the class label of tuple X is the class Ci if and only if
P(X|Ci)P(Ci)>P(X|Cj)P(Cj) for 1 ≤ j ≤ m, j ≠ i (6)
In other words, the predicted class label is the class
Ci for which P(X|Ci)P(Ci) is the maximum.
4.4
Prototype Development494 Requirements, Design Workshop and Implementation. In the requirements planning phase, the objectives and information requirements of the system need to be identified. The RAD design workshop phase involves two subphases which are designed and refined. In design subphase, the model of required system is designed and should match with the software requirement specifications. In construction subphase, the system is constructed based on the system model. If there are any changes on the system requirement, then the changes are made in the model and then the system. This modification process can keep repeating until the system meets the objective. In the implementation phase, the system will be tested and implemented in the real world at system management FIT, UniSZA to predict SAP of new admission bachelor students.
5.
CONCLUSIONThe HLI's main objective is to provide the best quality education to its students and to improve the quality of managerial decisions. Prediction of SAP helps educators to get a better understanding or big picture on how the students will perform in their studies. The prediction model acts like a warning system to detect potential weak students, so that the educators can take an appropriate action towards them. For an instant, they can give advices to prevent failure in the examinations or early desertion of studies. The proposed framework for predicting SAP based on the selected parameters and NBC is presented. This study will be proceeded with the implementation of the framework in order to test for its applicability and prediction accuracy.
REFRENCES:
[1] Sachin, R. B., & Vijay, M. S, “A Survey and Future Vision of Data Mining in Educational Field”, Paper presented at the Advanced Computing & Communication Technologies (ACCT), Second International Conference on 7-8 Jan. 2012.
[2] Delavari, N., Shirazi, M. R. A., & Beikzadeh, M. R, ”A new model for using data mining technology in higher educational systems”,
Paper presented at the Information Technology Based Higher Education and Training (ITHET), Proceedings of the FIfth International Conference on, 31 May-2 June 2004.
[3] R. Baker, “Data mining for education,” in International Encyclopedia of Education, B.McGaw, P. Peterson, and E. Baker, Eds., 3rd ed. Oxford, U.K.: Elsevier, 2010.
[4] Azwa Abdul Aziz, W. M. R. W. I., Hasni Hassan, Julaily Aida Jusoh, “Intelligent System for Personalizing Students’ Academic Behaviors- A Conceptual Framework”,
International Journal on New Computer Architectures and Their Applications (IJNCAA) : The Society of Digital Information and Wireless Communications, 2(1), 2012, 138-153. [5] Arsad, P. M., Buniyamin, N., Manan, J.-L. A., & Hamzah, N, “Proposed Academic Students' Performance Prediction Model: A Malaysian Case Study”, 3rd International Congress on Engineering Education (ICEED), 2011.
[6] Mohsin, M. F. M., Wahab, M. H. A., Zaiyadi, M. F., Norwawi, N. M., & Hibadullah, C. F, “An Investigation into Influence Factor of Student Programming Grade Using Association Rule Mining”, Advances in Information Sciences and Service Sciences, Volume 2(2.3), June 2010.
[7] Mohsin, M. F. M., Norwawi, N. M., Hibadullah, C. F., & Wahab, M. H. A., “Mining the student programming performance using rough set”,
Paper presented at the Intelligent Systems and Knowledge Engineering (ISKE), International Conference on 15-16 Nov. 2010.
[8] Wook, M., Yahaya, Y. H., Wahab, N., Isa, M. R. M., Awang, N. F., & Hoo Yann, S., “Predicting NDUM Student's Academic Performance Using Data Mining Techniques”,
Paper presented at the Computer and Electrical Engineering (ICCEE), Second International Conference on, 28-30 Dec. 2009.
[9] Akinola, O. S., Akinkunmi, B. O., & Alo, T. S., “A Data Mining Model for Predicting Computer Programming Proficiency of Computer Science Undergraduate Students”, African Journal of Computing & ICT, Vol 5(No.1), 2012, pp 43– 52.
[10] Golding, P., & Donaldson, O., “Predicting Academic Performance”, Paper presented at the Frontiers in Education Conference, 36th Annual, 27-31 Oct. 2006.
[11] Norwawi, N. M., Abdusalam, S. F., Hibadullah, C. F., & Shuaibu, B. M., “Classification of students' performance in computer programming course according to learning style”, Paper presented at the Data Mining and Optimization (DMO), 2nd Conference on, 27-28 Oct. 2009.
495
Mechanics Conference (CERMA), 25-28 Sept. 2007.
[13] Shana, J., & Venkatachalam, T., “Identifying Key Performance Indicators and Predicting the Result from Student Data”, International Journal of Computer Applications (0975 – 8887), Volume 25(No.9), July 2011.
[14] Garcia, E. P. I., & Mora, P. M., “Model Prediction of Academic Performance for First Year Students”, Paper presented at the Artificial Intelligence (MICAI), 10th Mexican International Conference on, Nov. 26 2011-Dec. 4 2011.
[15] Pal, S., “Mining Educational Data Using Classification to Decrease Dropout Rate of Students”, International Journal Of Multidisciplinary Sciences And Engineering, Vol. 3(5), May 2012.
[16] Othman, H., Nopiah, Z. M., Asshaari, I., Razali, N., Osman, M. H., & Ramli, N., “A Comparative Study of Engineering Students on Their Pre-University Results with Their First Year Performance at FKAB, UKM”, Seminar Pendidikan Kejuruteraan dan Alam Bina (PeKA), 2009.
[17] Chamillard, A. T., “Using student performance predictions in a computer science curriculum”,
SIGCSE Bull., 38(3), 2006, 260-264.
[18] Chamillard, A. T., & Sward, R. E., “Learning styles across the curriculum”, SIGCSE Bull., 37(3), 2005, 241-245.
[19] Sembiring, S., Zarlis, M., Hartama, D., S, R., & Wani, E., “Prediction of Student Academic Performance by An Application of Data Mining Techniques”, International Conference on Management and Artificial Intelligence IPEDR, IACSIT Press, Bali, Indonesia, vol.6, 2011. [20] Kumar, S. P., & Ramaswami, K. S., “Fuzzy K-
means cluster validation for institutional quality assessment”, Paper presented at the Communication and Computational Intelligence (INCOCCI), International Conference on, 27-29 Dec. 2010.
[21] Moucary, C. E., “Data Mining for Engineering Schools”, International Journal of Advanced Computer Science and Applications (IJACSA), Vol. 2(10), 2011.
[22] Deshpande, S. P., & Thakare, V. M., “Data Mining System and Applications: A Review”,
International Journal of Distributed and Parallel systems (IJDPS), Vol.1(No.1), September 2010.
[23] Larose, D. T., “Discovering Knowledge in Data : An Introduction to Data Mining”, Hoboken, NJ, USA: Wiley, 2005.
[24] Pandey, U. K., & Pal, S., “Data Mining : A prediction of performer or underperformer using classification”, International Journal of Computer Science and Information Technologies (IJCSIT), Vol. 2 (2), 2011.
[25]Sharma, M., & Mavani, M., “Development of predictive model in education system: using Naïve Bayes classifier”, Paper presented at the Proceedingsof the International Conference & Workshop on Emerging Trends in Technology,
2011.
[26] Xiangchun, X., Yangon, K., Yuncheol, B., Dae Wong, R., & Soo-Hong, K., “Analysis of breast cancer using data mining & statistical techniques”, Paper presented at the Software Engineering, Artificial Intelligence, Networking and Parallel/Distributed Computing, First ACIS International Workshop on Self-Assembling Wireless Networks. SNPD/SAWN, Sixth International Conference on, 23-25 May 2005. [27] Parack, S., Zahid, Z., & Merchant, F.,
“Application of data mining in educational databases for predicting academic trends and patterns”, Paper presented at the Technology
Enhanced Education (ICTEE), IEEE
International Conference on, 3-5 Jan. 2012. [28] Nanda, A., & Rout, S. K., “Data Mining &
Knowledge Discovery in Databases: An AI Perspective, Proceedings of National Seminar on Future Trends in Data Mining (NSFTDM), Organenised by Department of Computer Science, Gandhi Engineering college, Bhubaneswar, 10th may, 2010.
[29] Zorrilla, M., Garcia, D., & Alvarez, E., “A decision support system to improve e-learning environments”, Paper presented at the Proceedings of the 2010 EDBT/ICDT Workshops, 2010.
[30] Chen, X., Ye, Y., Williams, G., & Xu, X., “A survey of open source data mining systems”,
Paper presented at the Proceedings of the 2007 international conference on Emerging technologies in knowledge discovery and data mining, 2007.